
This model is similar to our iM-BestogaX-5 System which is partially hedged by shortening SSO. But the underlying component models of the iM-BestogaX-5(SDS) System use a long SDS hedge instead of short SSO. The Trader model is partially hedged long 60% SDS, and the Investor model long 40% SDS.
Historic simulated performance
In the Figure-1 below, the red graph represents the simulated performance of the model and the blue graph shows the performance of the benchmark SPY.
- This combination model shows a simulated annualized return of 32.3% from January 2000 to April 2016, and maximum drawdowns would have been -16.9% in the year 2000.

Return and risk figures for this combination model are shown in the table below.
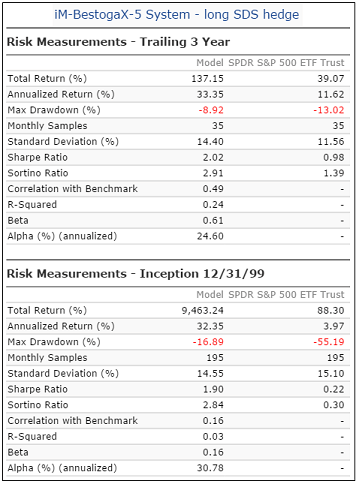
The simulated trading performance of the system from Feb-2014 to Apr-2016 is shown in Figure-2 below. The total return would have been 92% with maximum drawdown of -9.0%. It is apparent that the model continued to perform well during the period when returns for the general market were stagnant, or lower.
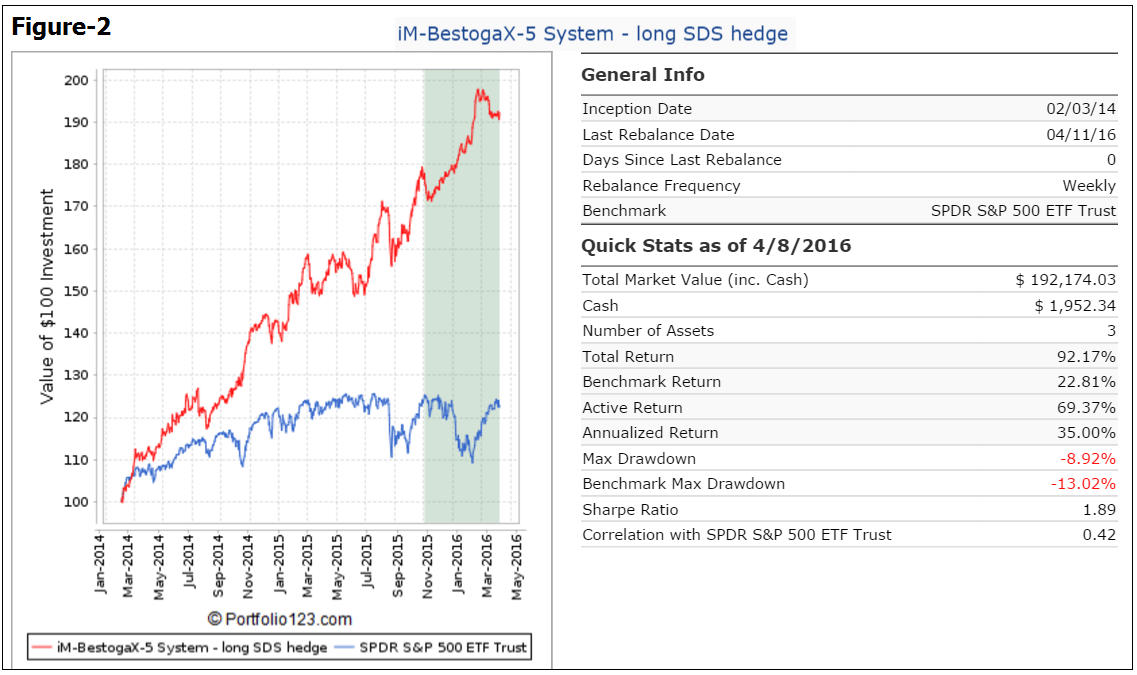
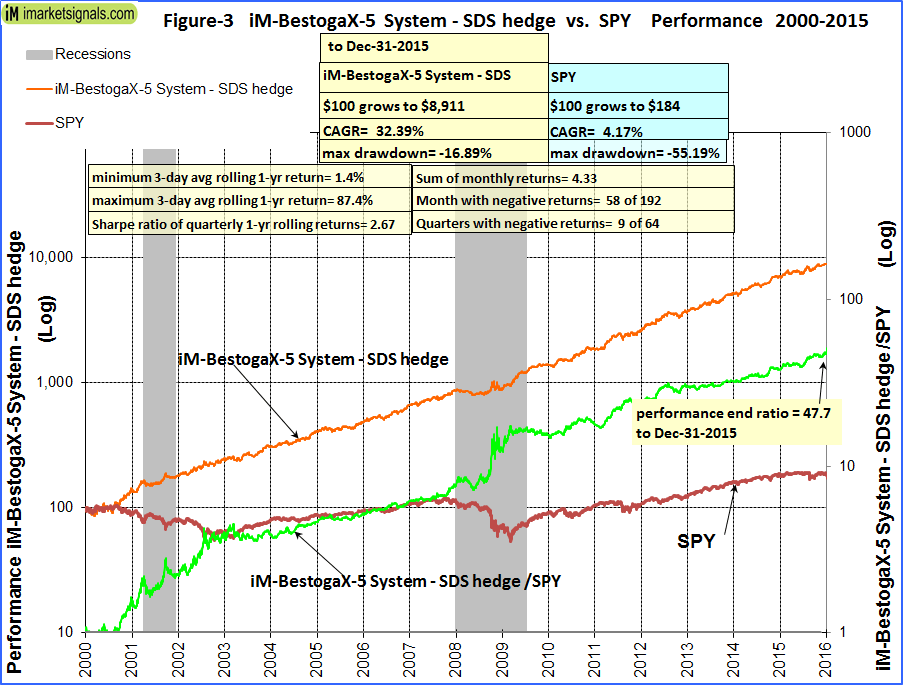
Figure-3 shows performance from Jan-2000 to Dec-2015. The green graph is the performance ratio of the BestogaX5-System to SPY. A rising slope of this graph indicates when it outperformed SPY; it produced about 48 times the value to December 2015 which one would have had from a buy-and-hold investment in SPY over the same period.
Annual Returns
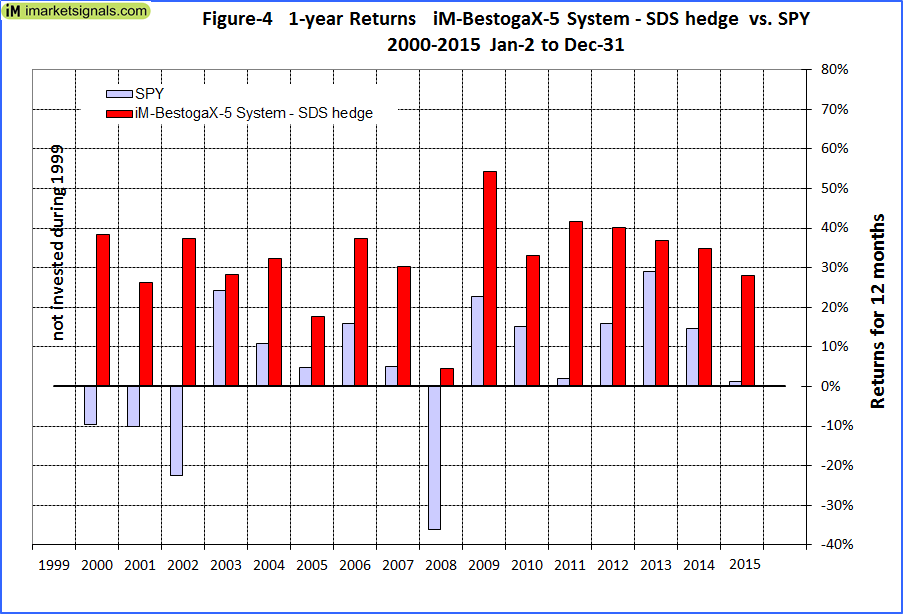
Calendar year performance shown in Figure-4 ranged from a maximum of 54% for 2009 to a minimum of 5% for 2008. There would never have been a loss over any calendar year. All annual returns exceeded those of the benchmark SPY.
Rolling 1-year returns
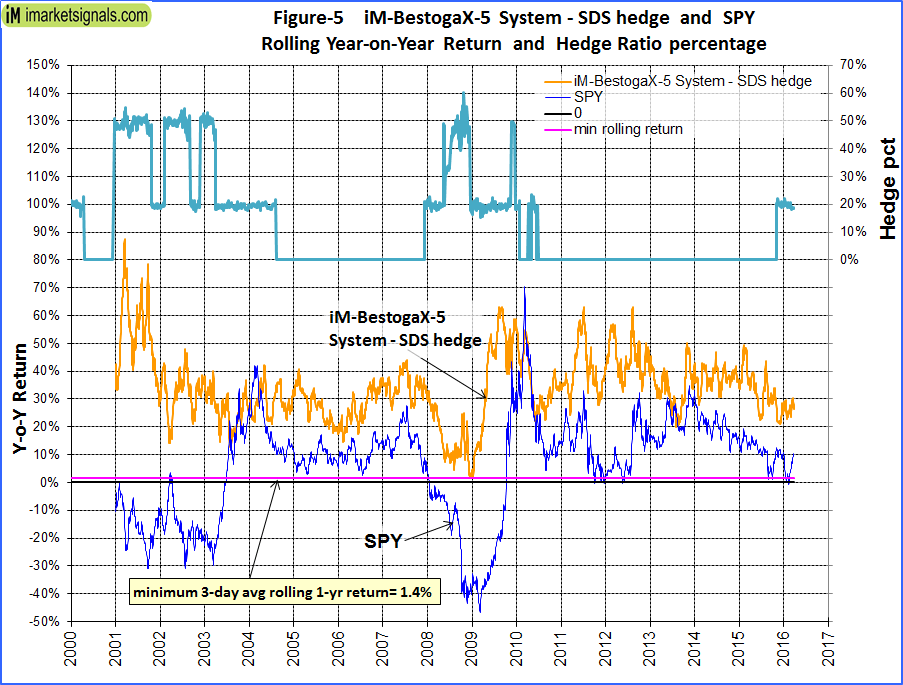
Figure 5 shows the rolling 1-year returns starting each trading day from 2000. The minimum return over 12 months would have been 1.4% and the maximum about 60%. Also shown is the hedge ratio which varied from about 20% to 50% of portfolio value when the model was hedged.
Distribution of Monthly Returns
Figure 6 shows the distribution of monthly returns. There were a total of 192 months in the period under consideration. The BestogaX5-System produced positive returns during 134 months and only 58 months had negative returns. SPY had 81 months of negative returns.
Also shown are the maximum drawdowns during each calendar year. The highest D/D of -16.9% occurred in the year 2000.

Following the Model
As the performance of the iM-BestogaX-5(SDS) System is very similar to the iM-BestogaX-5 System we will not publish detailed performance reports. The long hedging strategy can be followed using the table below, which shows the percentage allocation of capital invested in the BestogaX-models and SDS.
| Hedge | BestogaX-5 Model |
BestogaX-5 Stock Holdings |
Long SDS |
| 0% | Investor | 50% | 0% |
| Trader | 50% | 0% | |
| 20% | Investor | 30% | 20% |
| Trader | 50% | 0% | |
| 50% | Investor | 30% | 20% |
| Trader | 20% | 30% |
Disclaimer
All results are presented for informational and educational purposes only and shall not be construed as advice to invest in any assets. Backtesting results should be interpreted in light of differences between simulated performance and actual trading, and an understanding that past performance is no guarantee of future results. All Systems should make investment choices based upon their own analysis of the asset, its expected returns and risks, or consult a financial adviser. The designer of this model is not a registered investment adviser.
Hi, it seems like a 50% SDS hedge is too extreme. Since that is a 2x short fund, wouldn’t it essentially be 2:1 short to long? The other X-5 system stayed at 1:1 since it was still 100% long when the 50% SSO short was put in place.
What are the figures like for this one if the max hedge was 33% SDS with 66% stocks, which would keep it to 1:1 max?
Thanks though, this system looks fantastic.
You are correct. When both the Trader and the Investor models are hedged at the same time, then the combined long positions would have 50% of the equity allocated to it, and SDS would also have 50% of the equity allocated to it. Since SDS is -2x leveraged, it amounts to a 2:1 short to long ratio. One can see these allocation percentages in the table at the end of the model description.
When only the Investor is hedged (as is currently the case), then the combined long positions would have 80% of the equity allocated to it, and SDS would have 20% of the equity allocated to it. Since SDS is -2x leveraged, it amounts to a 0.5:1 short to long ratio.
Hedging the Trader with 40% SDS and the Investor with 25% SDS, would when the models are hedged at the same time, amount to a combined long positions of 67.5% of the equity, and SDS would have 32.5% of the equity allocated to it. Since SDS is -2x leveraged, it amounts to a 0.96:1.00 short to long ratio.
For this combo: from Jan-2000 to Apr-2016
Annualized Return 31.10%
Max Drawdown -17.16%
Sharpe Ratio 1.80
Oh another quick question- have you guys experimented with the BESTOGA3 system using this same hedging method during risky periods? I know those holdings did well during the last two recessions with no hedge, but would reducing positions and buying SDS during the same periods the X-5 system would have, show improved returns or lessened max DD in any way?
Using a combo of (Bestoga3 hedged 40%SDS) and (Bestoga3 hedged 25%SDS) for a max short:long ratio of 1:1, then return does improve, and Sharpe is significantly higher indicating less risk for the hedged model:
For this combo: from Jan-2000 to Apr-2016
Annualized Return 26.96%
Max Drawdown -16.05%
Sharpe Ratio 1.43
For Bestoga3 no hedge: from Jan-2000 to Apr-2016
Annualized Return 24.81%
Max Drawdown -17.20%
Sharpe Ratio 1.29
Georg,
Are you planning to implement the hedged system for Bestoga3?
Thanks,
RV
Example for the long hedging strategy. The first table below shows the signals for the iM-BestogaX-5 System; each slot represent 10% of the long portfolio totaling 100% and the short hedge is shown in the last column with the percentage shown being of the total long value. The first three rows of the second table are the signals for the iM-BestogaX-5(SDS) System; the final row, shown here as an example, lists the percentage for each stock, including the hedge. All position total 100%.
Stocks that are held by both component models are listed first. In the System these are held each at 20% nominal weight, the others each at 10% .
Short
20%
SSO
6% each CMG, DPZ, PCLN
10% each DPS, EAT, PM
20% SDS
18%
30%
20%
Can you use SDS and get similar results as the short-SSO method by allocating the funds invested in this strategy between the holdings and SDS using the ratio of each to the total? For example if the 20% hedge is on, we now have 100% holdings and 20% hedge for a total of 120%. So the holdings would get 20/120 or 83% of the funds and SDS would get 17%. Same process for 30% or 50% hedge.
William, your reasoning is correct. However, for backtesting we are constraint by fixed 5% hedge increments provided by portfolio123.com.
Correction… holdings would get 100/120 for the 83%.
Clearly you understood what I meant. Thanks.
George,
Very interested in your comment above about hedging Bestoga3. I want to be clear about when to hedge and by how much. When BestogaX-5 is in 20% hedge mode then you would hedge Bestoga3 at 25% SDS for a short:long ratio 0.67:1. When BestogaX-5 is in 50% hedge mode then you would hedge Bestoga3 at 40% SDS for a short:long ratio 1.33:1? I don’t understand where you got short:long ratio 1:1.
I like this system very much (BestogaX-5-SDS).
Please can you retested with Composite Market Timer.
Thanks
Gogo