
  |
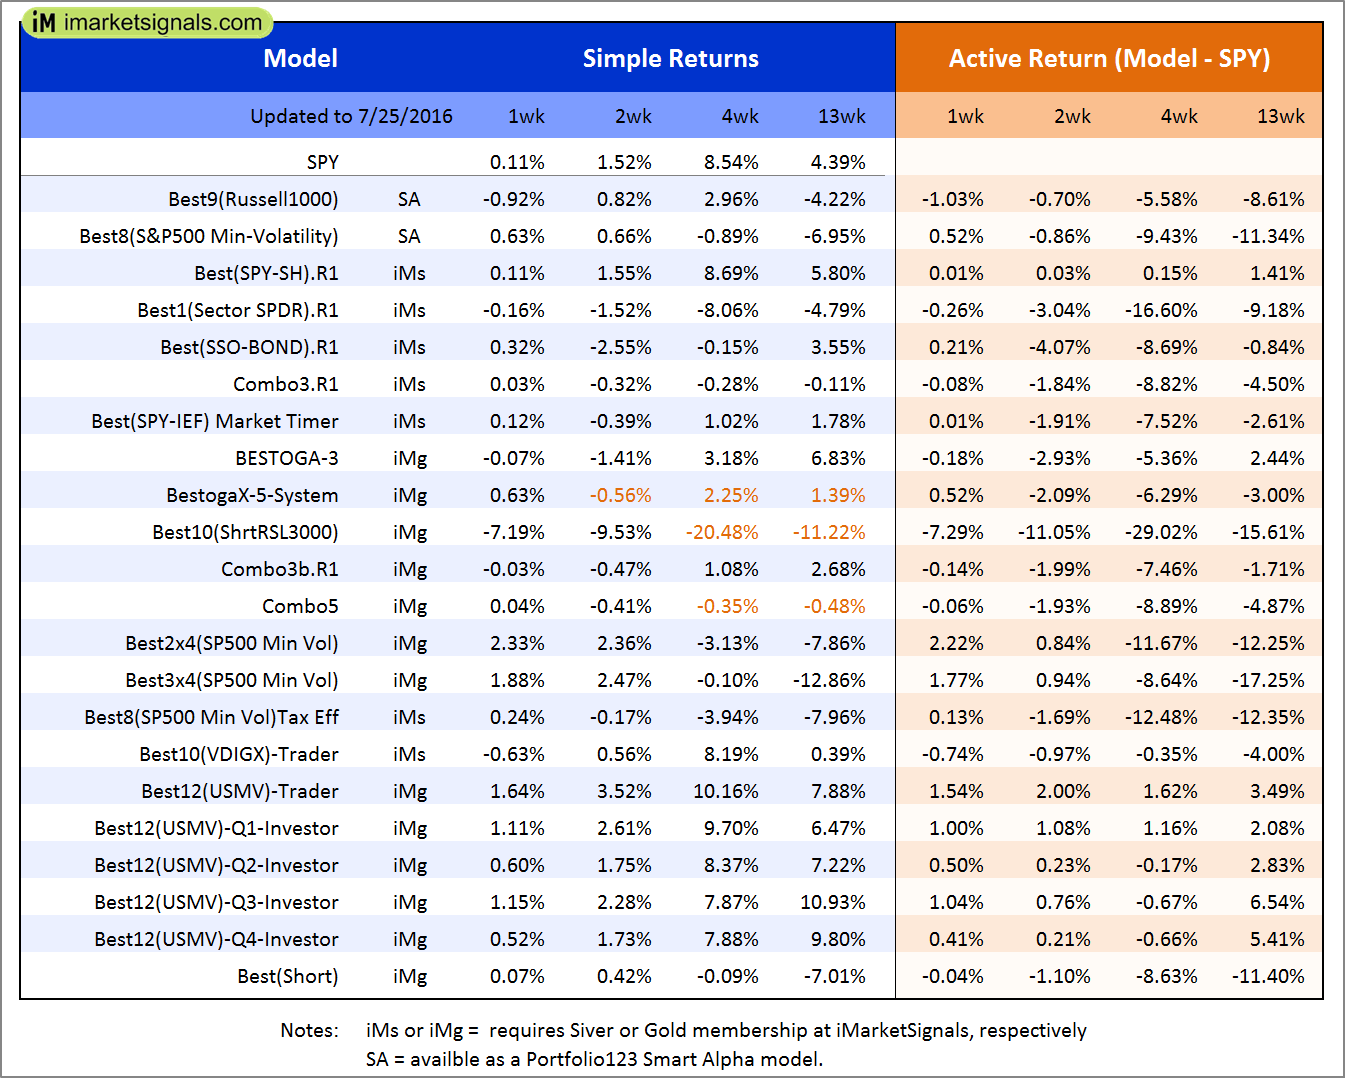
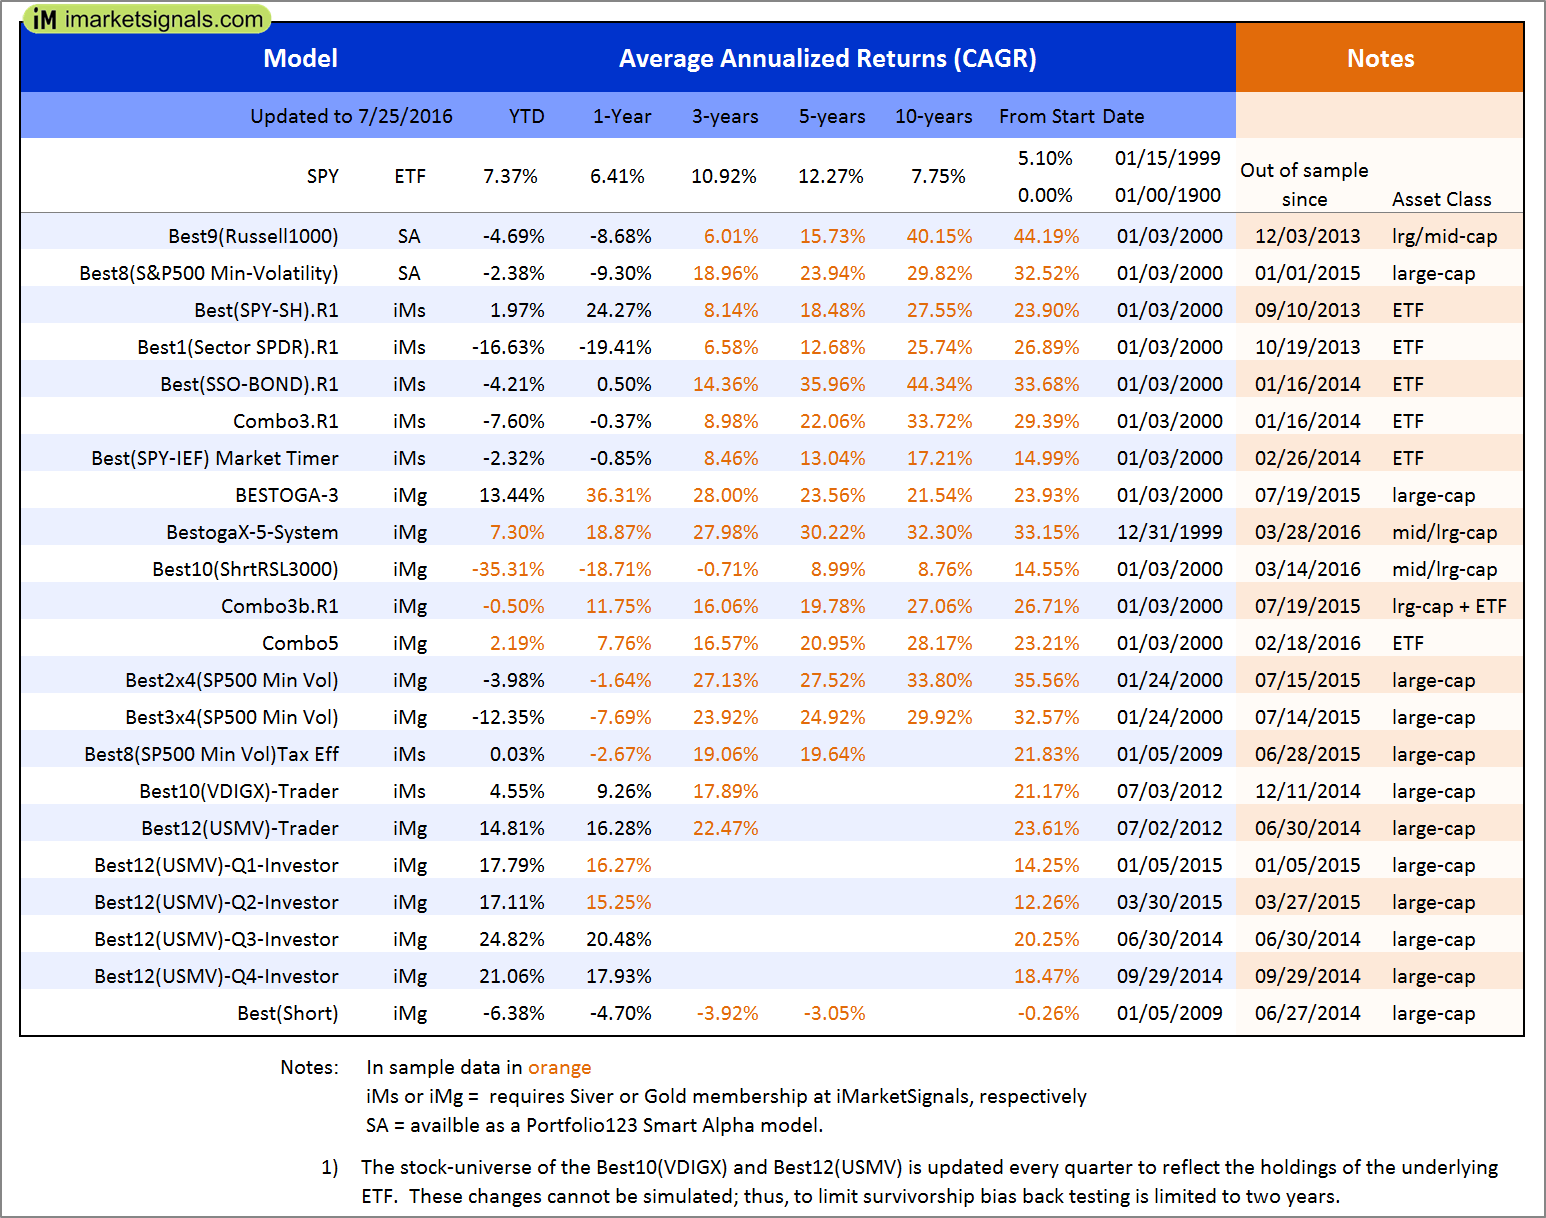
Out of sample performance summary of our models for the past 1, 2, 4 and 13 week periods. The active active return indicates how the models over- or underperformed the benchmark ETF SPY. Also the YTD, and the 1-, 3-, 5- and 10-year annualized returns are shown in the second table |
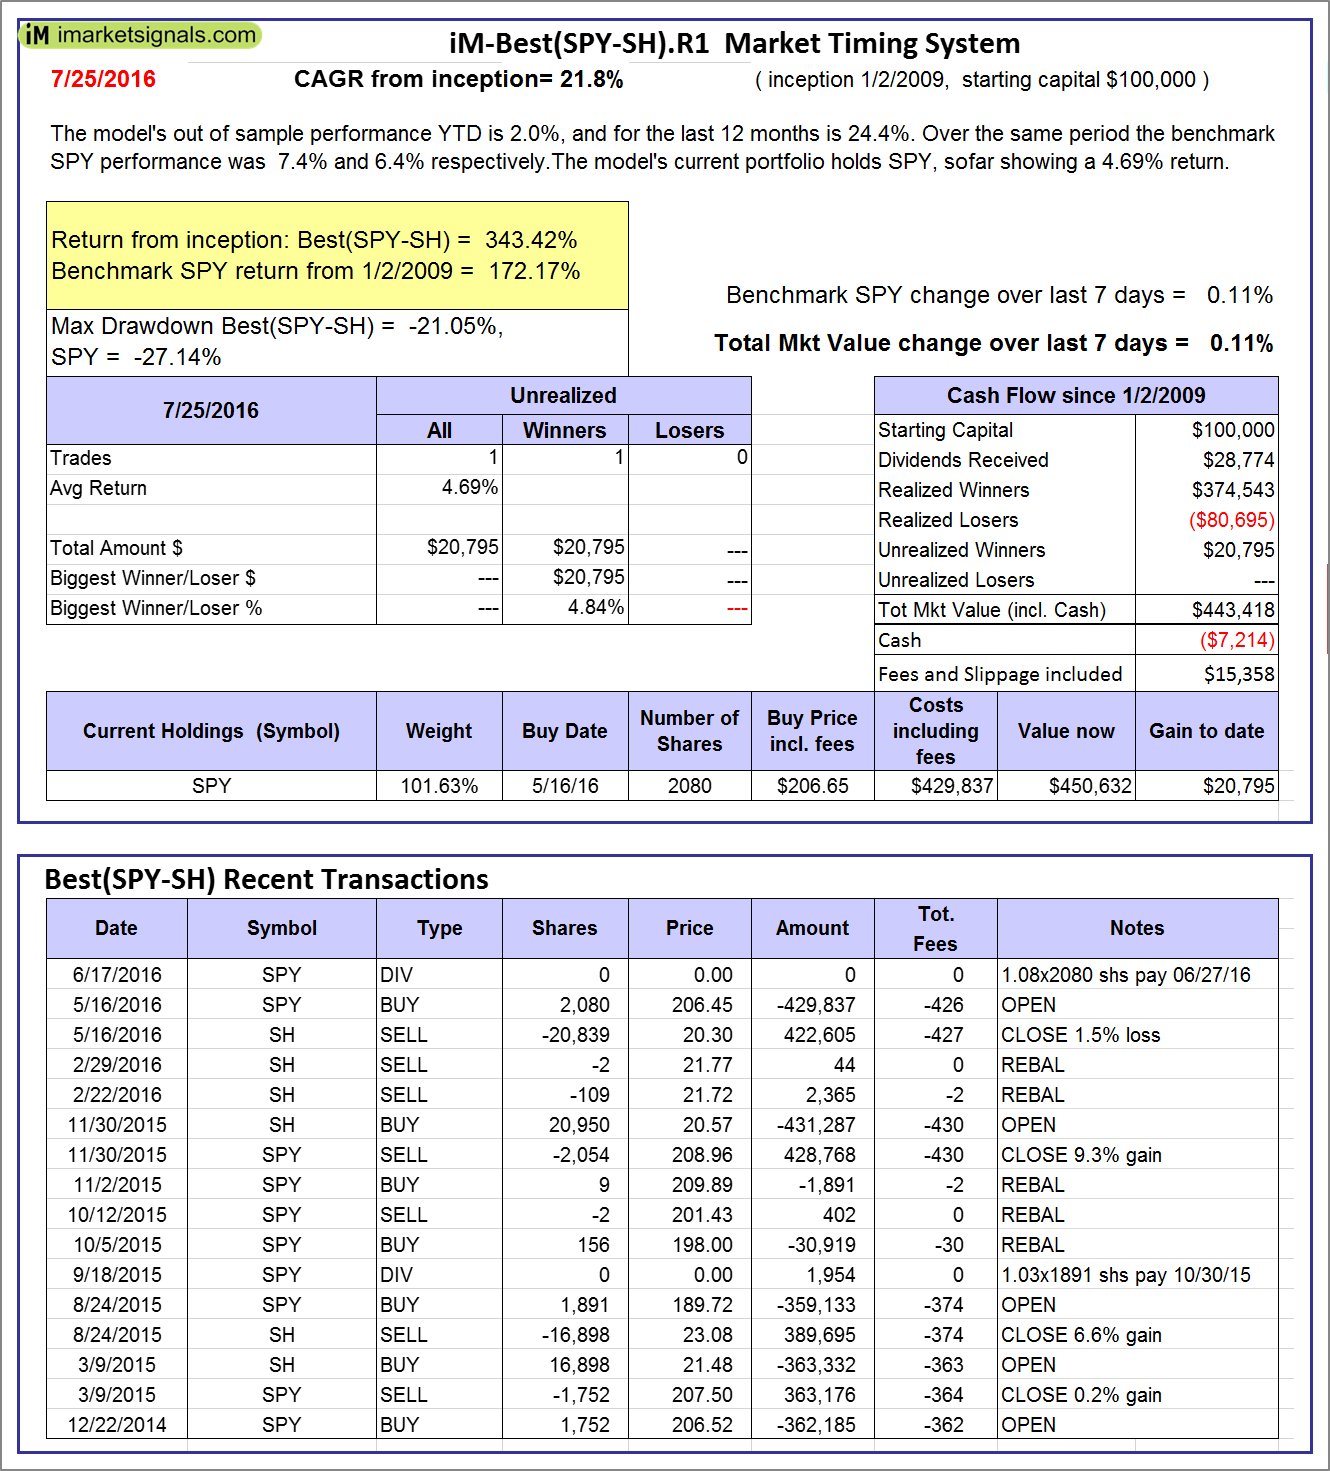 |
iM-Best(SPY-SH).R1: The model’s out of sample performance YTD is 2.0%, and for the last 12 months is 24.4%. Over the same period the benchmark SPY performance was 7.4% and 6.4% respectively. Over the previous week the market value of Best(SPY-SH) gained 0.11% at a time when SPY gained 0.11%. A starting capital of $100,000 at inception on 1/2/2009 would have grown to $443,418 which includes -$7,214 cash and excludes $15,358 spent on fees and slippage. |
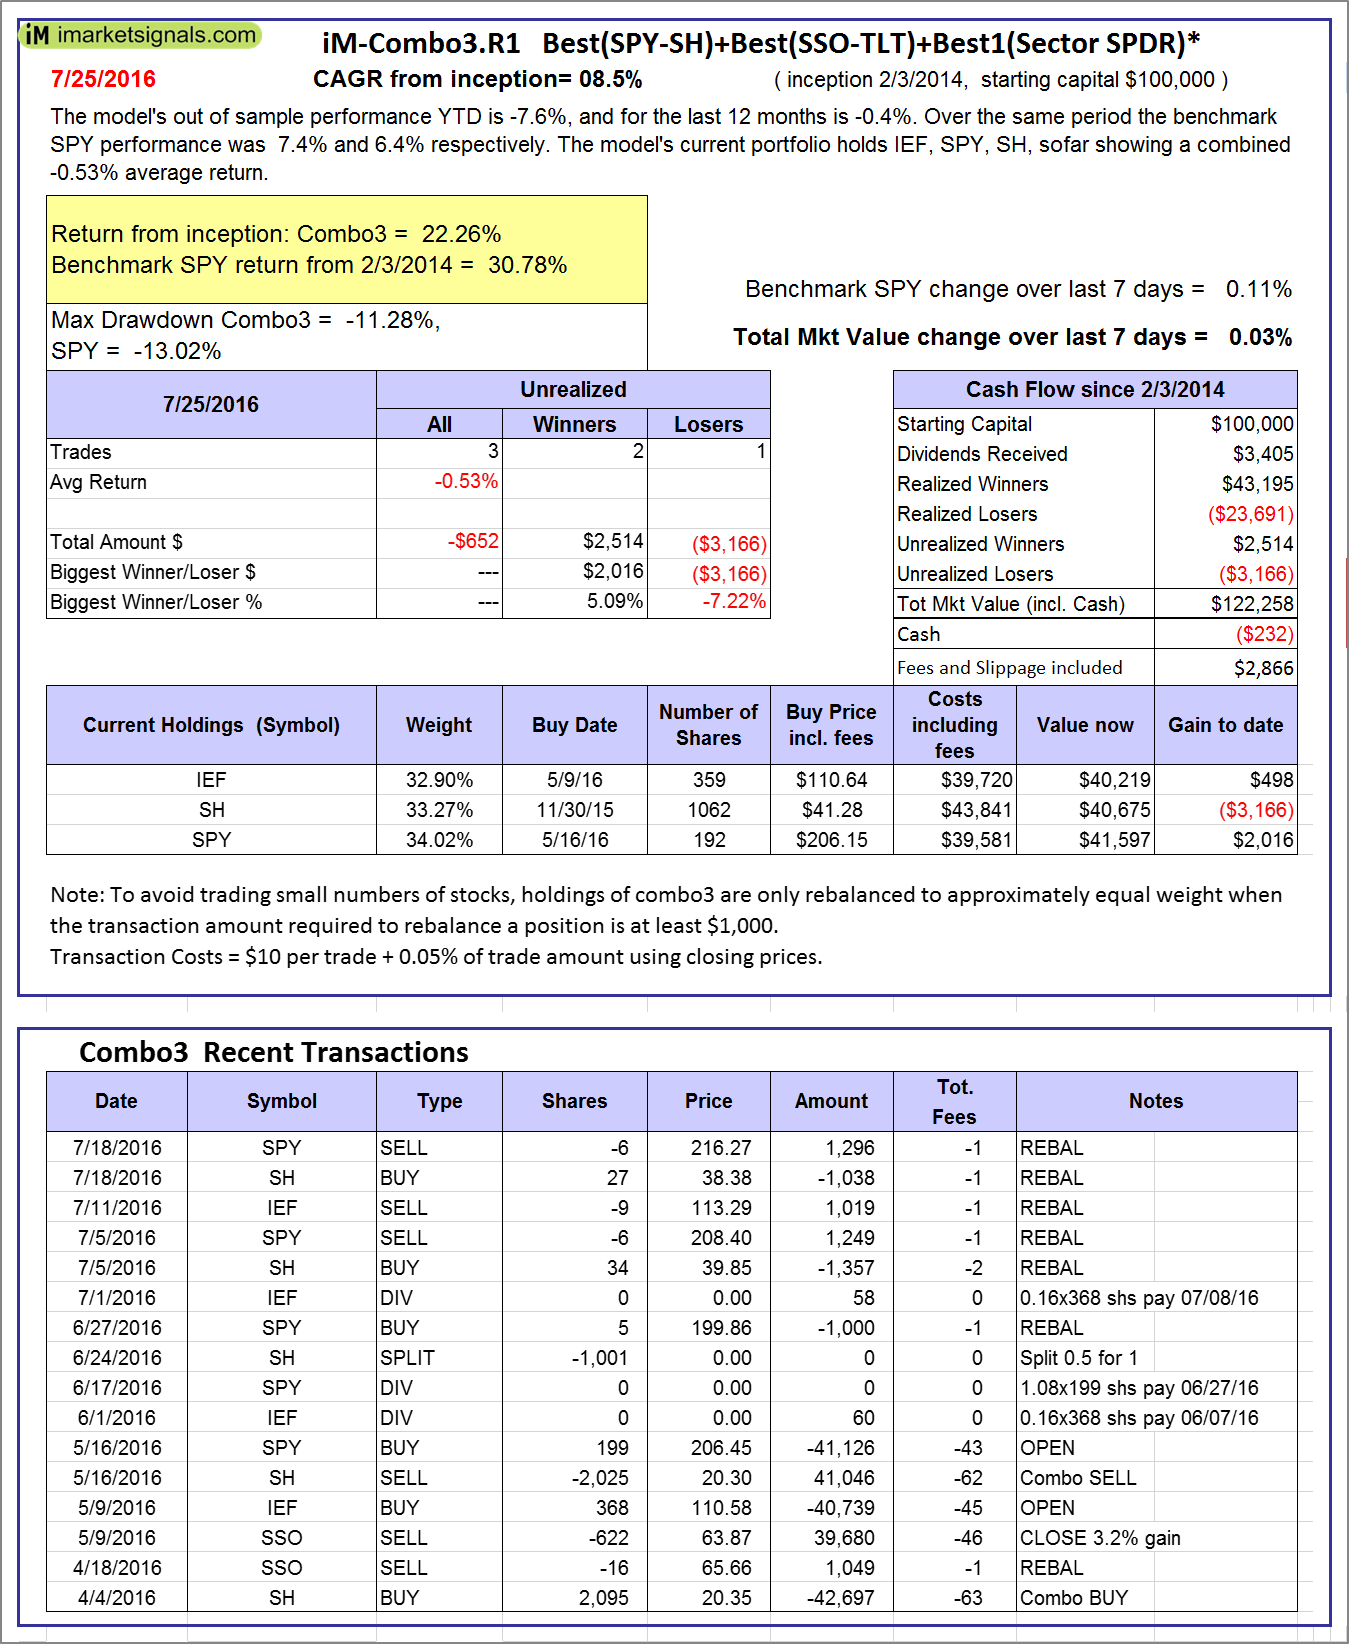 |
iM-Combo3.R1: The model’s out of sample performance YTD is -7.6%, and for the last 12 months is -0.4%. Over the same period the benchmark SPY performance was 7.4% and 6.4% respectively. Over the previous week the market value of iM-Combo3.R1 gained 0.03% at a time when SPY gained 0.11%. A starting capital of $100,000 at inception on 2/3/2014 would have grown to $122,258 which includes -$232 cash and excludes $2,866 spent on fees and slippage. |
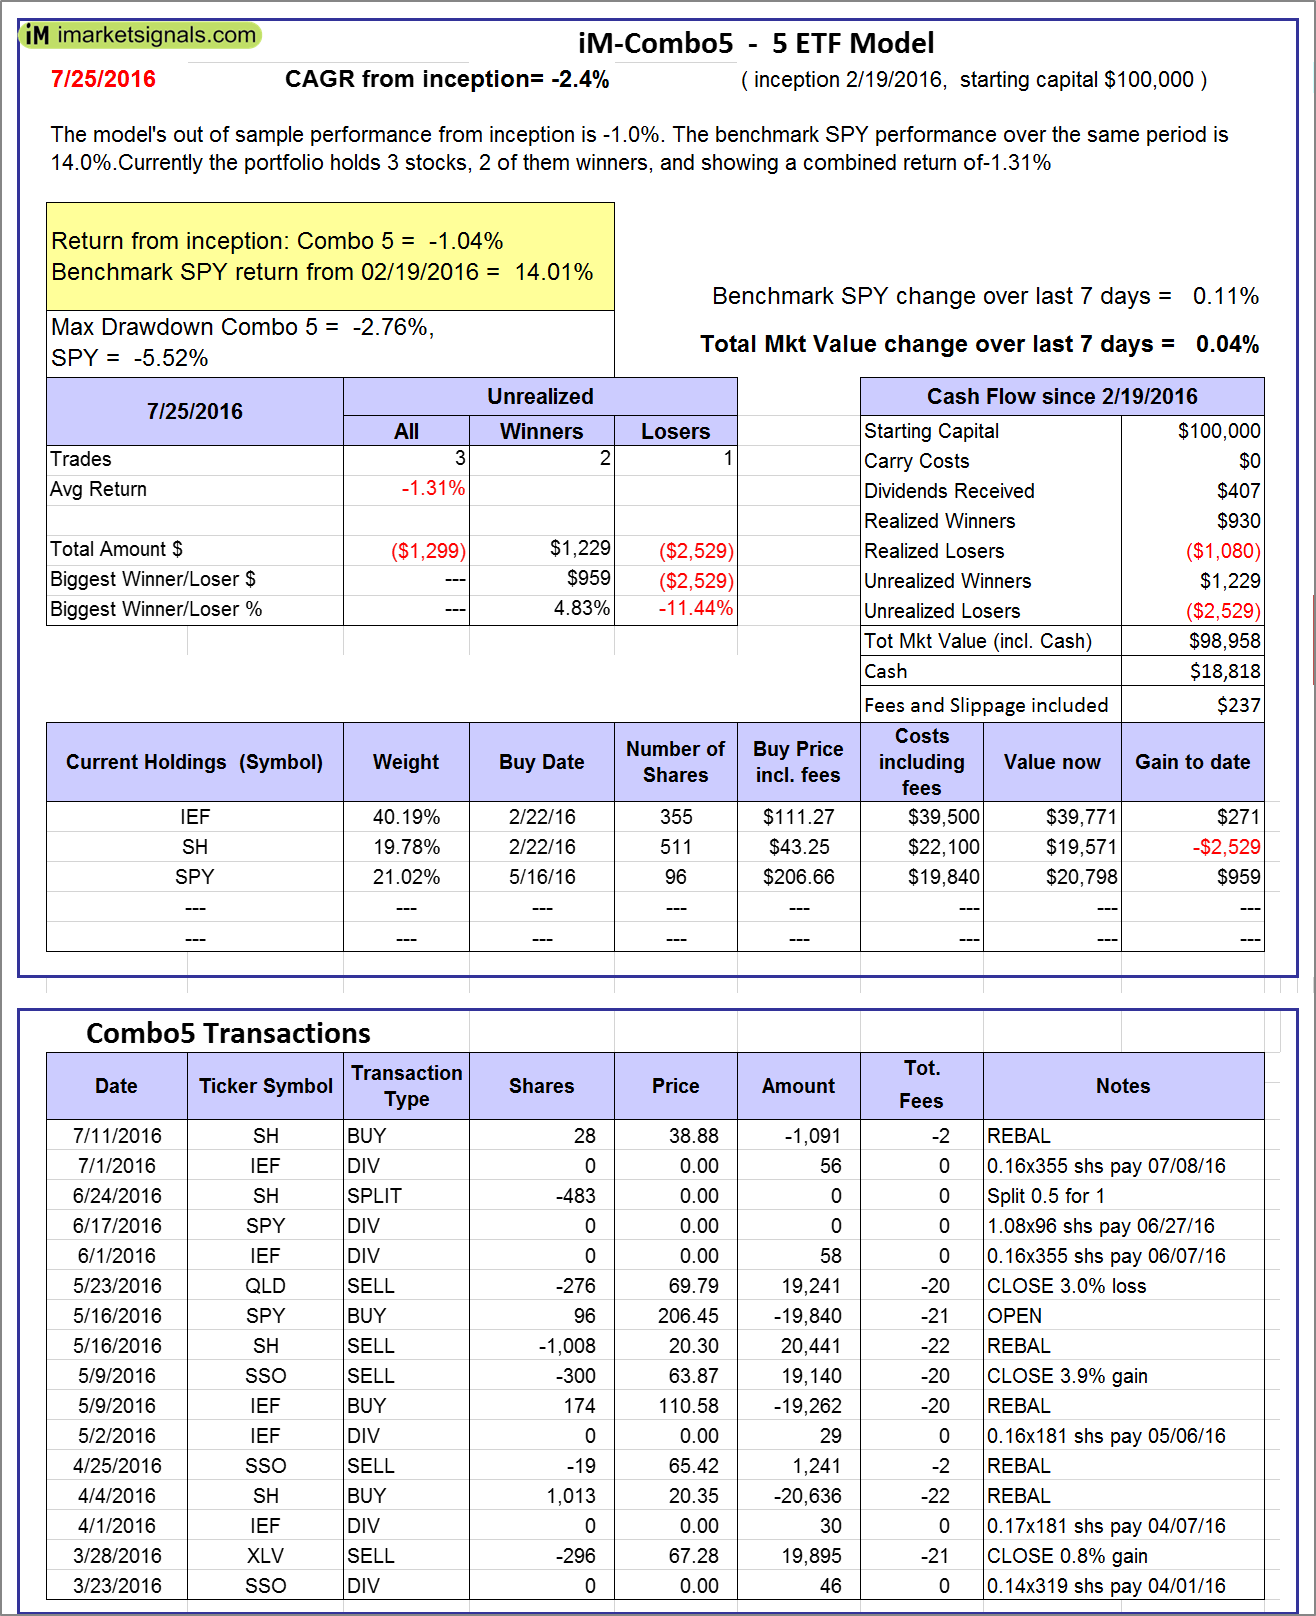 |
iM-Combo5: The model’s out of sample performance from inception is -1.0%. The benchmark SPY performance over the same period is 14.0%. Over the previous week the market value of iM-Combo5 gained 0.04% at a time when SPY gained 0.11%. A starting capital of $100,000 at inception on 2/22/2016 would have grown to $98,958 which includes $18,818 cash and excludes $237 spent on fees and slippage. |
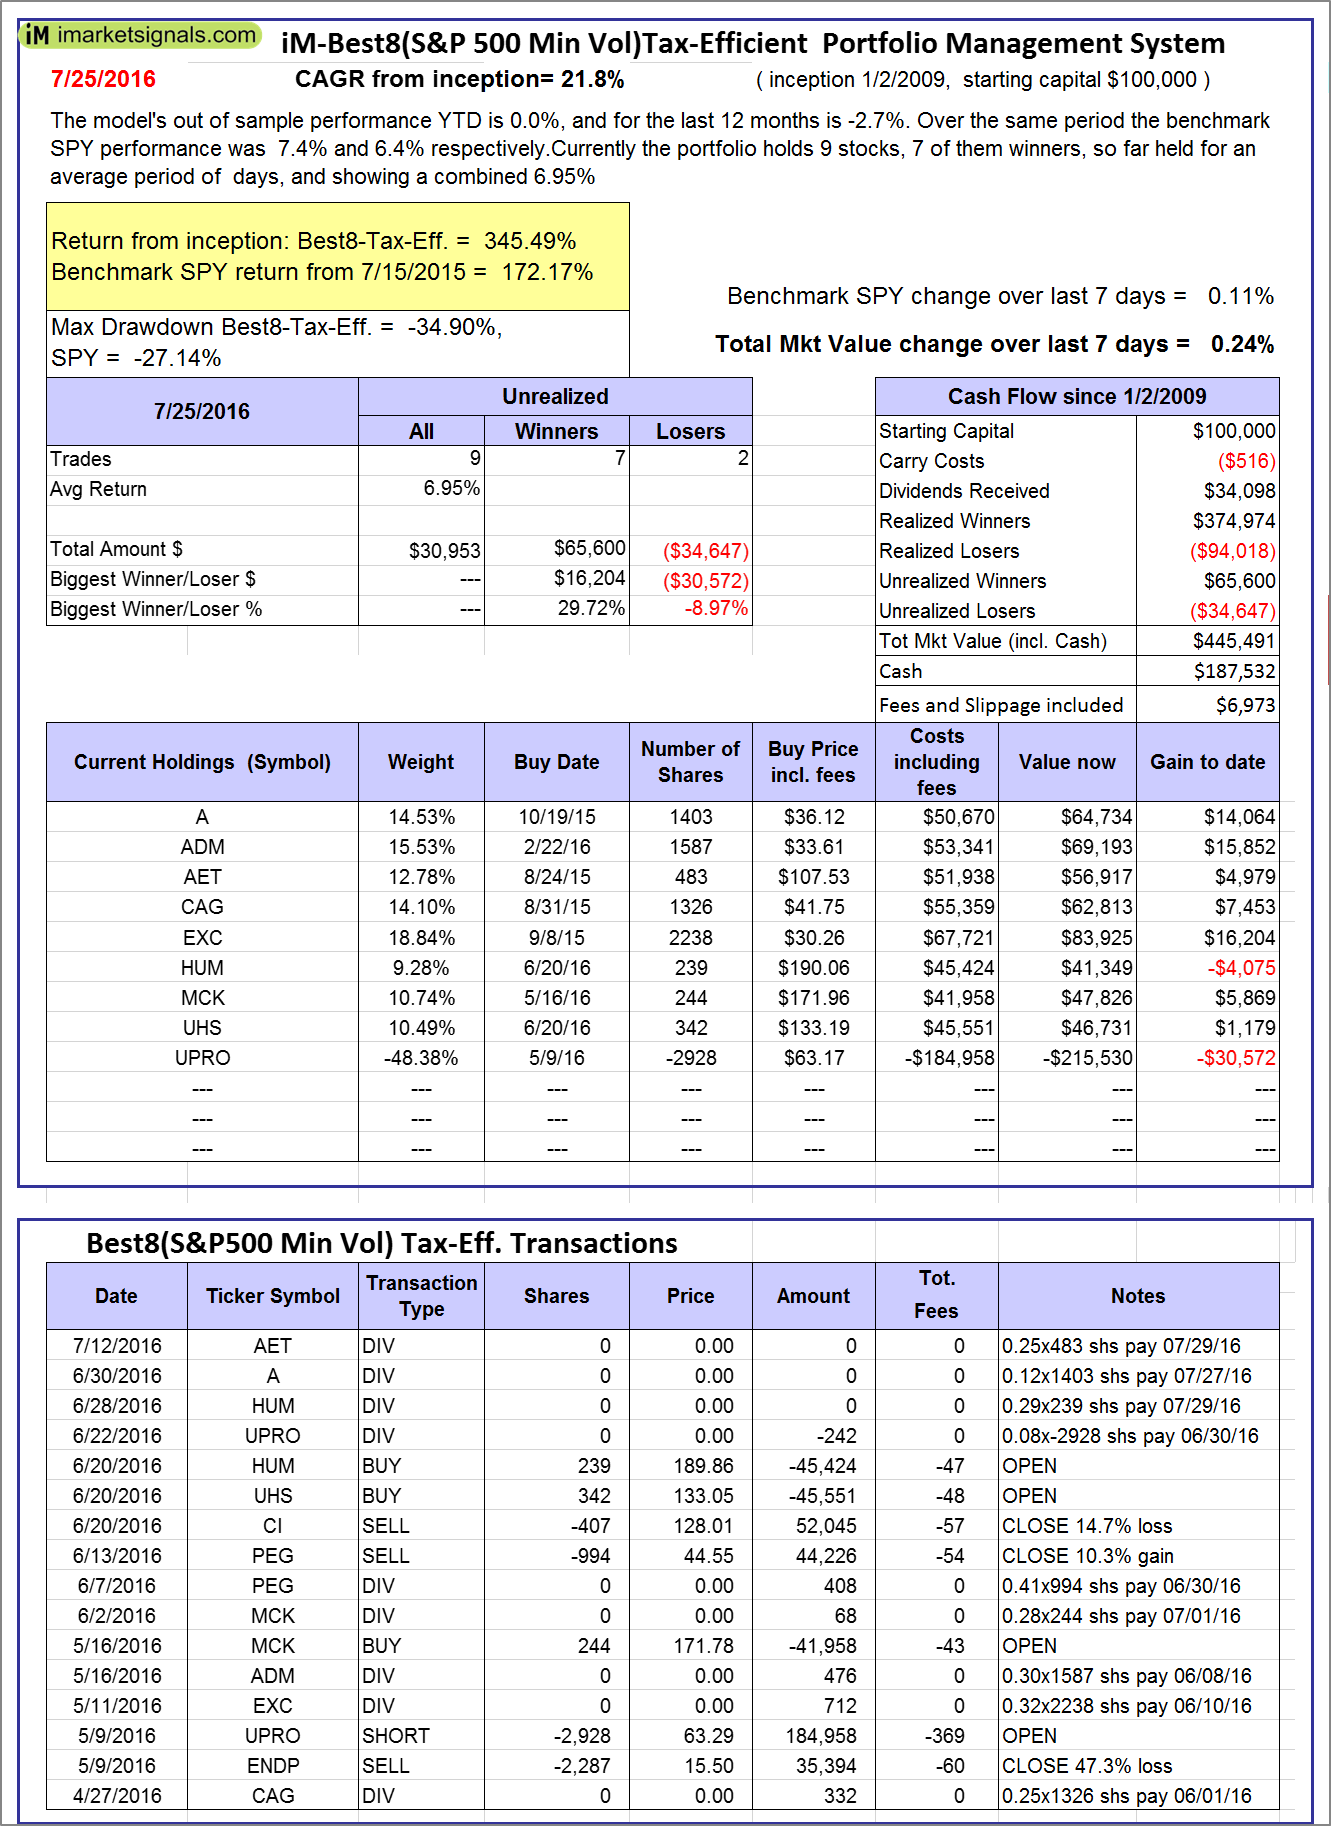 |
The iM-Best8(S&P500 Min Vol)Tax-Efficient The model’s out of sample performance YTD is 0.0%, and for the last 12 months is -2.7%. Over the same period the benchmark SPY performance was 7.4% and 6.4% respectively. Over the previous week the market value of iM-Best8(S&P 500)Tax-Eff. gained 0.24% at a time when SPY gained 0.11%. A starting capital of $100,000 at inception on 1/2/2009 would have grown to $445,491 which includes $187,532 cash and excludes $6,973 spent on fees and slippage. |
  |
iM-Best10(VDIGX)-Trader: The model’s out of sample performance YTD is 4.5%, and for the last 12 months is 9.3%. Over the same period the benchmark SPY performance was 7.4% and 6.4% respectively. Since inception, on 7/1/2014, the model gained 31.80% while the benchmark SPY gained 15.26% and the ETF VDIGX gained 18.56% over the same period. Over the previous week the market value of iM-Best10(VDIGX) gained -0.63% at a time when SPY gained 0.11%. A starting capital of $100,000 at inception on 7/1/2014 would have grown to $131,802 which includes $144 cash and excludes $1,180 spent on fees and slippage. |
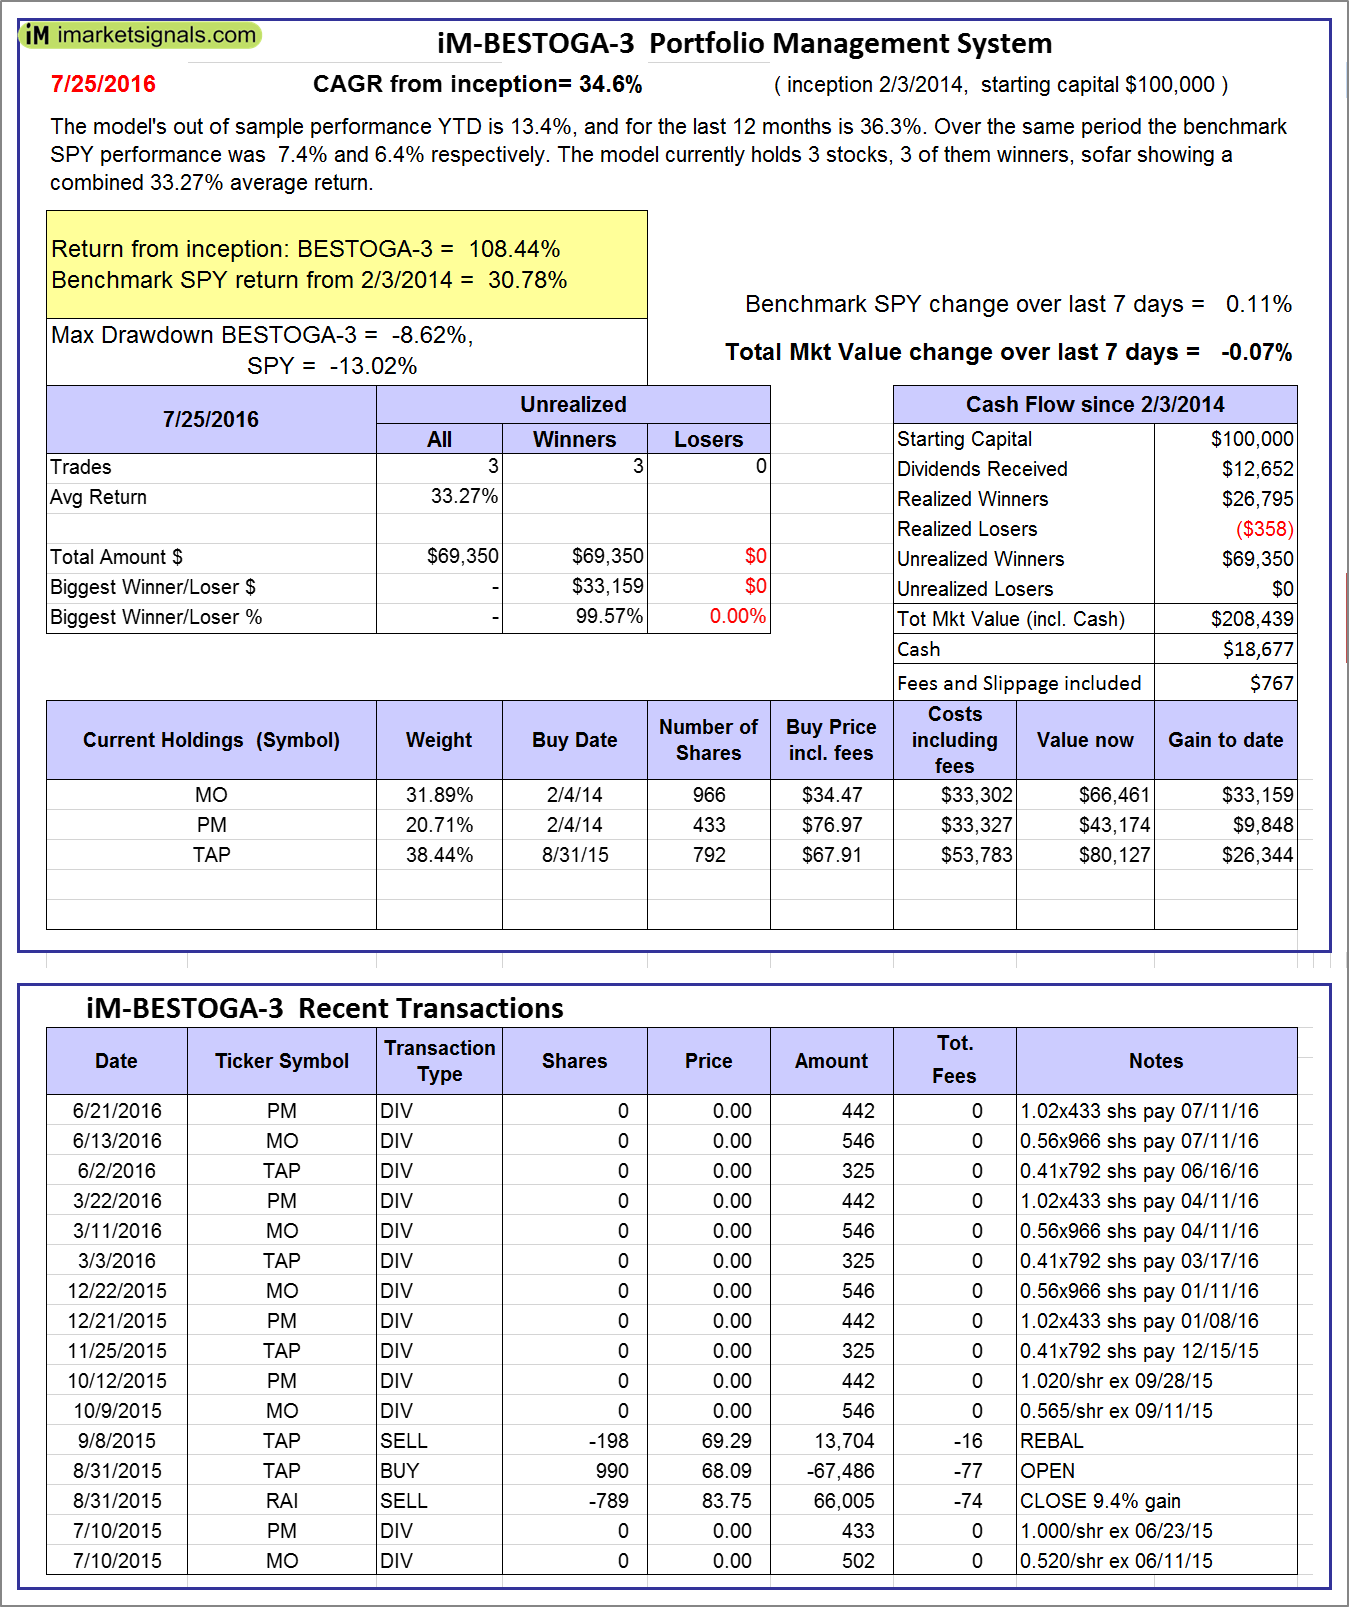 |
iM-BESTOGA-3: The model’s out of sample performance YTD is 13.4%, and for the last 12 months is 36.3%. Over the same period the benchmark SPY performance was 7.4% and 6.4% respectively. Over the previous week the market value of iM-BESTOGA-3 gained -0.07% at a time when SPY gained 0.11%. A starting capital of $100,000 at inception on 2/3/2014 would have grown to $208,439 which includes $18,677 cash and excludes $767 spent on fees and slippage. |
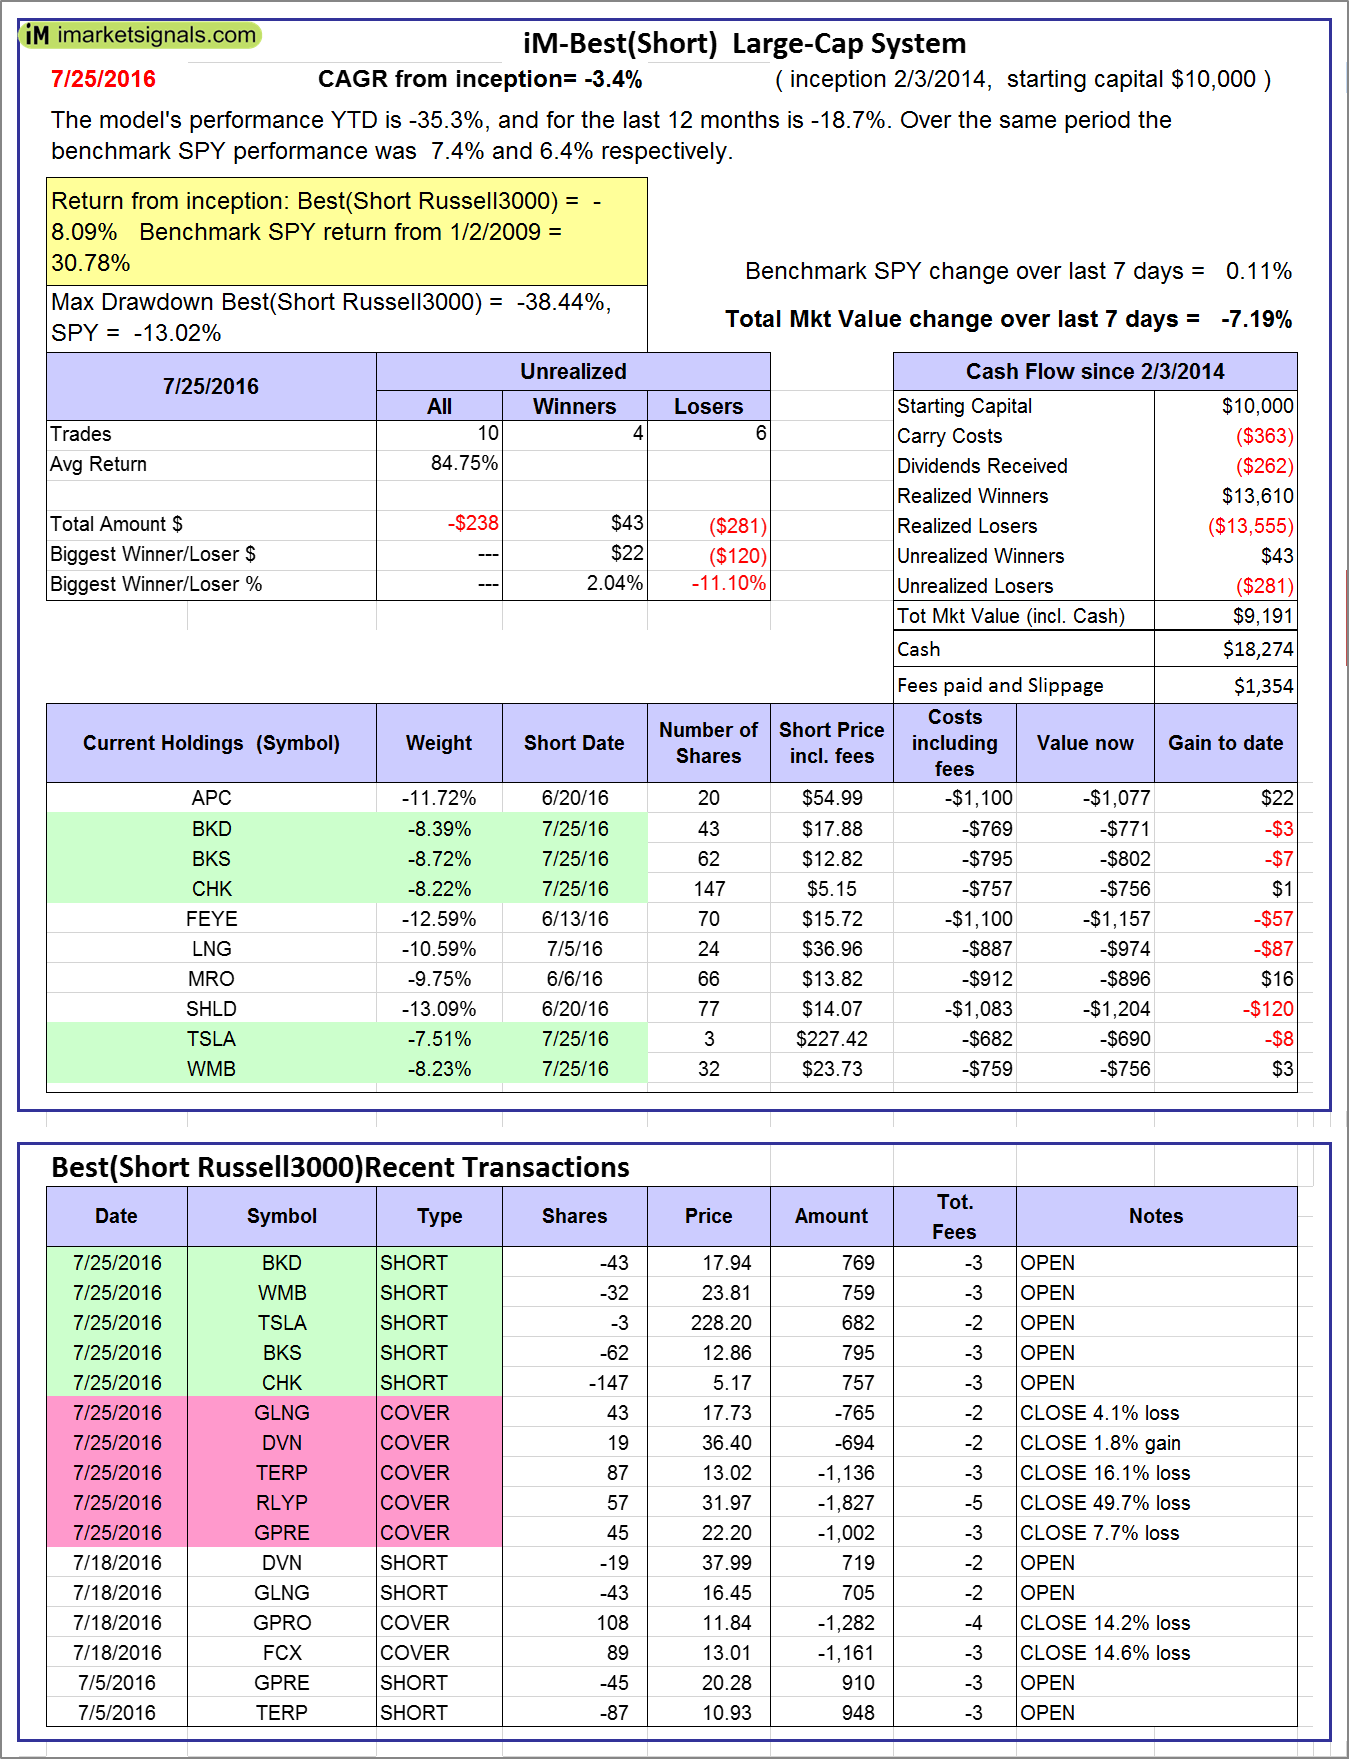 |
iM-Best10(Short Russell3000): The model’s performance YTD is -35.3%, and for the last 12 months is -18.7%. Over the same period the benchmark SPY performance was 7.4% and 6.4% respectively. Over the previous week the market value of iM-Best10(Short Russell3000) gained -7.19% at a time when SPY gained 0.11%. Over the period 2/3/2014 to 7/25/2016 the starting capital of $100,000 would have grown to $9,191 which includes $18,274 cash and excludes $1,354 spent on fees and slippage. |
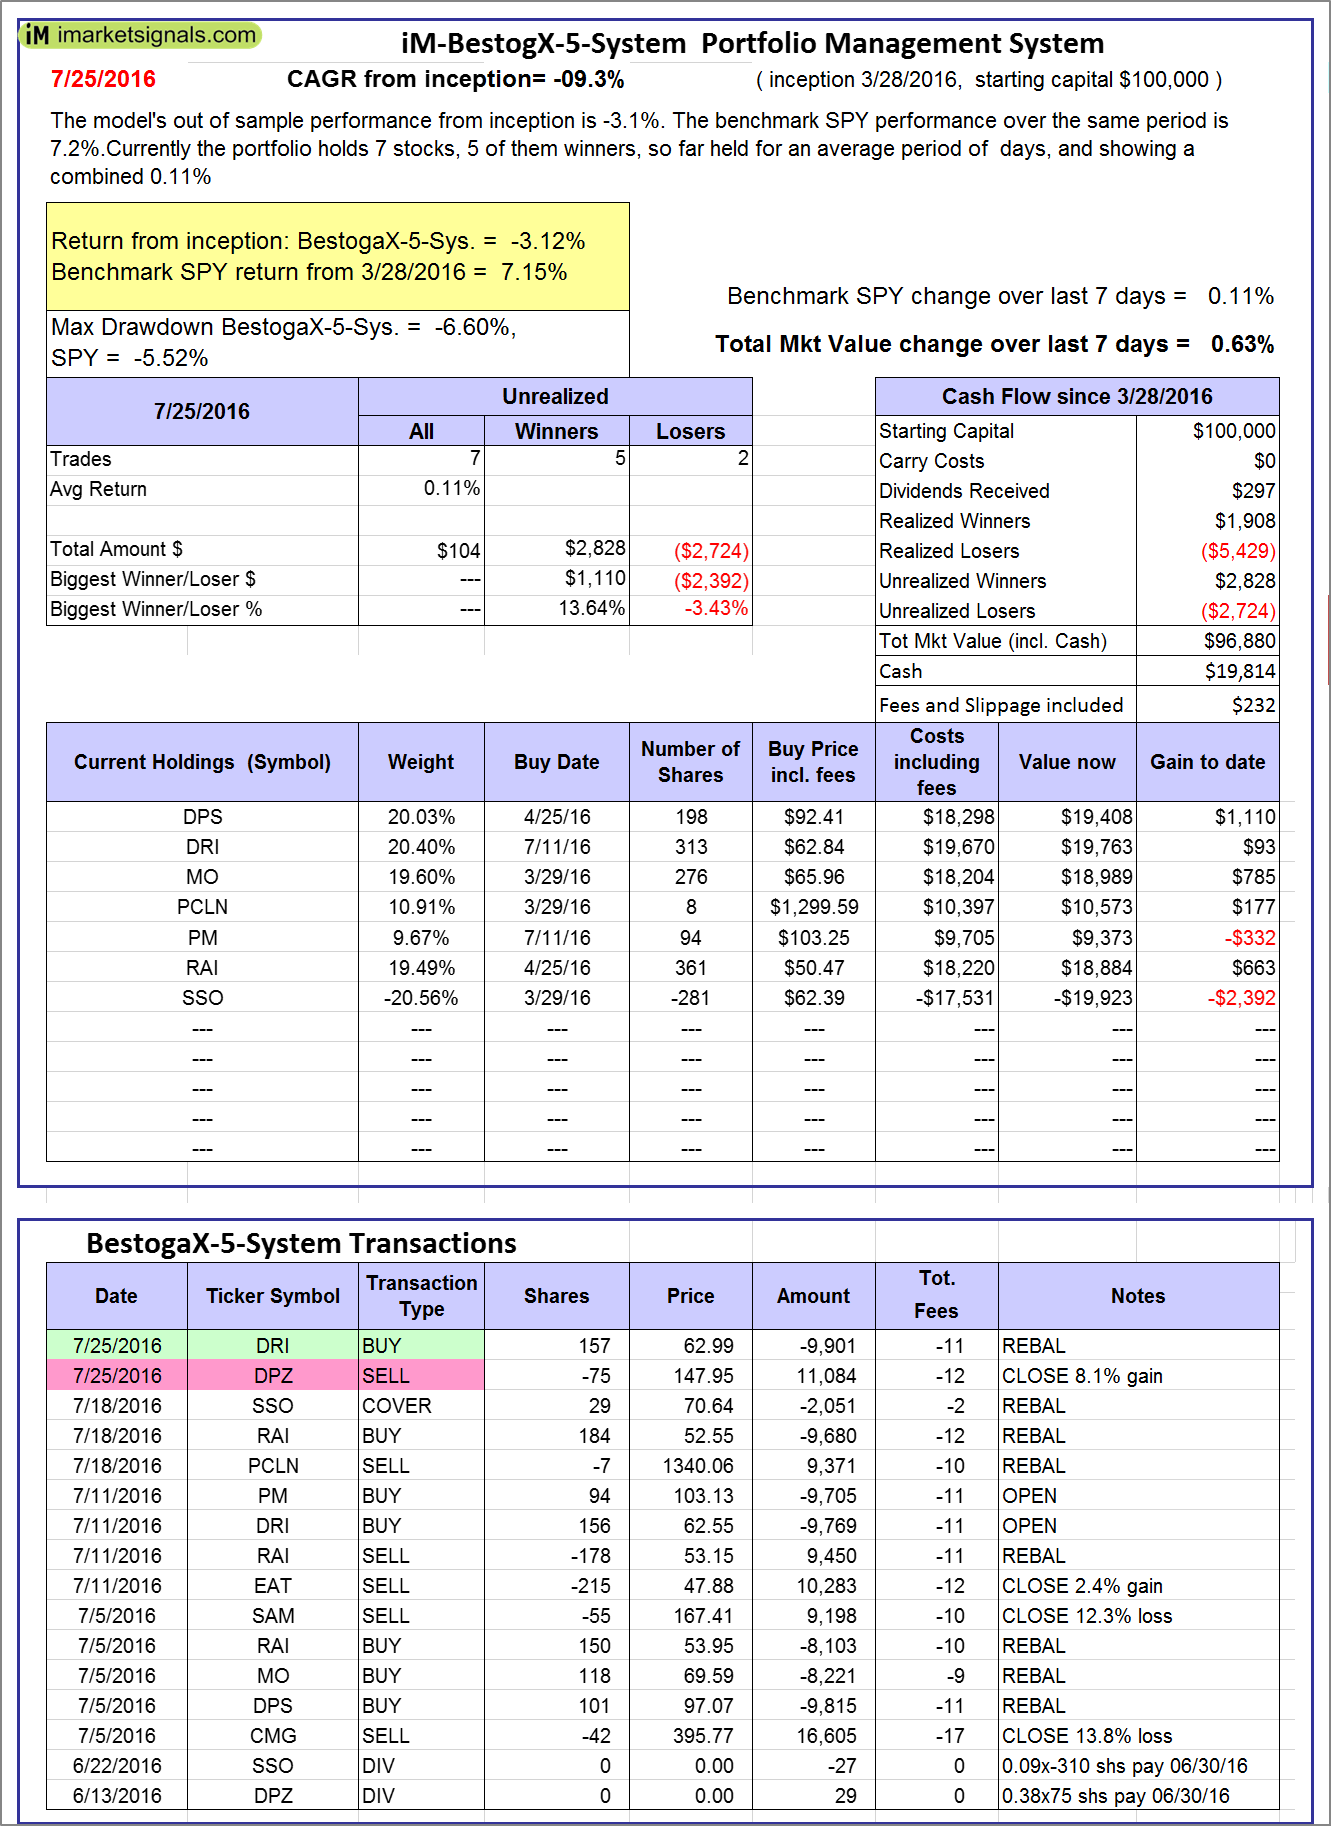 |
iM-BestogaX5-System: The model’s out of sample performance from inception is -3.1%. The benchmark SPY performance over the same period is 7.2%. Over the previous week the market value of iM-Best8(S&P 500)Tax-Eff. gained 0.63% at a time when SPY gained 0.11%. A starting capital of $100,000 at inception on 1/2/2009 would have grown to $96,880 which includes $19,814 cash and excludes $232 spent on fees and slippage. |
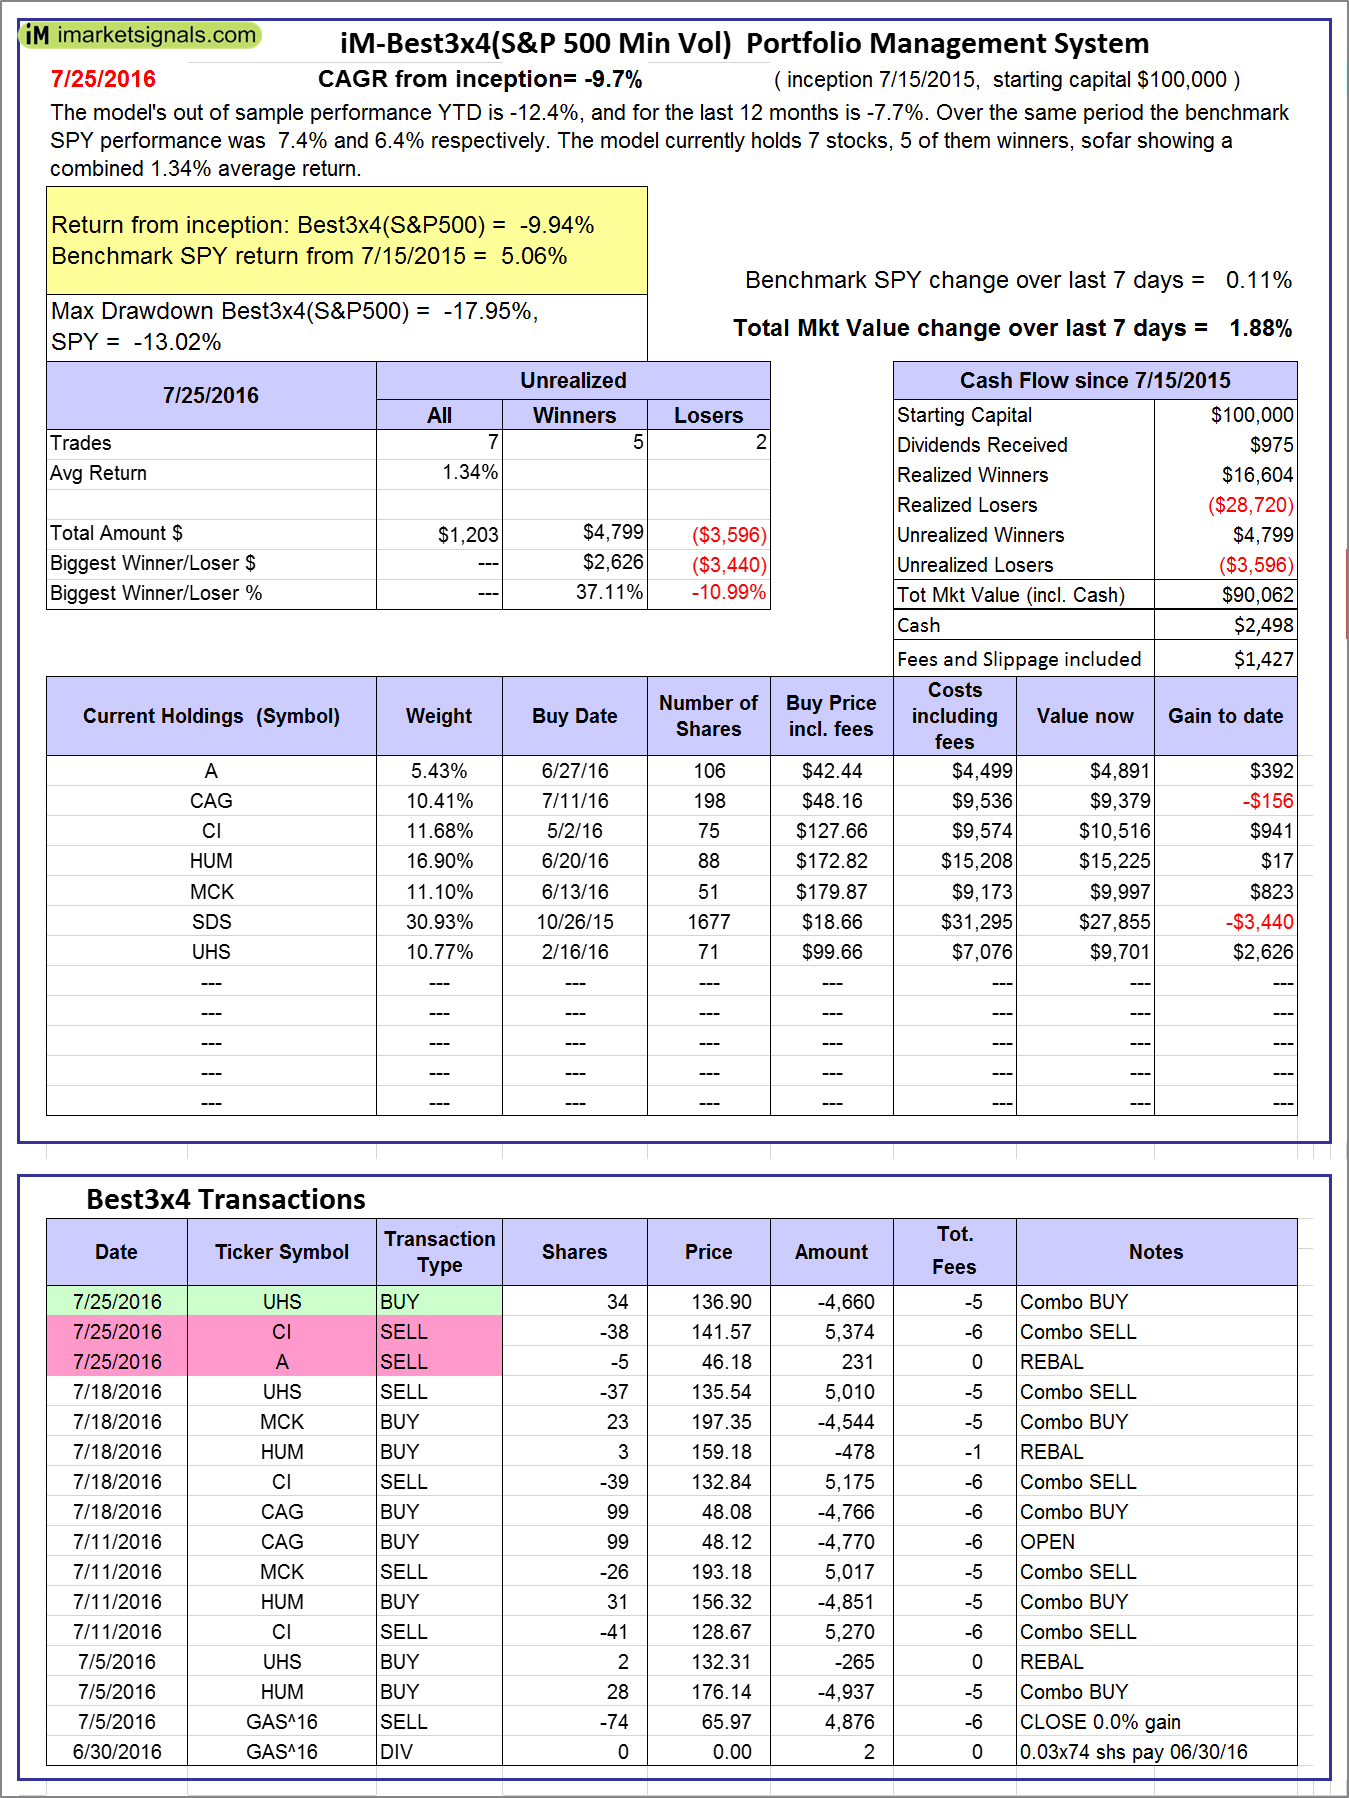 |
iM-Best3x4(S&P 500 Min Vol): The model’s out of sample performance YTD is -12.4%, and for the last 12 months is -7.7%. Over the same period the benchmark SPY performance was 7.4% and 6.4% respectively. Over the previous week the market value of iM-Best3x4 gained 1.88% at a time when SPY gained 0.11%. A starting capital of $100,000 at inception on 7/15/2015 would have grown to $90,062 which includes $2,498 cash and excludes $1,427 spent on fees and slippage. |
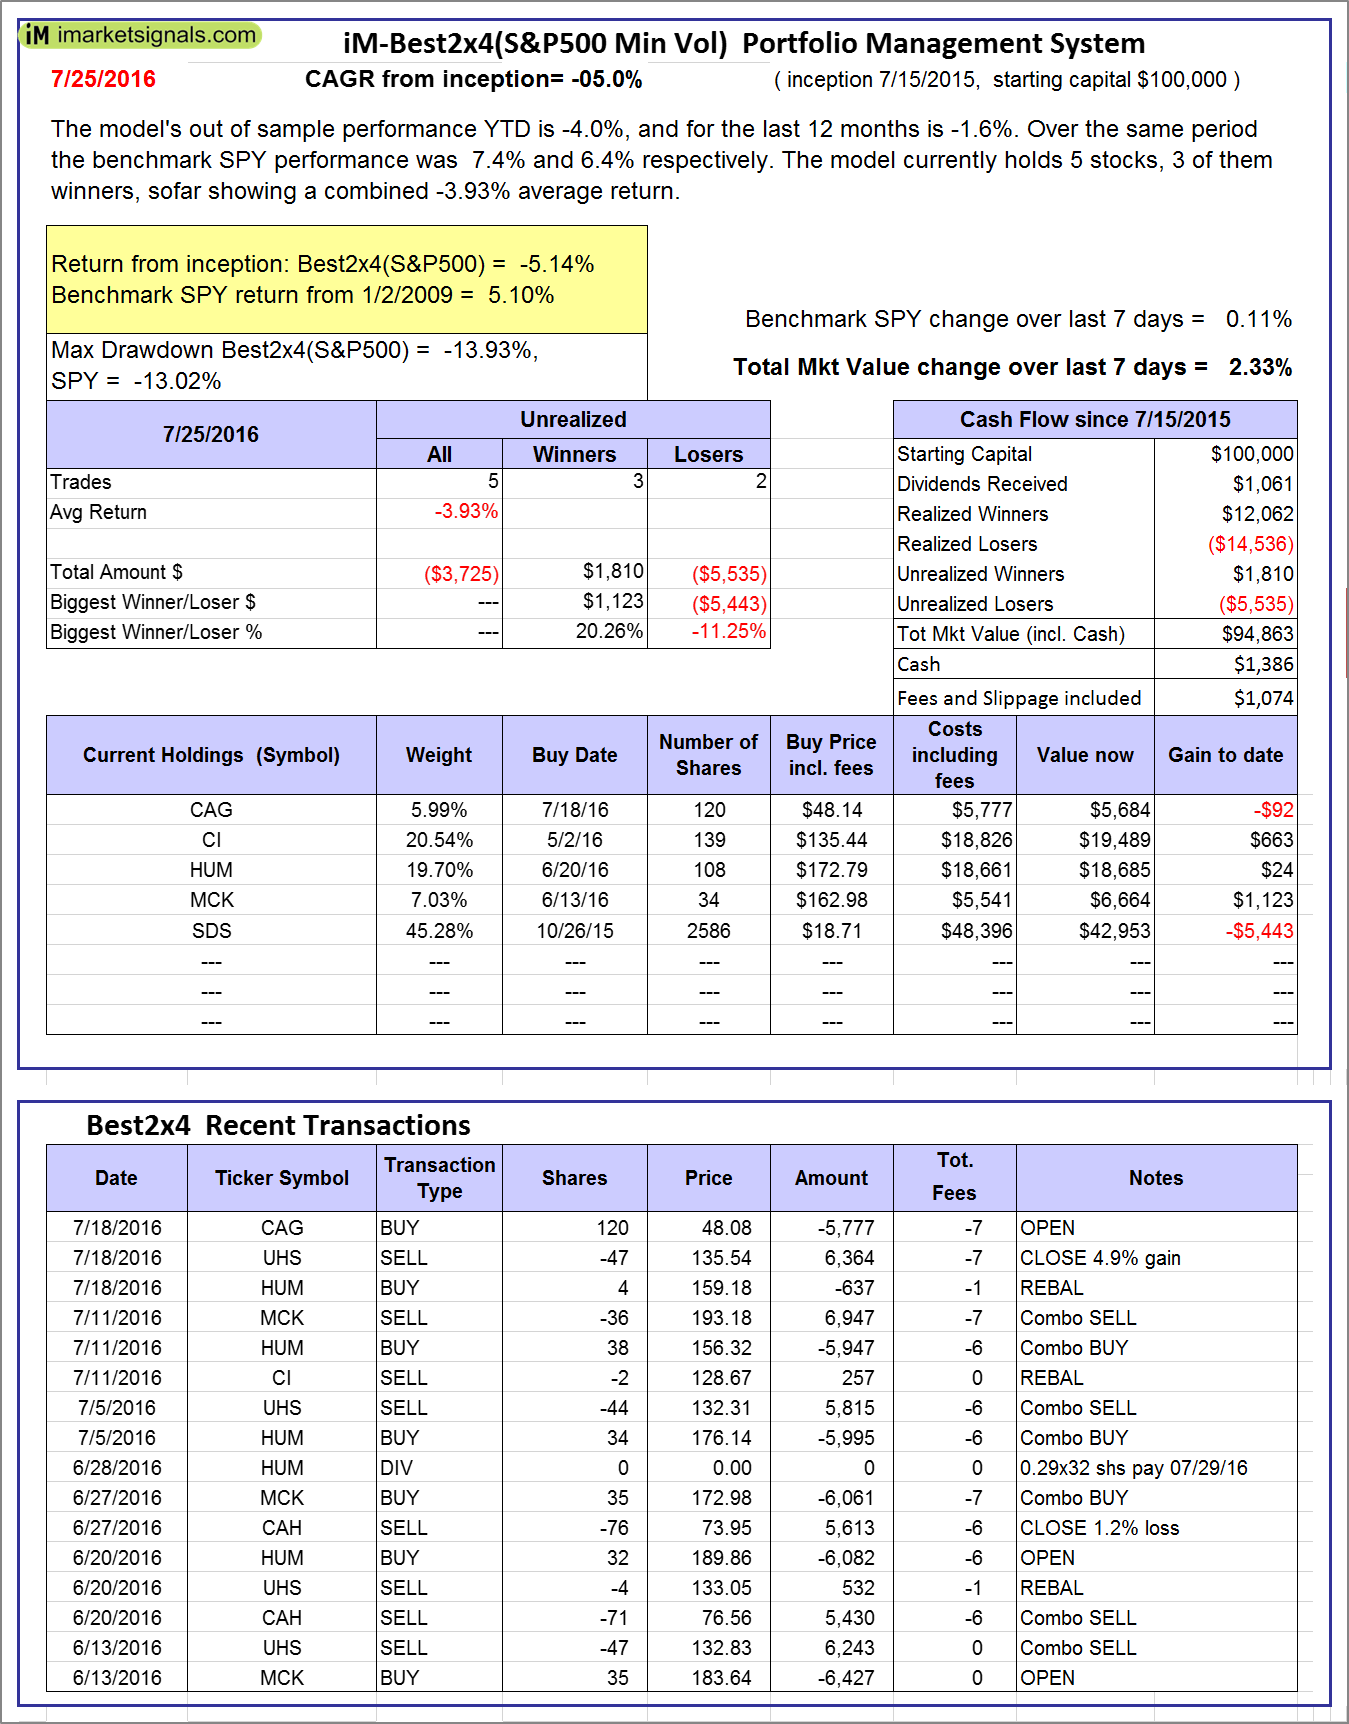 |
iM-Best2x4(S&P 500 Min Vol): The model’s out of sample performance YTD is -4.0%, and for the last 12 months is -1.6%. Over the same period the benchmark SPY performance was 7.4% and 6.4% respectively. Over the previous week the market value of iM-Best2x4 gained 2.33% at a time when SPY gained 0.11%. A starting capital of $100,000 at inception on 7/16/2015 would have grown to $94,863 which includes $1,386 cash and excludes $1,074 spent on fees and slippage. |
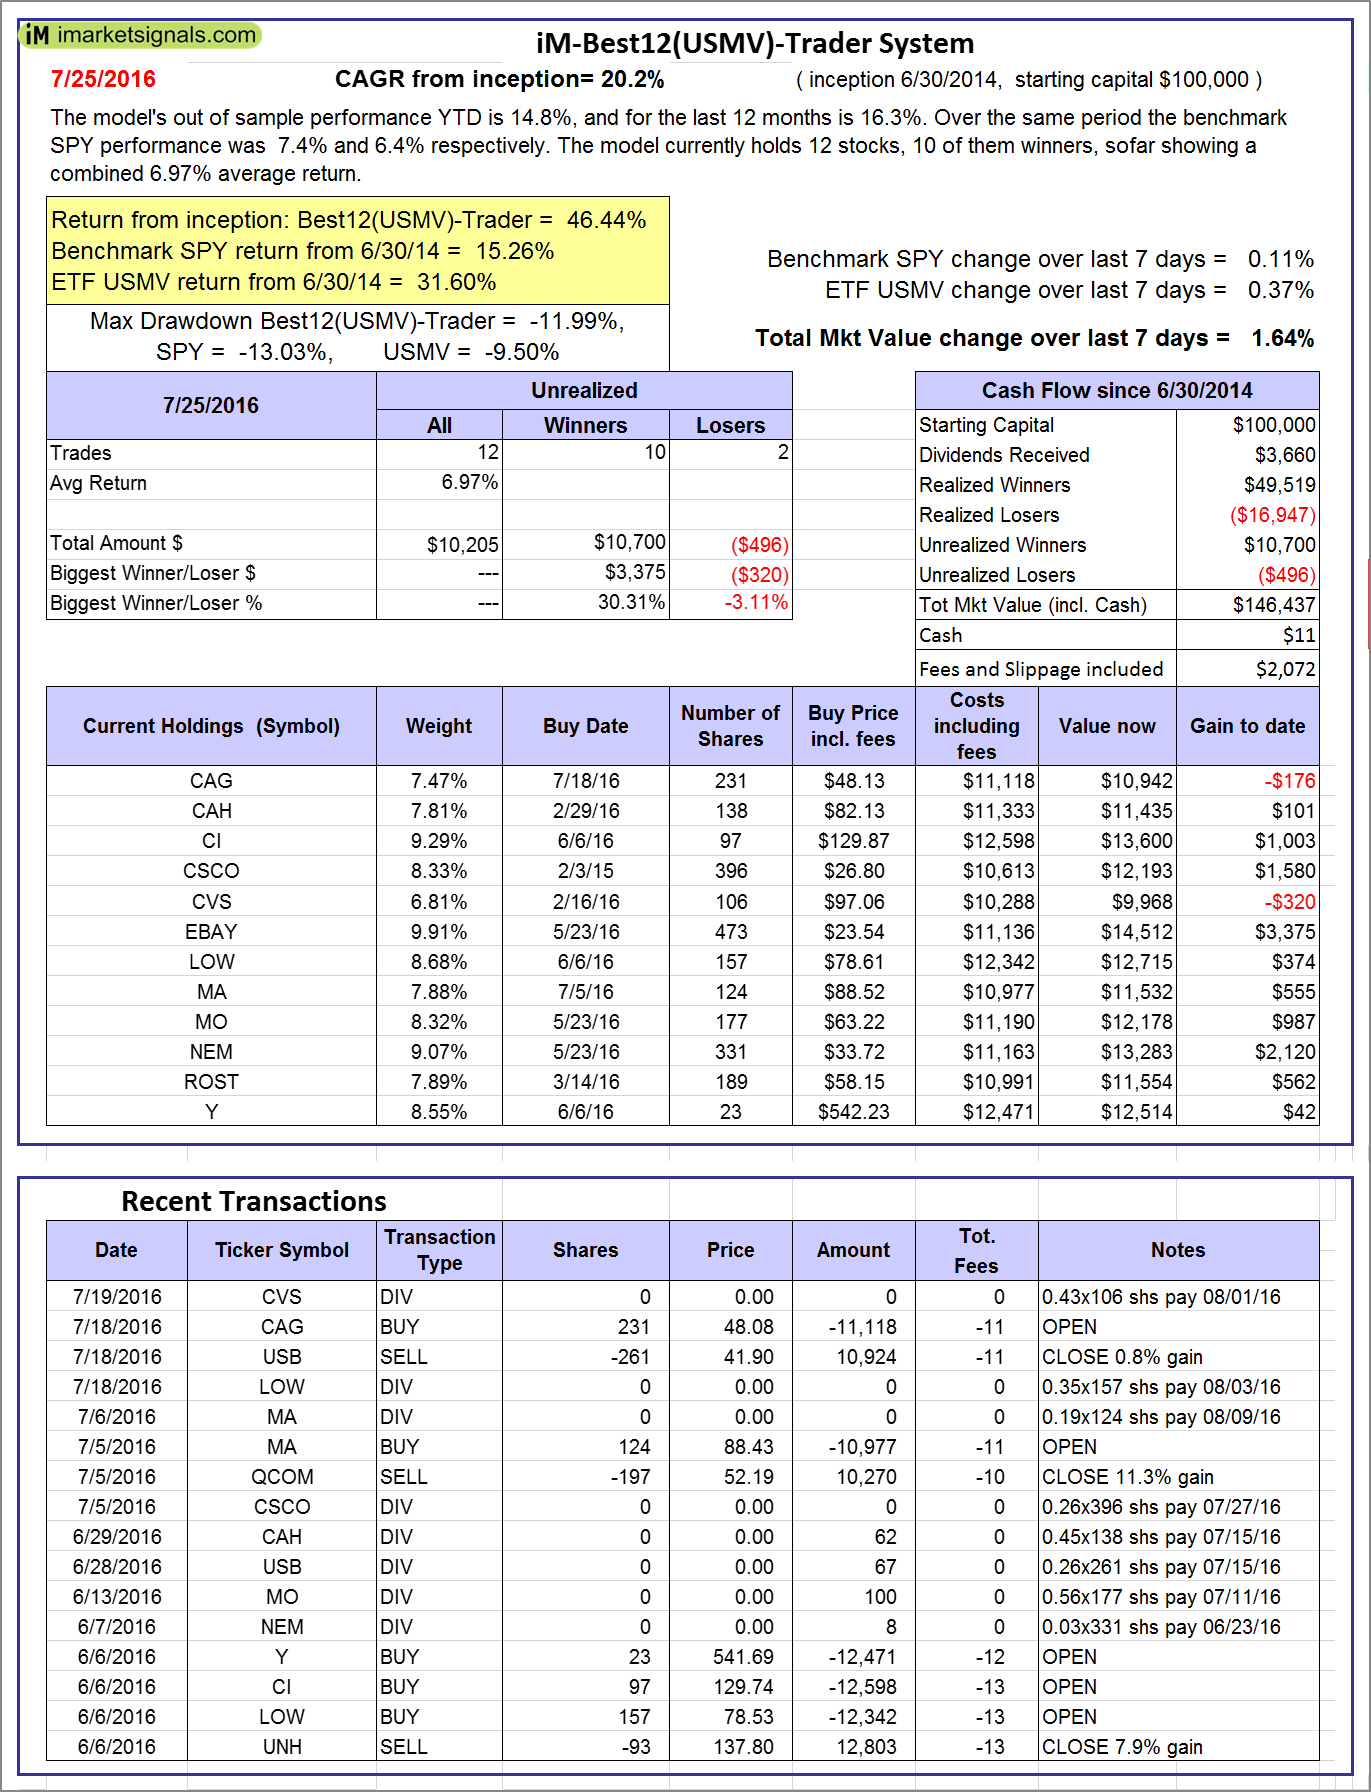 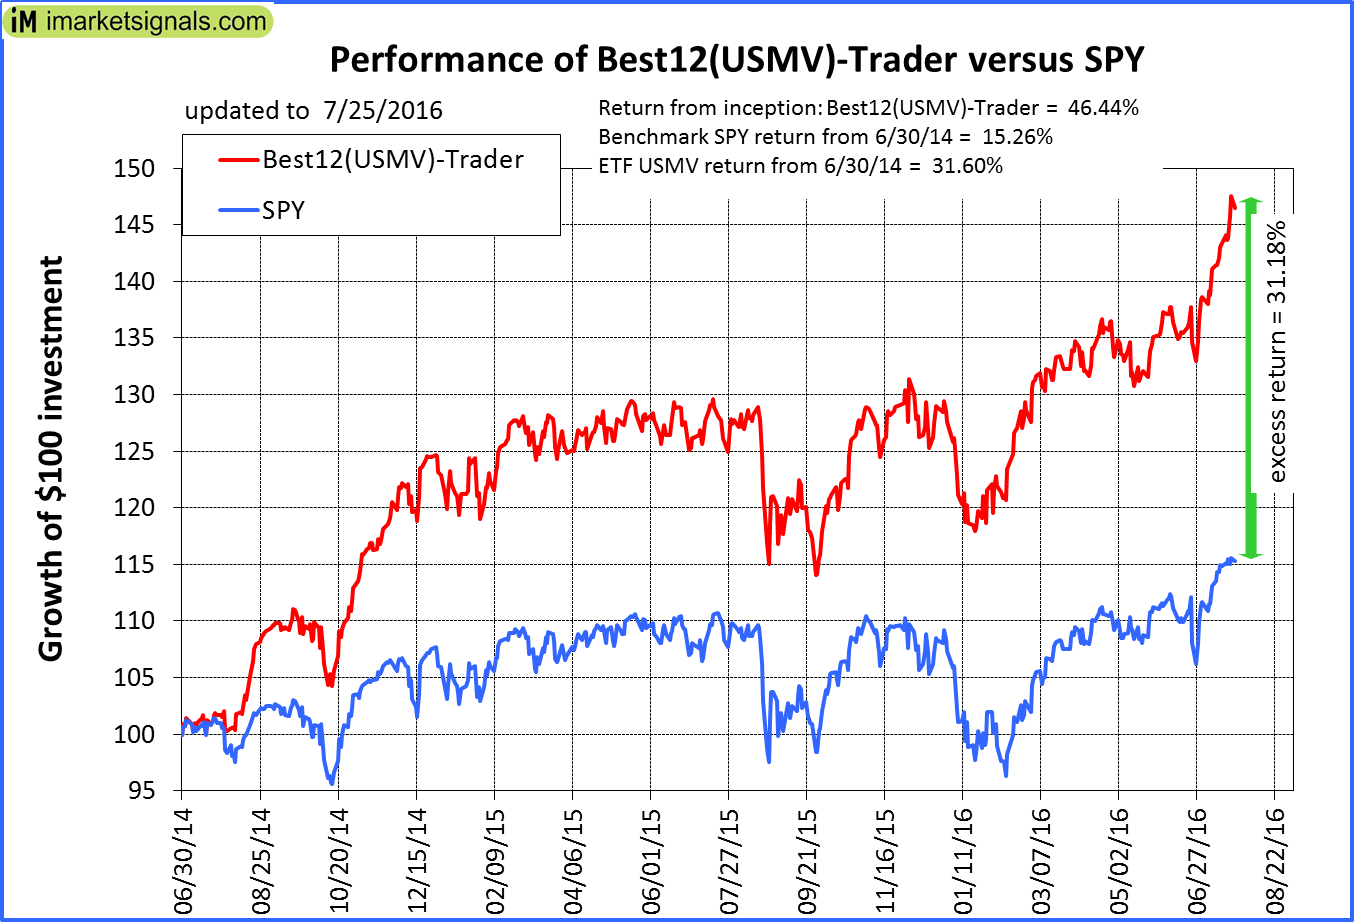 |
iM-Best12(USMV)-Trader: The model’s out of sample performance YTD is 14.8%, and for the last 12 months is 16.3%. Over the same period the benchmark SPY performance was 7.4% and 6.4% respectively. Since inception, on 7/1/2014, the model gained 46.44% while the benchmark SPY gained 15.26% and the ETF USMV gained 31.60% over the same period. Over the previous week the market value of iM-Best12(USMV)-Trader gained 1.64% at a time when SPY gained 0.11%. A starting capital of $100,000 at inception on 7/1/2014 would have grown to $146,437 which includes $11 cash and excludes $2,072 spent on fees and slippage. |
 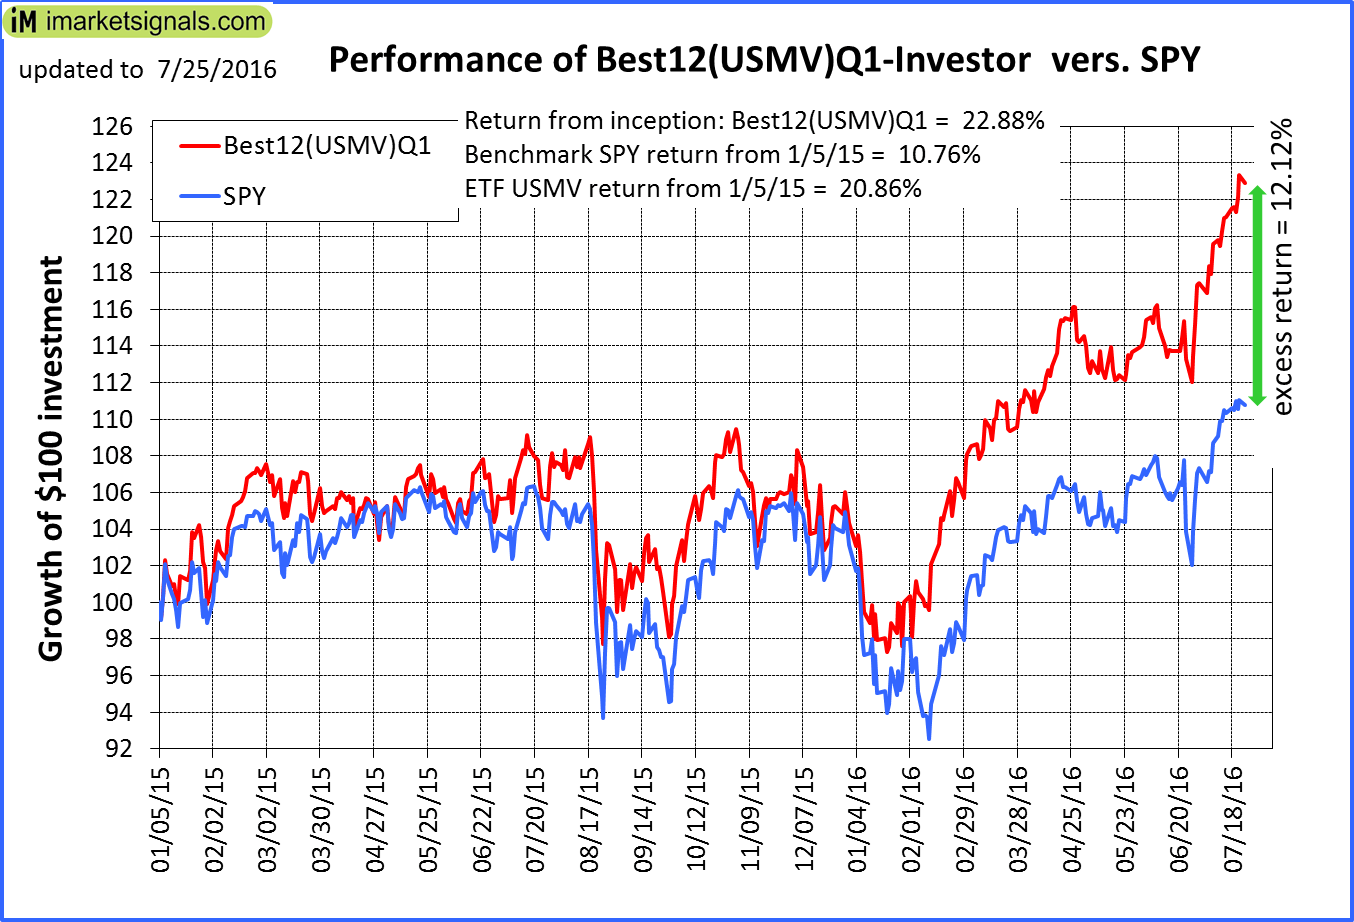 |
iM-Best12(USMV)Q1-Investor: The model’s out of sample performance YTD is 17.8%, and for the last 12 months is 16.3%. Over the same period the benchmark SPY performance was 7.4% and 6.4% respectively. Since inception, on 1/5/2015, the model gained 22.88% while the benchmark SPY gained 10.76% and the ETF USMV gained 20.86% over the same period. Over the previous week the market value of iM-Best12(USMV)Q1 gained 1.11% at a time when SPY gained 0.11%. A starting capital of $100,000 at inception on 1/5/2015 would have grown to $122,875 which includes $3 cash and excludes $472 spent on fees and slippage. |
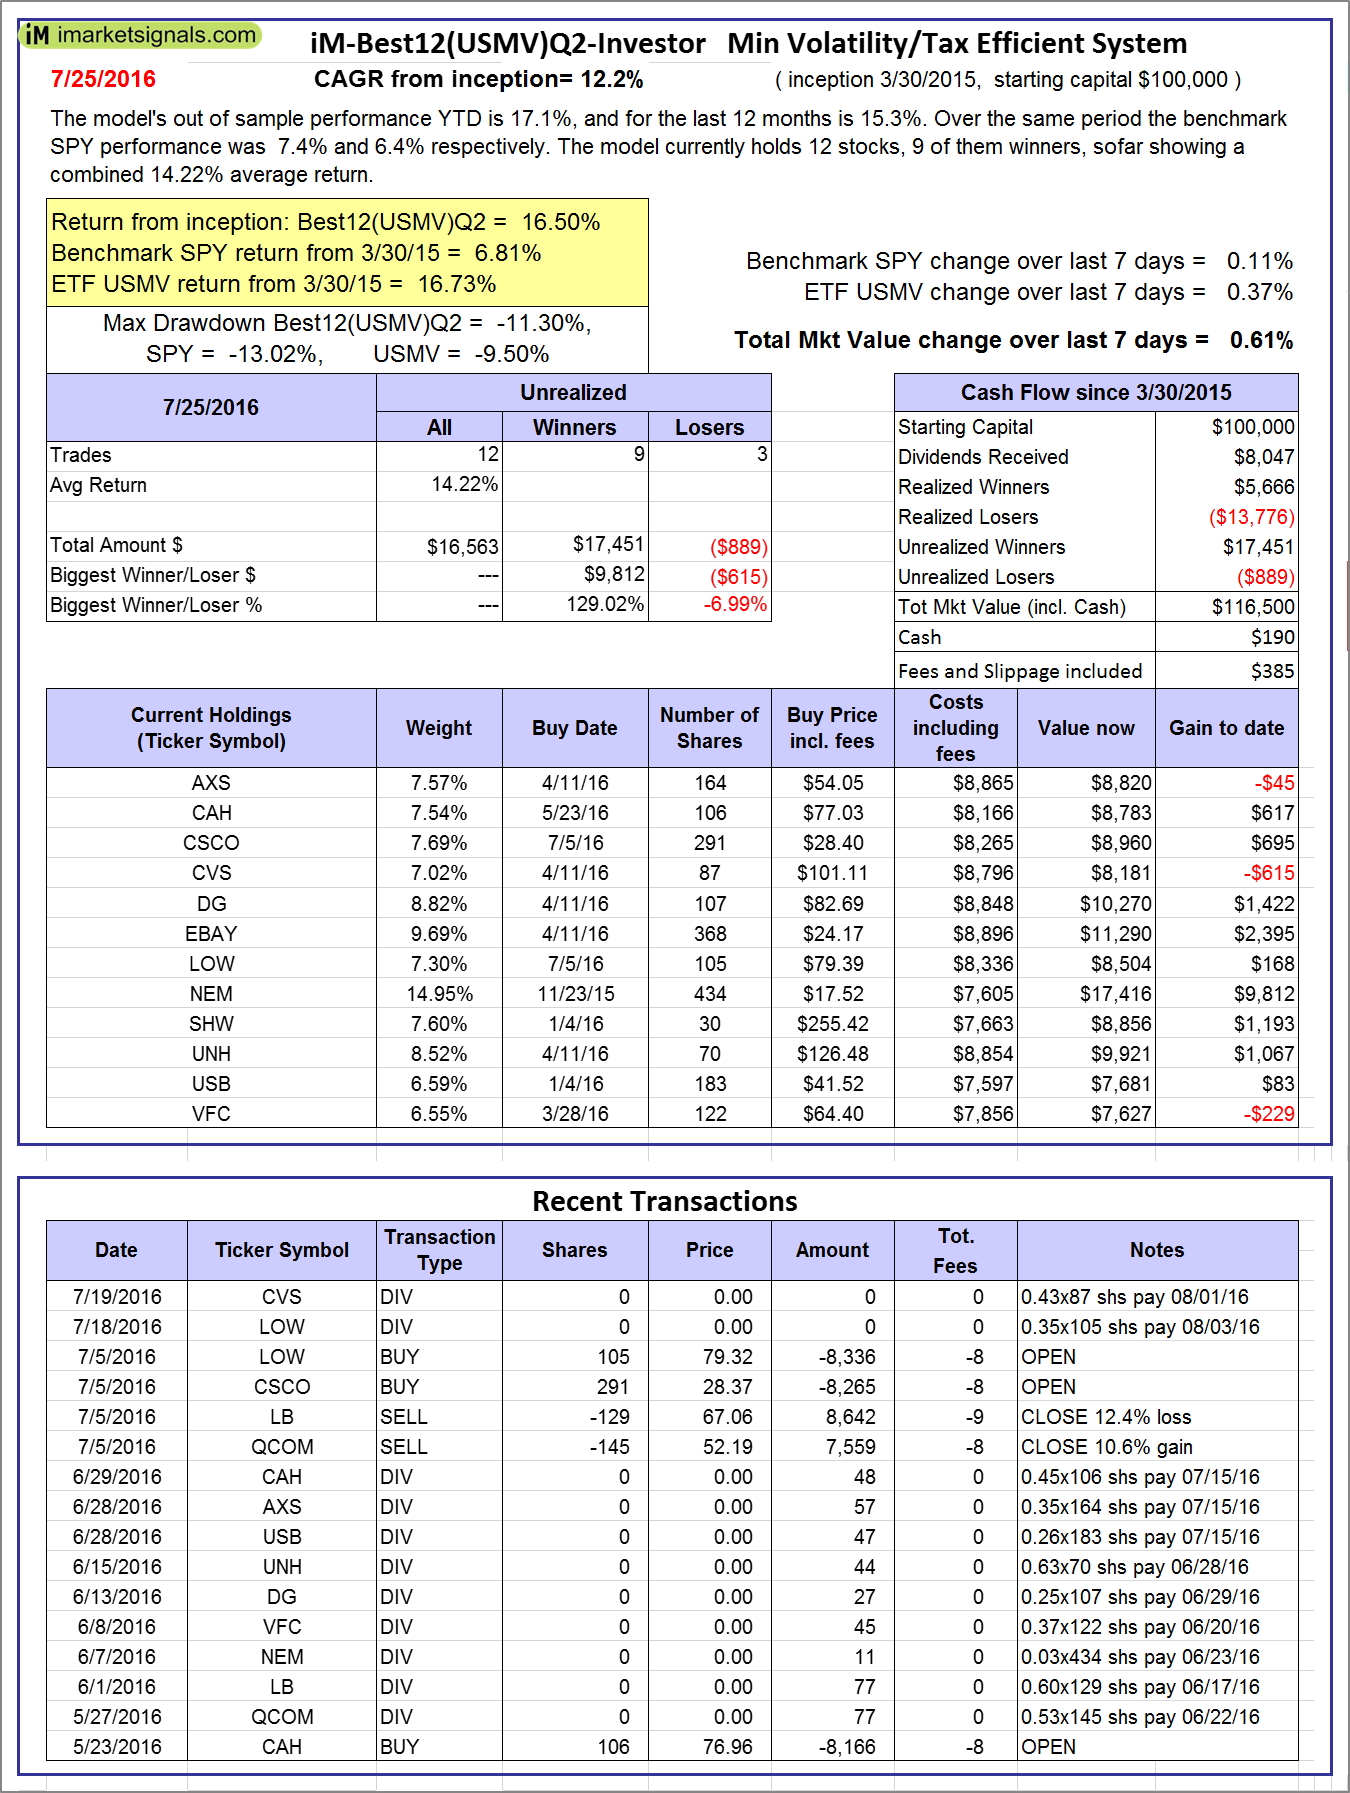 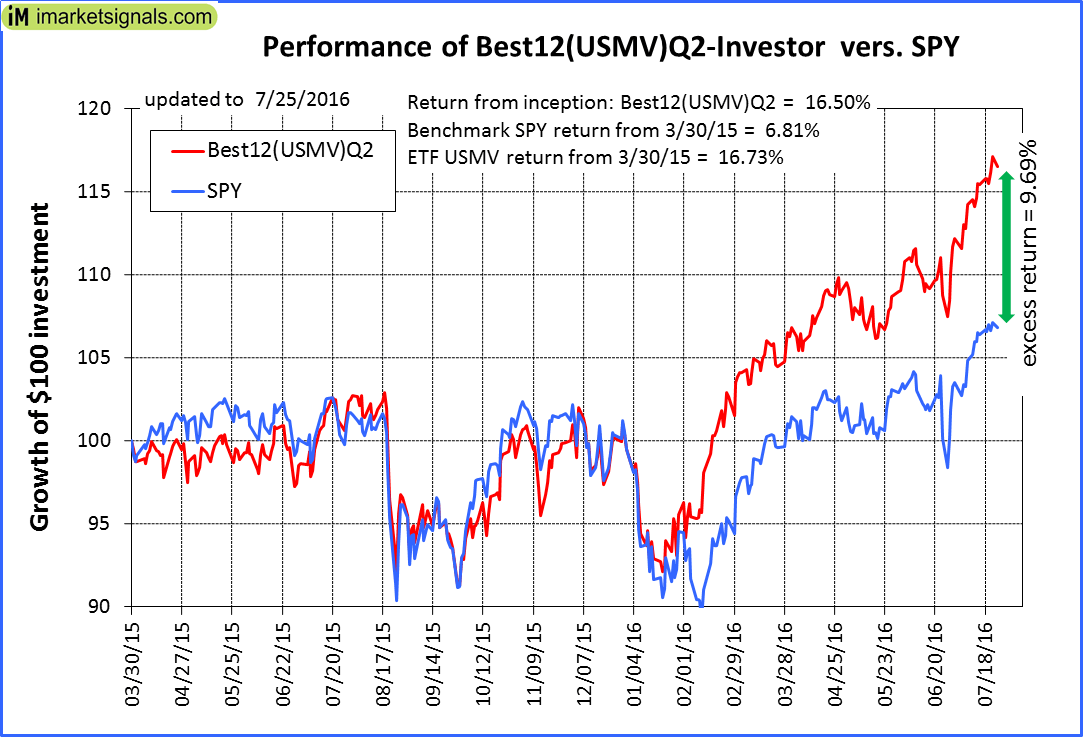 |
iM-Best12(USMV)Q2-Investor: The model’s out of sample performance YTD is 17.1%, and for the last 12 months is 15.3%. Over the same period the benchmark SPY performance was 7.4% and 6.4% respectively. Since inception, on 3/31/2015, the model gained 16.50% while the benchmark SPY gained 6.81% and the ETF USMV gained 16.73% over the same period. Over the previous week the market value of iM-Best12(USMV)Q2 gained 0.61% at a time when SPY gained 0.11%. A starting capital of $100,000 at inception on 3/31/2015 would have grown to $116,500 which includes $190 cash and excludes $385 spent on fees and slippage. |
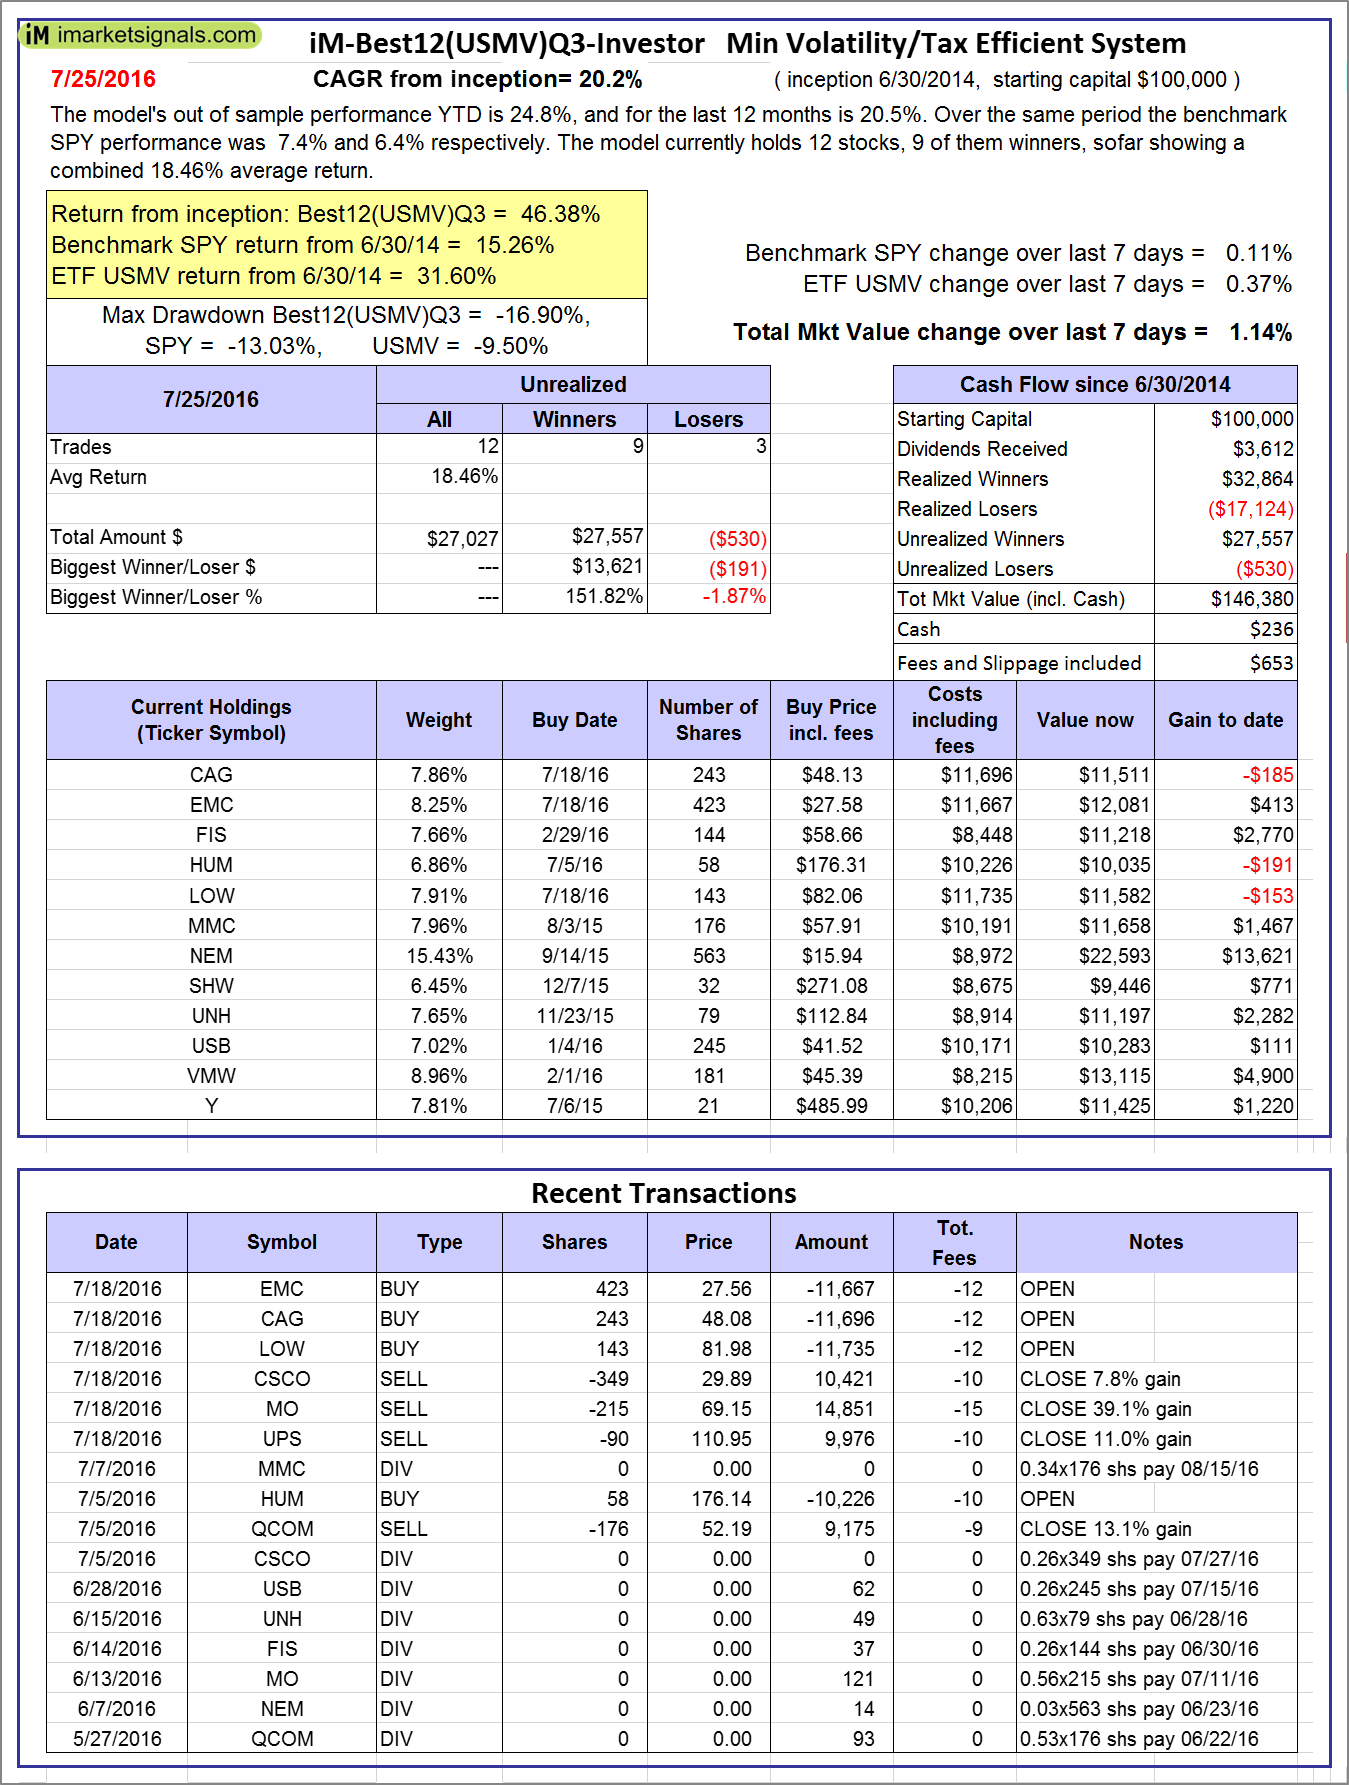 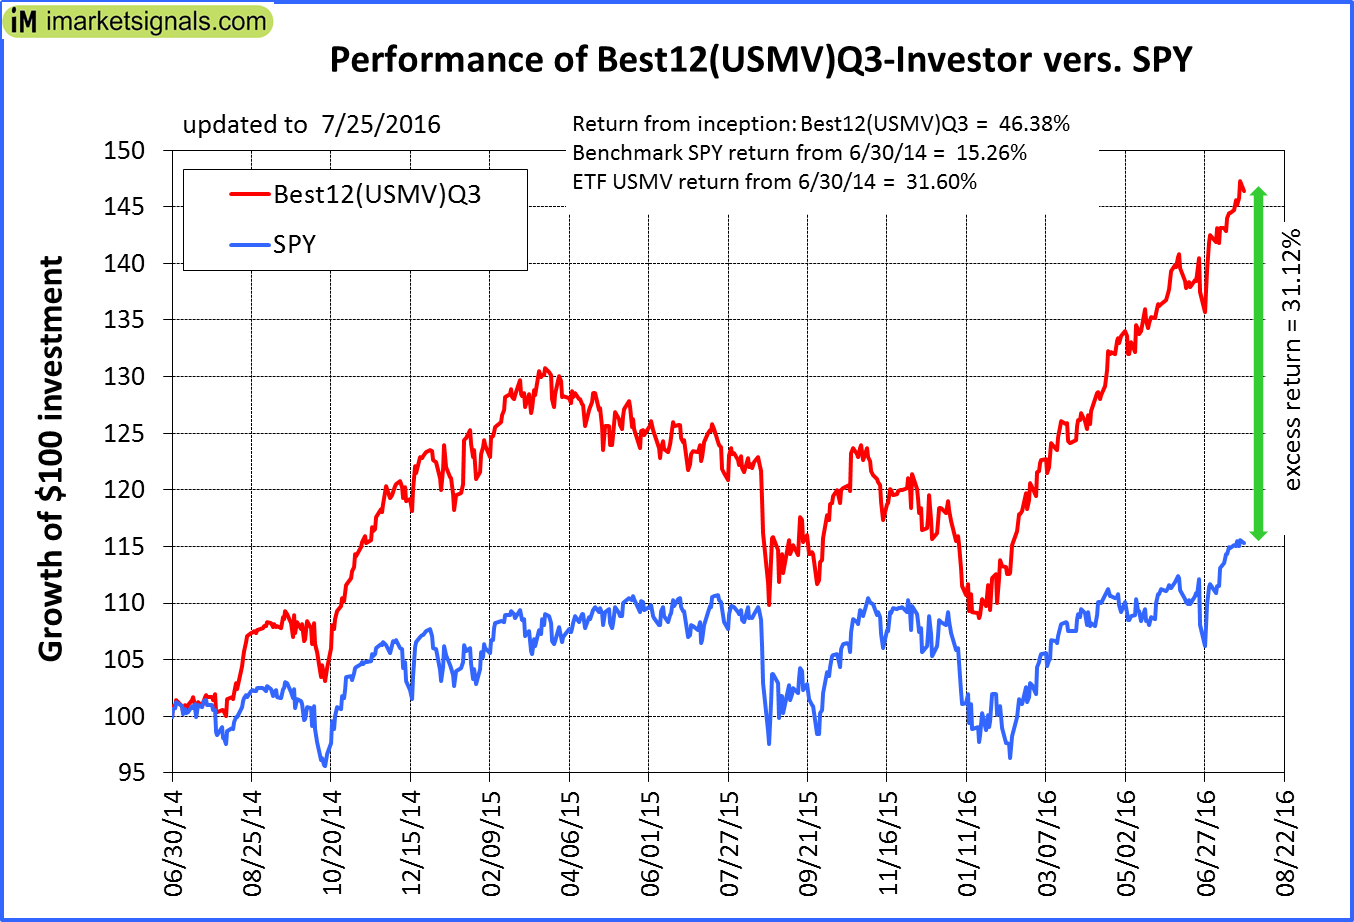 |
iM-Best12(USMV)Q3-Investor: The model’s out of sample performance YTD is 24.8%, and for the last 12 months is 20.5%. Over the same period the benchmark SPY performance was 7.4% and 6.4% respectively. Since inception, on 7/1/2014, the model gained 46.38% while the benchmark SPY gained 15.26% and the ETF USMV gained 31.60% over the same period. Over the previous week the market value of iM-Best12(USMV)Q3 gained 1.14% at a time when SPY gained 0.11%. A starting capital of $100,000 at inception on 7/1/2014 would have grown to $146,380 which includes $236 cash and excludes $653 spent on fees and slippage. |
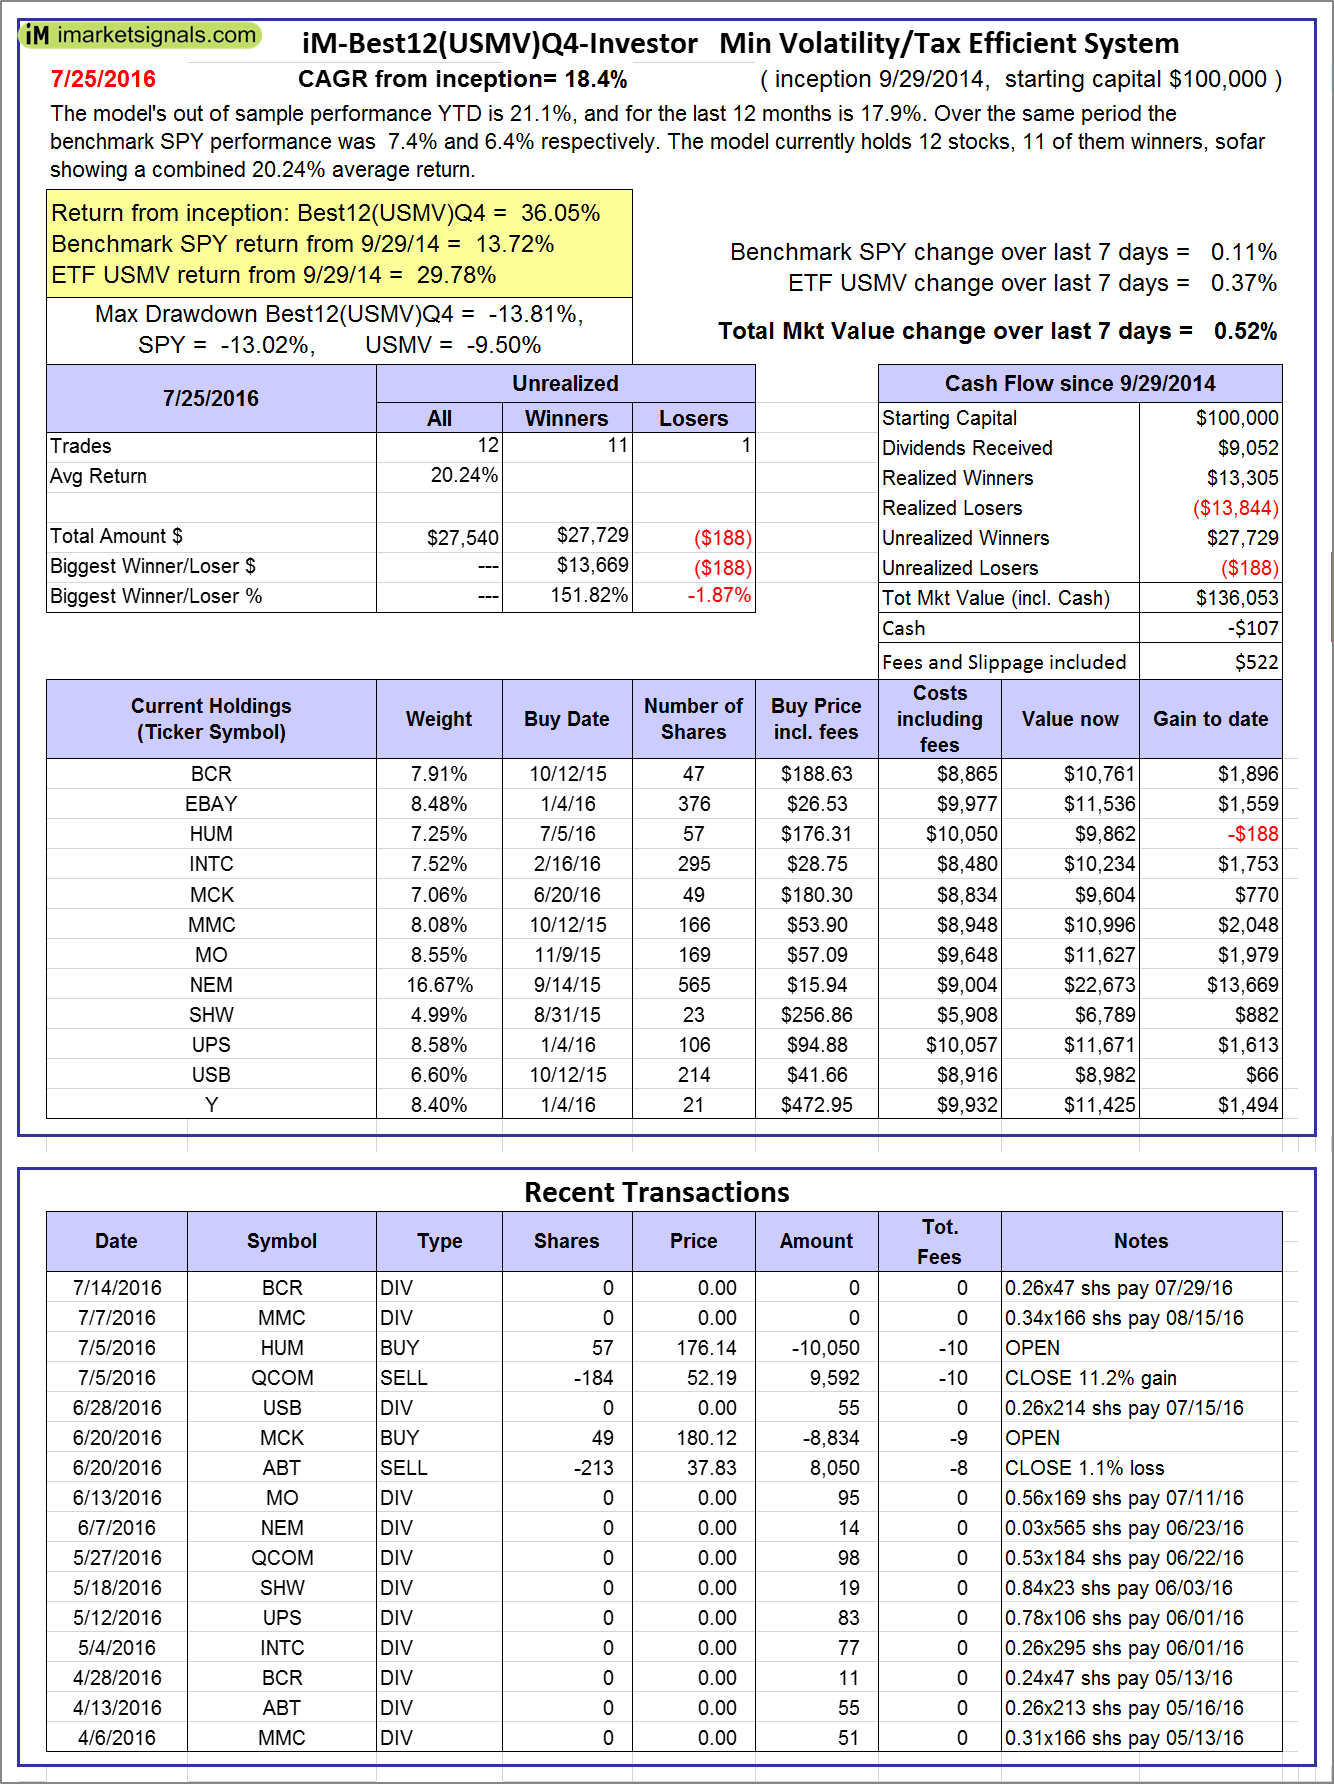 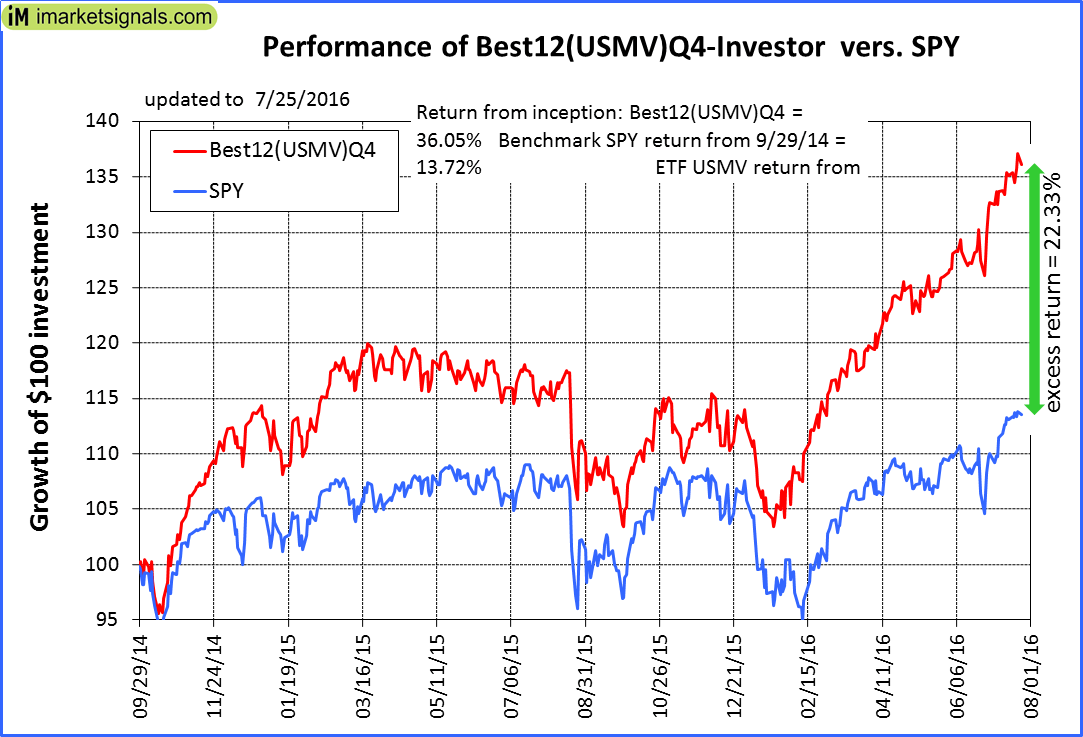 |
iM-Best12(USMV)Q4-Investor: Since inception, on 9/30/2014, the model gained 36.05% while the benchmark SPY gained 13.72% and the ETF USMV gained 29.78% over the same period. Over the previous week the market value of iM-Best12(USMV)Q4 gained 0.52% at a time when SPY gained 0.11%. A starting capital of $100,000 at inception on 9/30/2014 would have grown to $136,053 which includes -$107 cash and excludes $522 spent on fees and slippage. |
 |
Average Performance of iM-Best12(USMV)Q1+Q2+Q3+Q4-Investor resulted in an excess return of 29.99% over SPY. (see iM-USMV Investor Portfolio) |
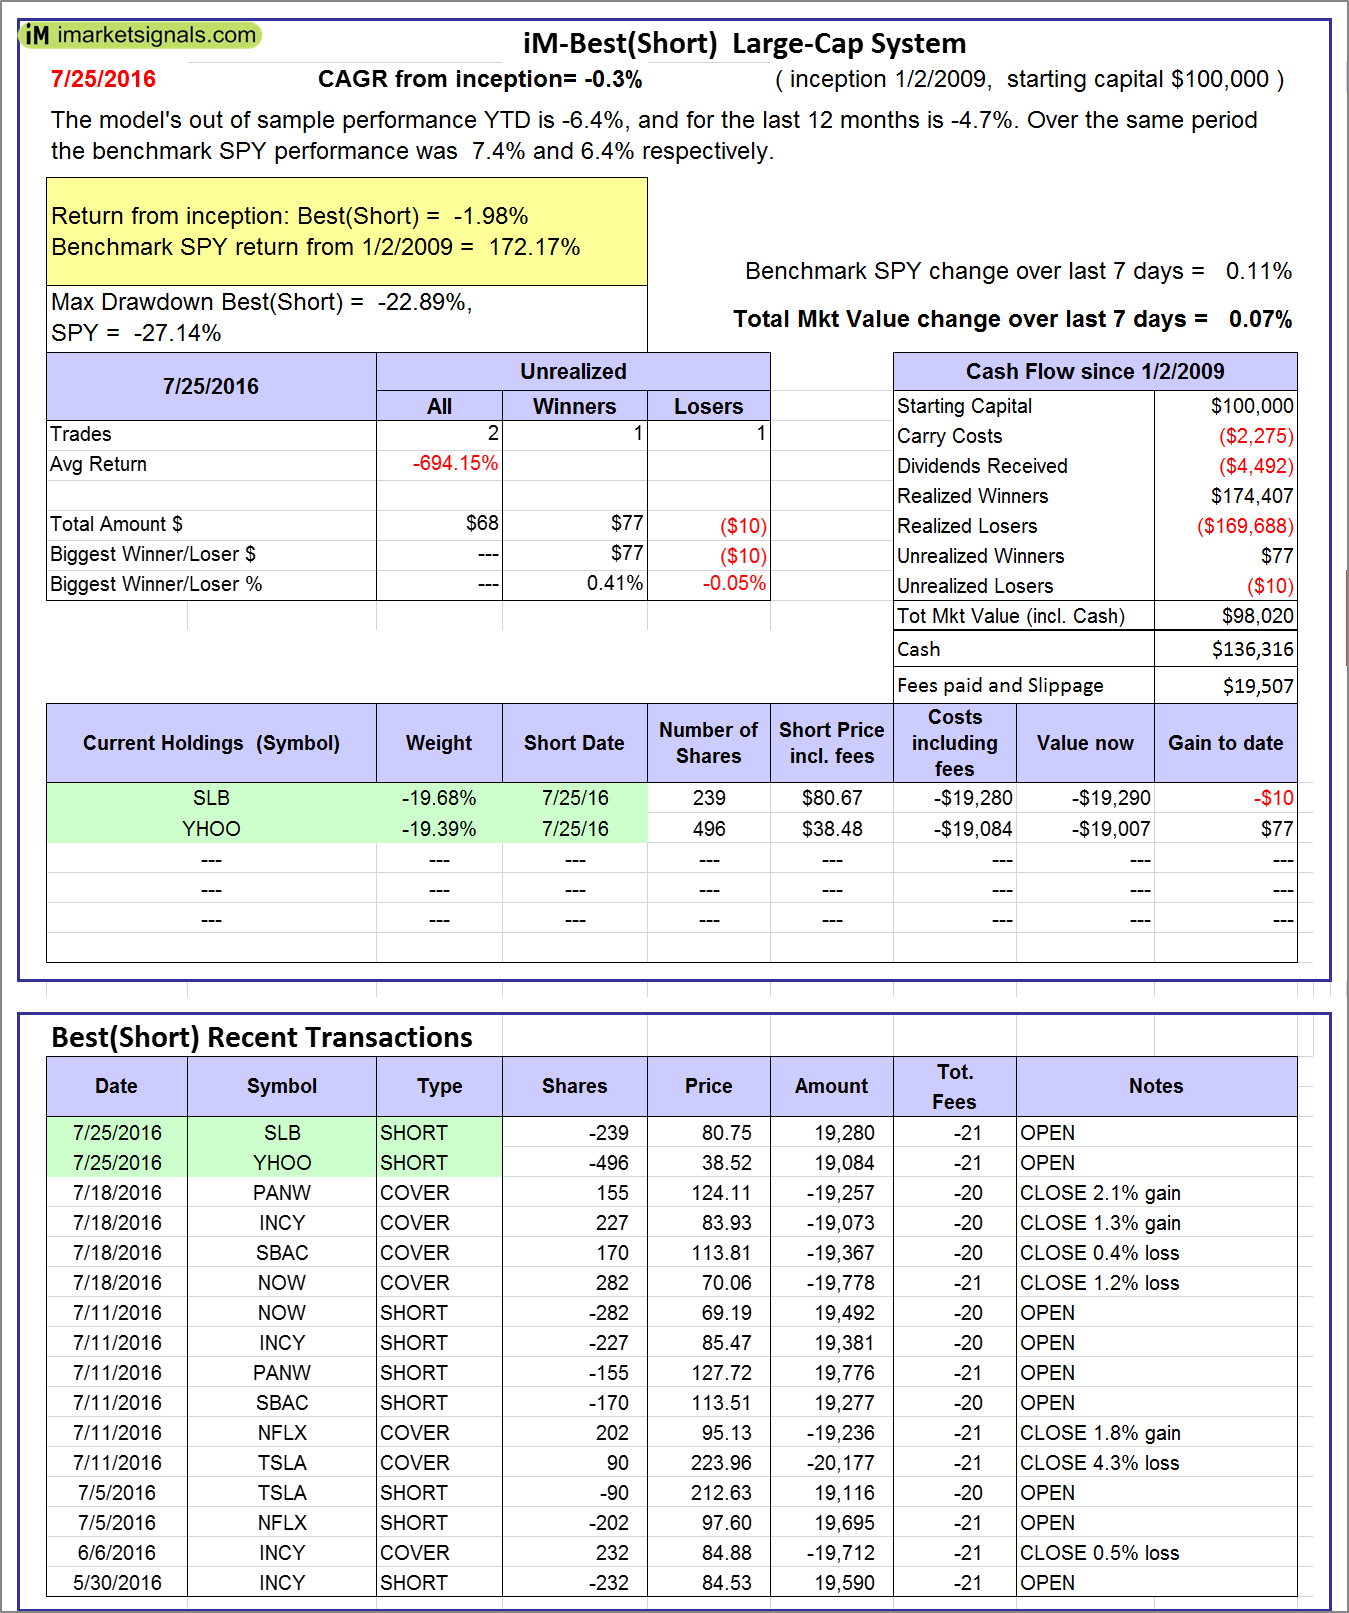 |
iM-Best(Short): The model’s out of sample performance YTD is -6.4%, and for the last 12 months is -4.7%. Over the same period the benchmark SPY performance was 7.4% and 6.4% respectively. Over the previous week the market value of iM-Best(Short) gained 0.07% at a time when SPY gained 0.11%. Over the period 1/2/2009 to 7/25/2016 the starting capital of $100,000 would have grown to $98,020 which includes $136,316 cash and excludes $19,507 spent on fees and slippage. |
iM-Best Reports – 7/25/2016
Posted in pmp SPY-SH
Leave a Reply
You must be logged in to post a comment.