
  |
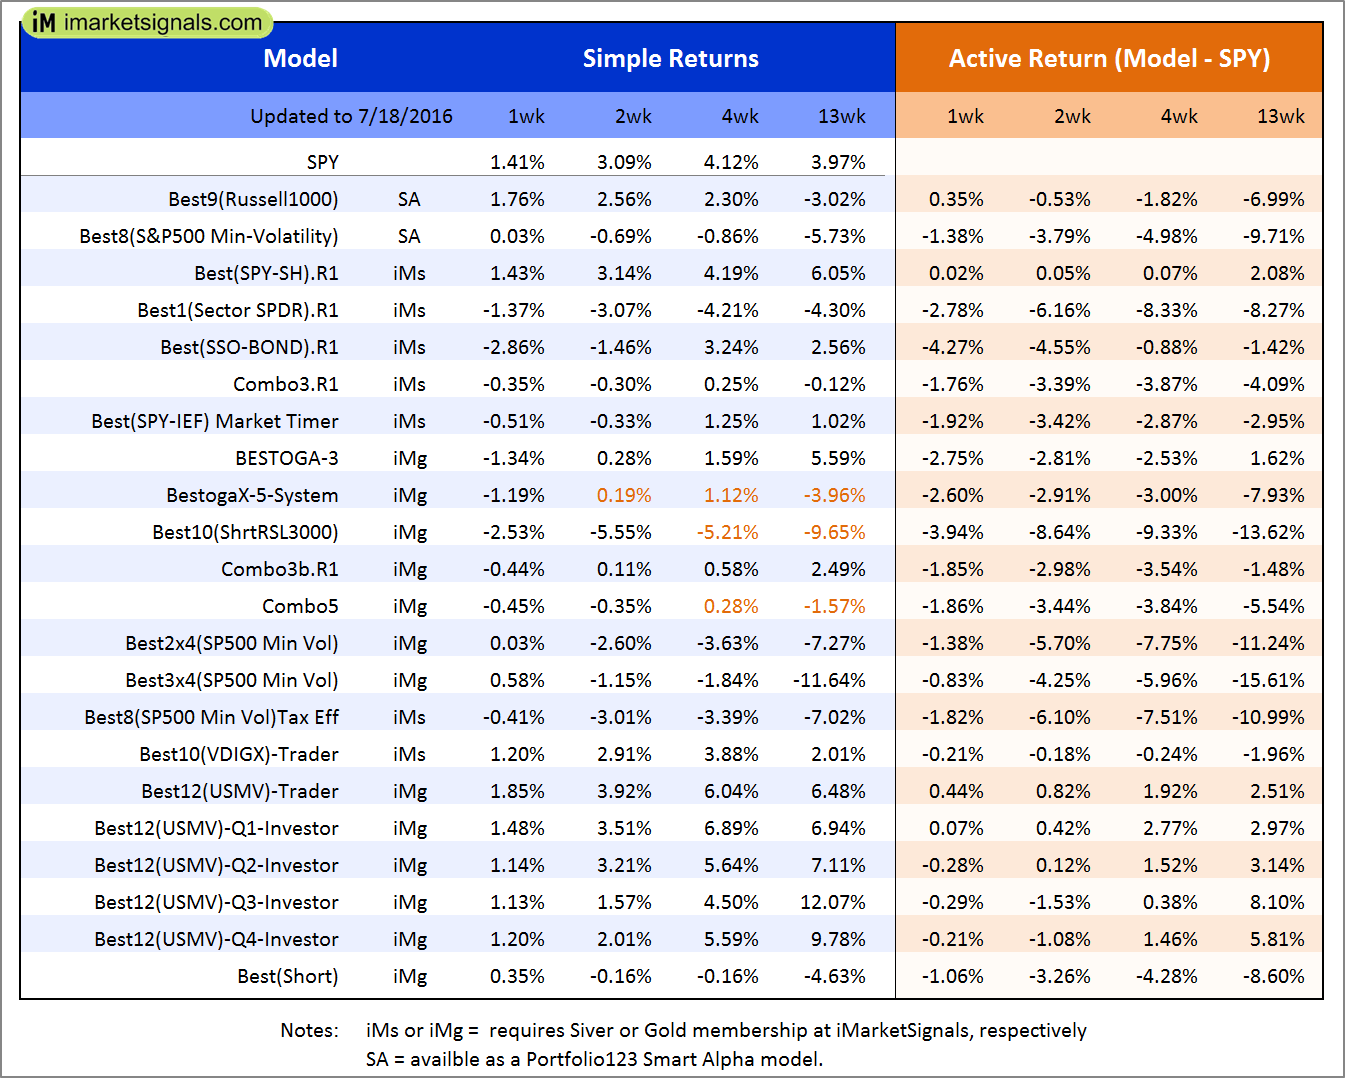
Out of sample performance summary of our models for the past 1, 2, 4 and 13 week periods. The active active return indicates how the models over- or underperformed the benchmark ETF SPY. Also the YTD, and the 1-, 3-, 5- and 10-year annualized returns are shown in the second table |
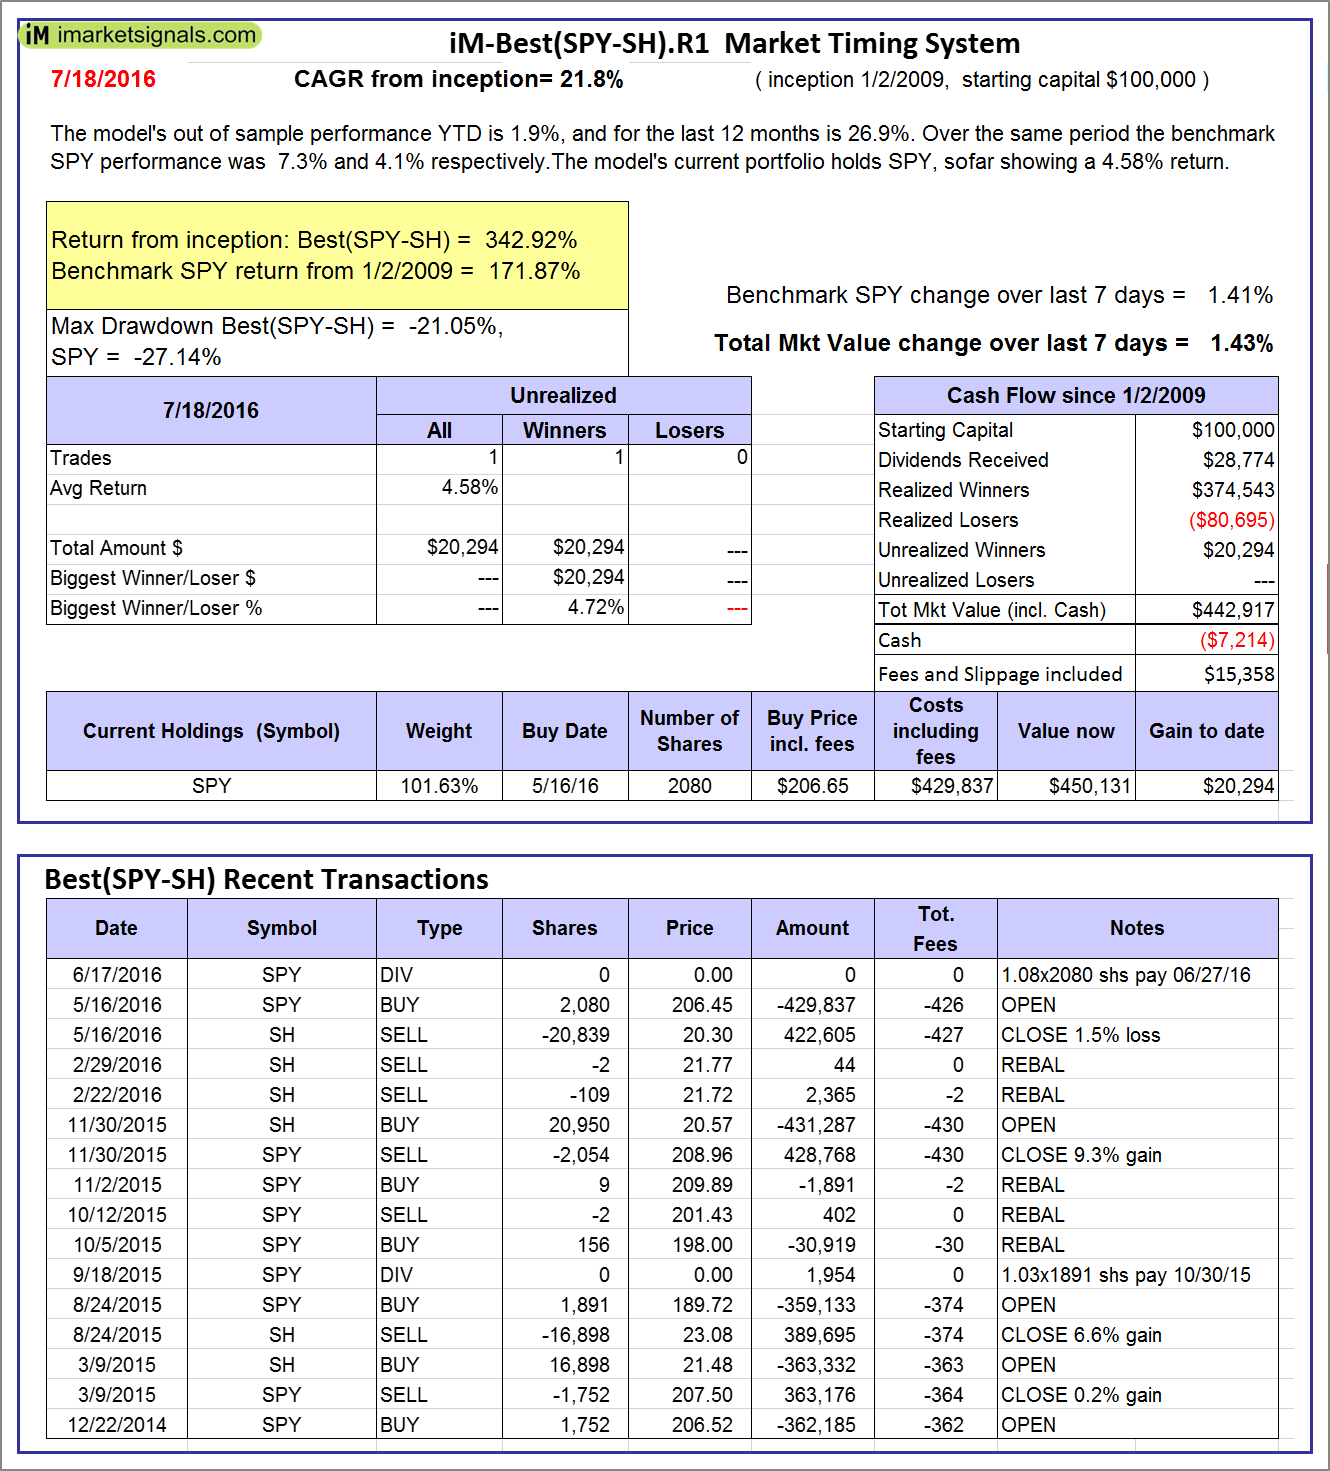 |
iM-Best(SPY-SH).R1: The model’s out of sample performance YTD is 1.9%, and for the last 12 months is 26.9%. Over the same period the benchmark SPY performance was 7.3% and 4.1% respectively. Over the previous week the market value of Best(SPY-SH) gained 1.43% at a time when SPY gained 1.41%. A starting capital of $100,000 at inception on 1/2/2009 would have grown to $442,917 which includes -$7,214 cash and excludes $15,358 spent on fees and slippage. |
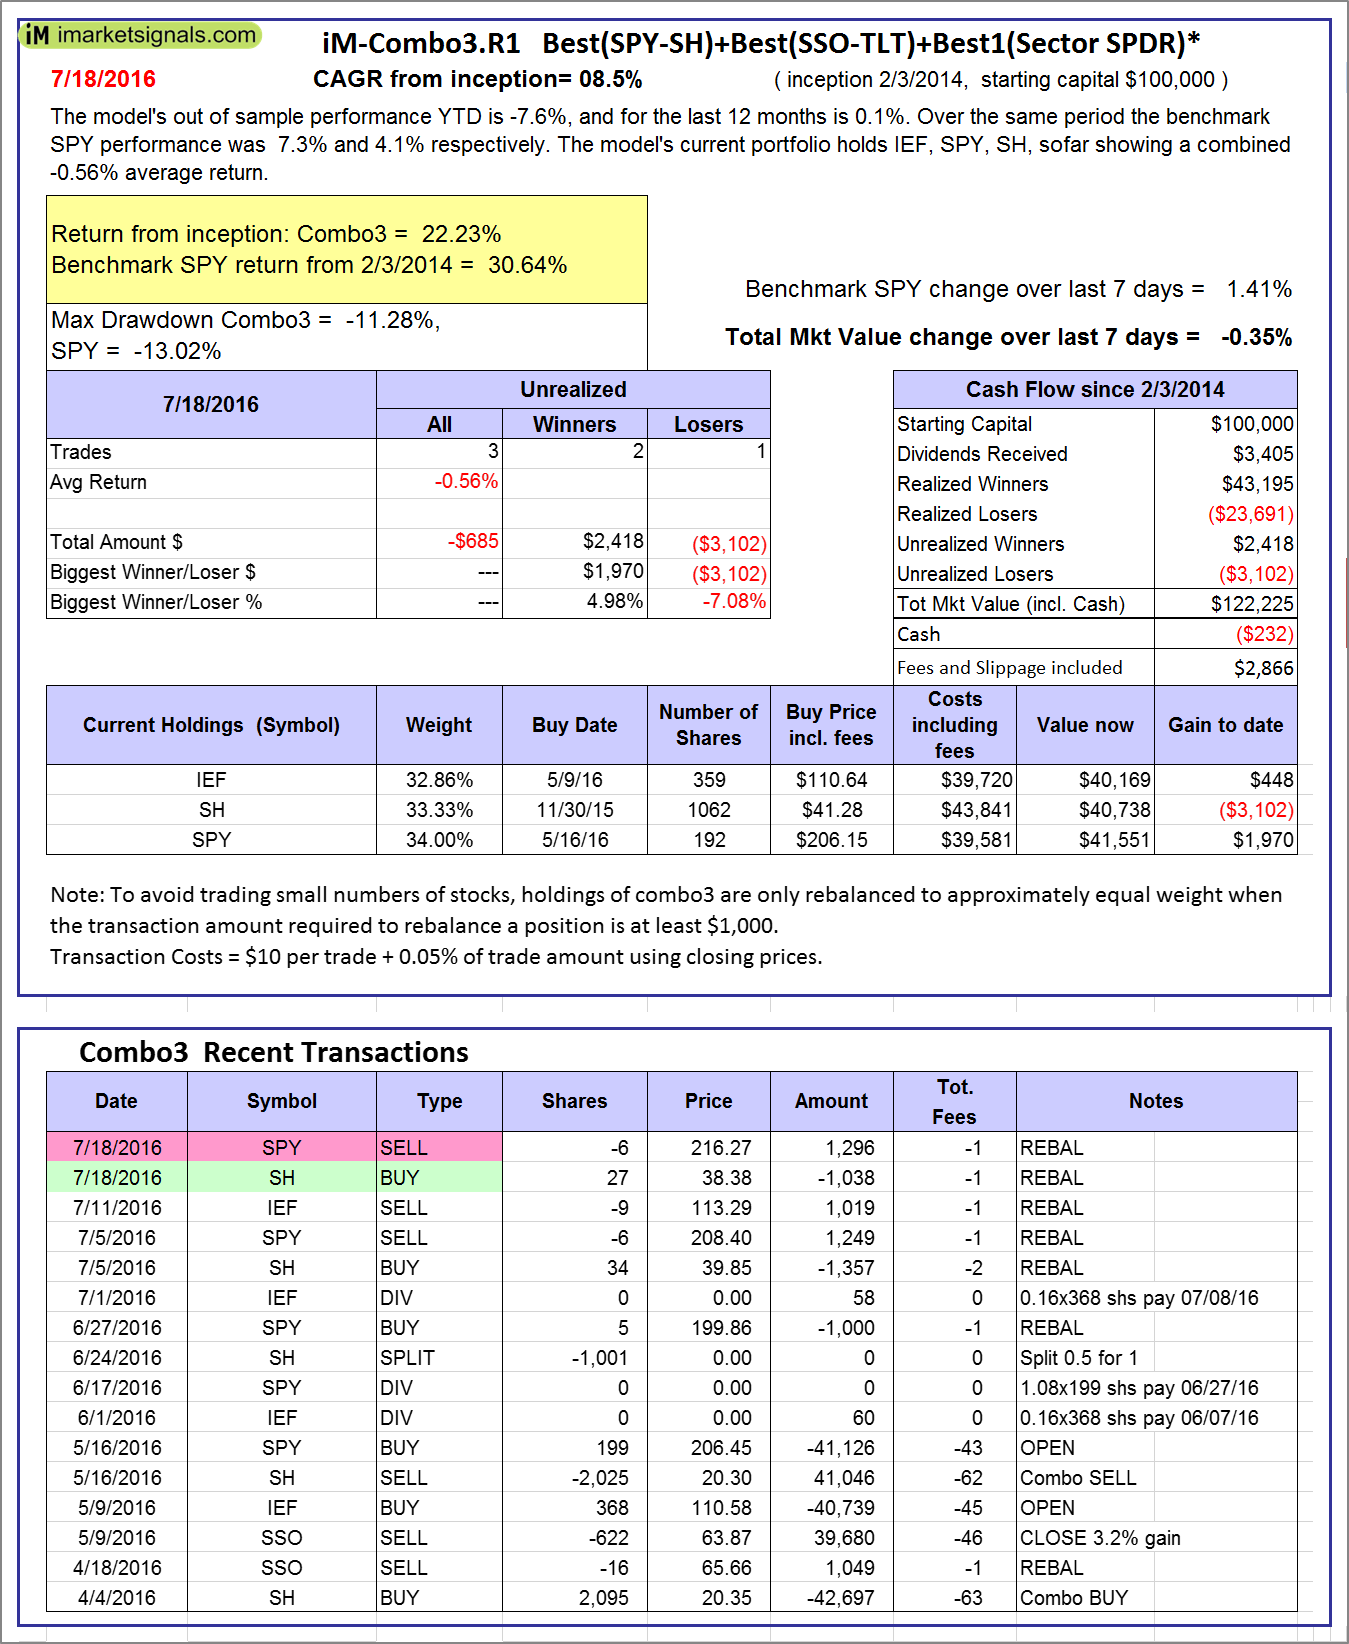 |
iM-Combo3.R1: The model’s out of sample performance YTD is -7.6%, and for the last 12 months is 0.1%. Over the same period the benchmark SPY performance was 7.3% and 4.1% respectively. Over the previous week the market value of iM-Combo3.R1 gained -0.35% at a time when SPY gained 1.41%. A starting capital of $100,000 at inception on 2/3/2014 would have grown to $122,225 which includes -$232 cash and excludes $2,866 spent on fees and slippage. |
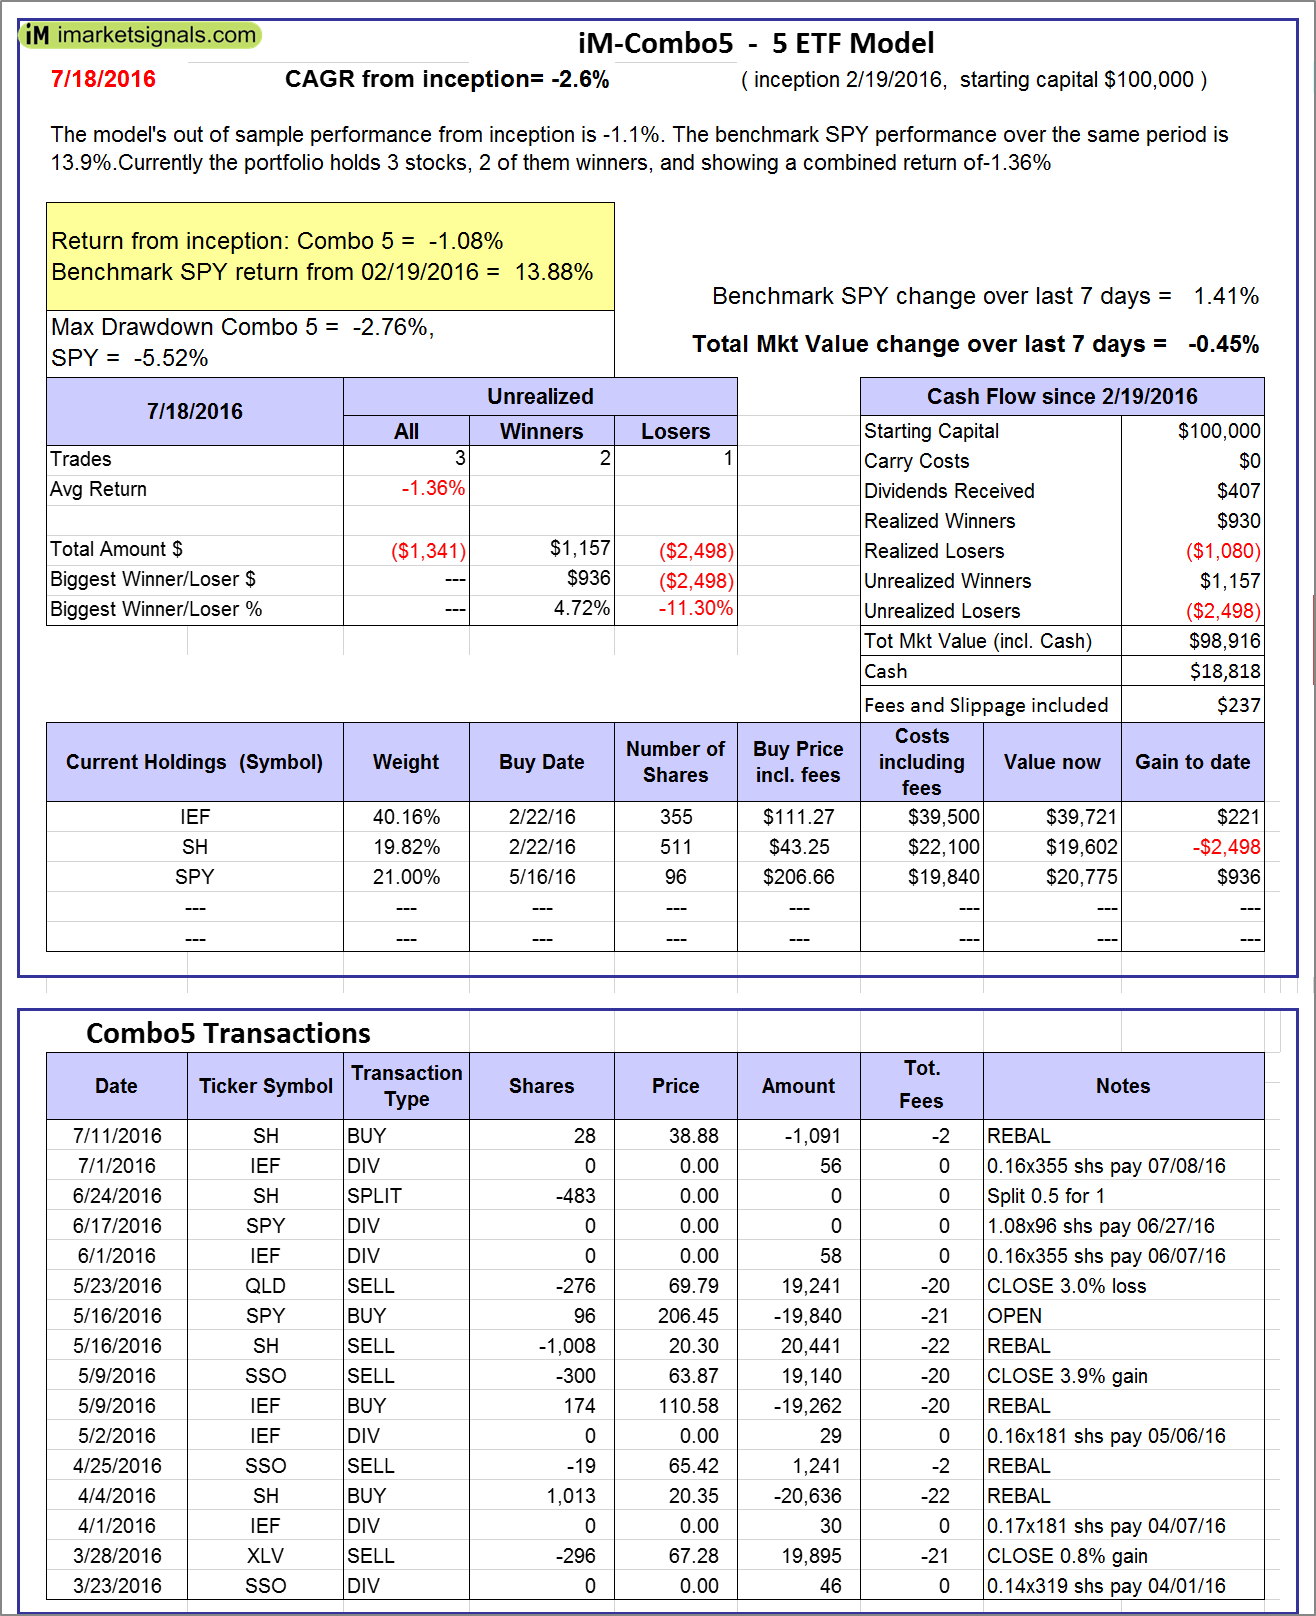 |
iM-Combo5: The model’s out of sample performance from inception is -1.1%. The benchmark SPY performance over the same period is 13.9%. Over the previous week the market value of iM-Combo5 gained -0.45% at a time when SPY gained 1.41%. A starting capital of $100,000 at inception on 2/22/2016 would have grown to $98,916 which includes $18,818 cash and excludes $237 spent on fees and slippage. |
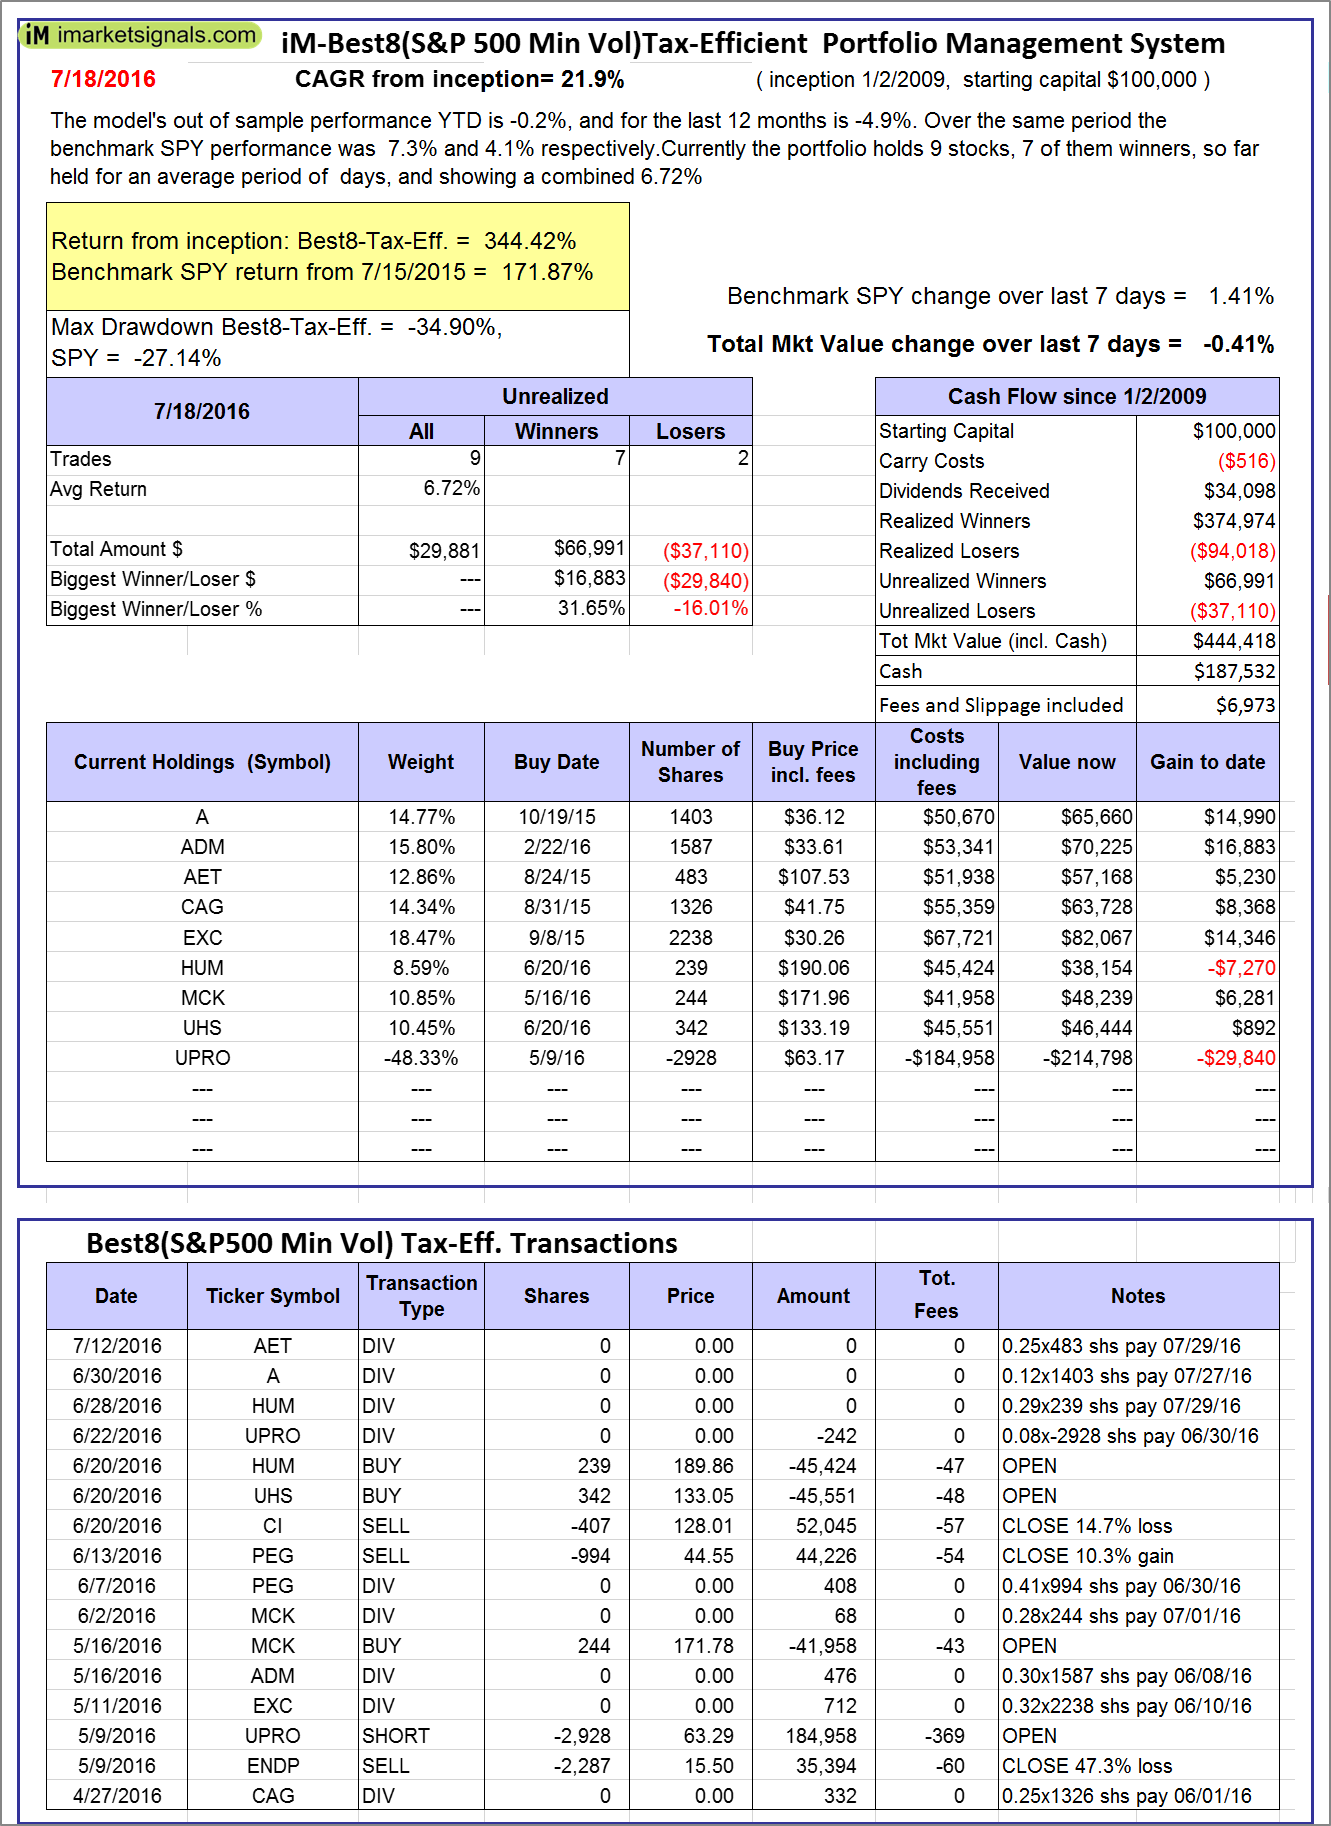 |
The iM-Best8(S&P500 Min Vol)Tax-Efficient The model’s out of sample performance YTD is -0.2%, and for the last 12 months is -4.9%. Over the same period the benchmark SPY performance was 7.3% and 4.1% respectively. Over the previous week the market value of iM-Best8(S&P 500)Tax-Eff. gained -0.41% at a time when SPY gained 1.41%. A starting capital of $100,000 at inception on 1/2/2009 would have grown to $444,418 which includes $187,532 cash and excludes $6,973 spent on fees and slippage. |
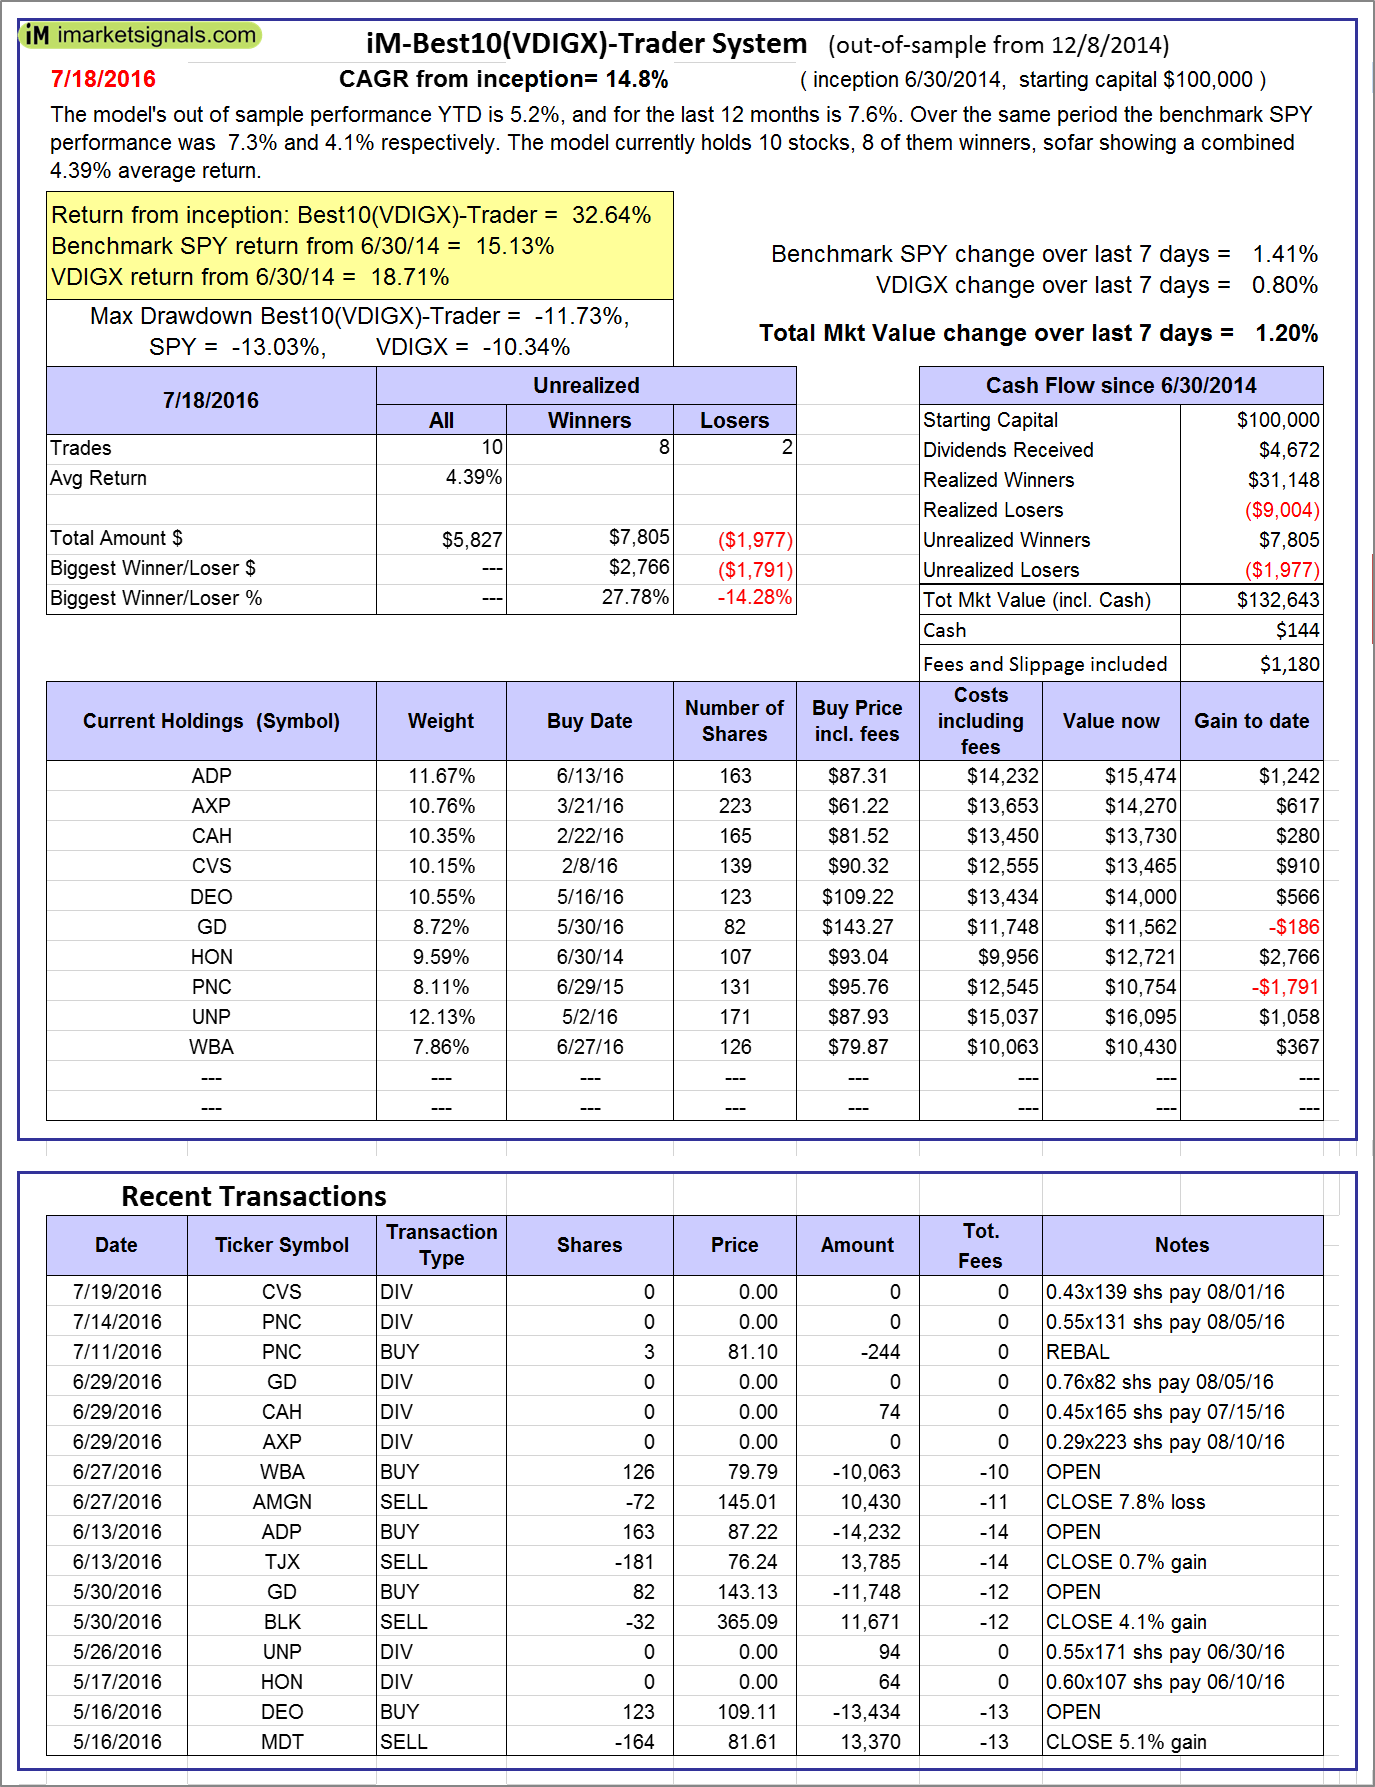  |
iM-Best10(VDIGX)-Trader: The model’s out of sample performance YTD is 5.2%, and for the last 12 months is 7.6%. Over the same period the benchmark SPY performance was 7.3% and 4.1% respectively. Since inception, on 7/1/2014, the model gained 32.64% while the benchmark SPY gained 15.13% and the ETF VDIGX gained 18.71% over the same period. Over the previous week the market value of iM-Best10(VDIGX) gained 1.20% at a time when SPY gained 1.41%. A starting capital of $100,000 at inception on 7/1/2014 would have grown to $132,643 which includes $144 cash and excludes $1,180 spent on fees and slippage. |
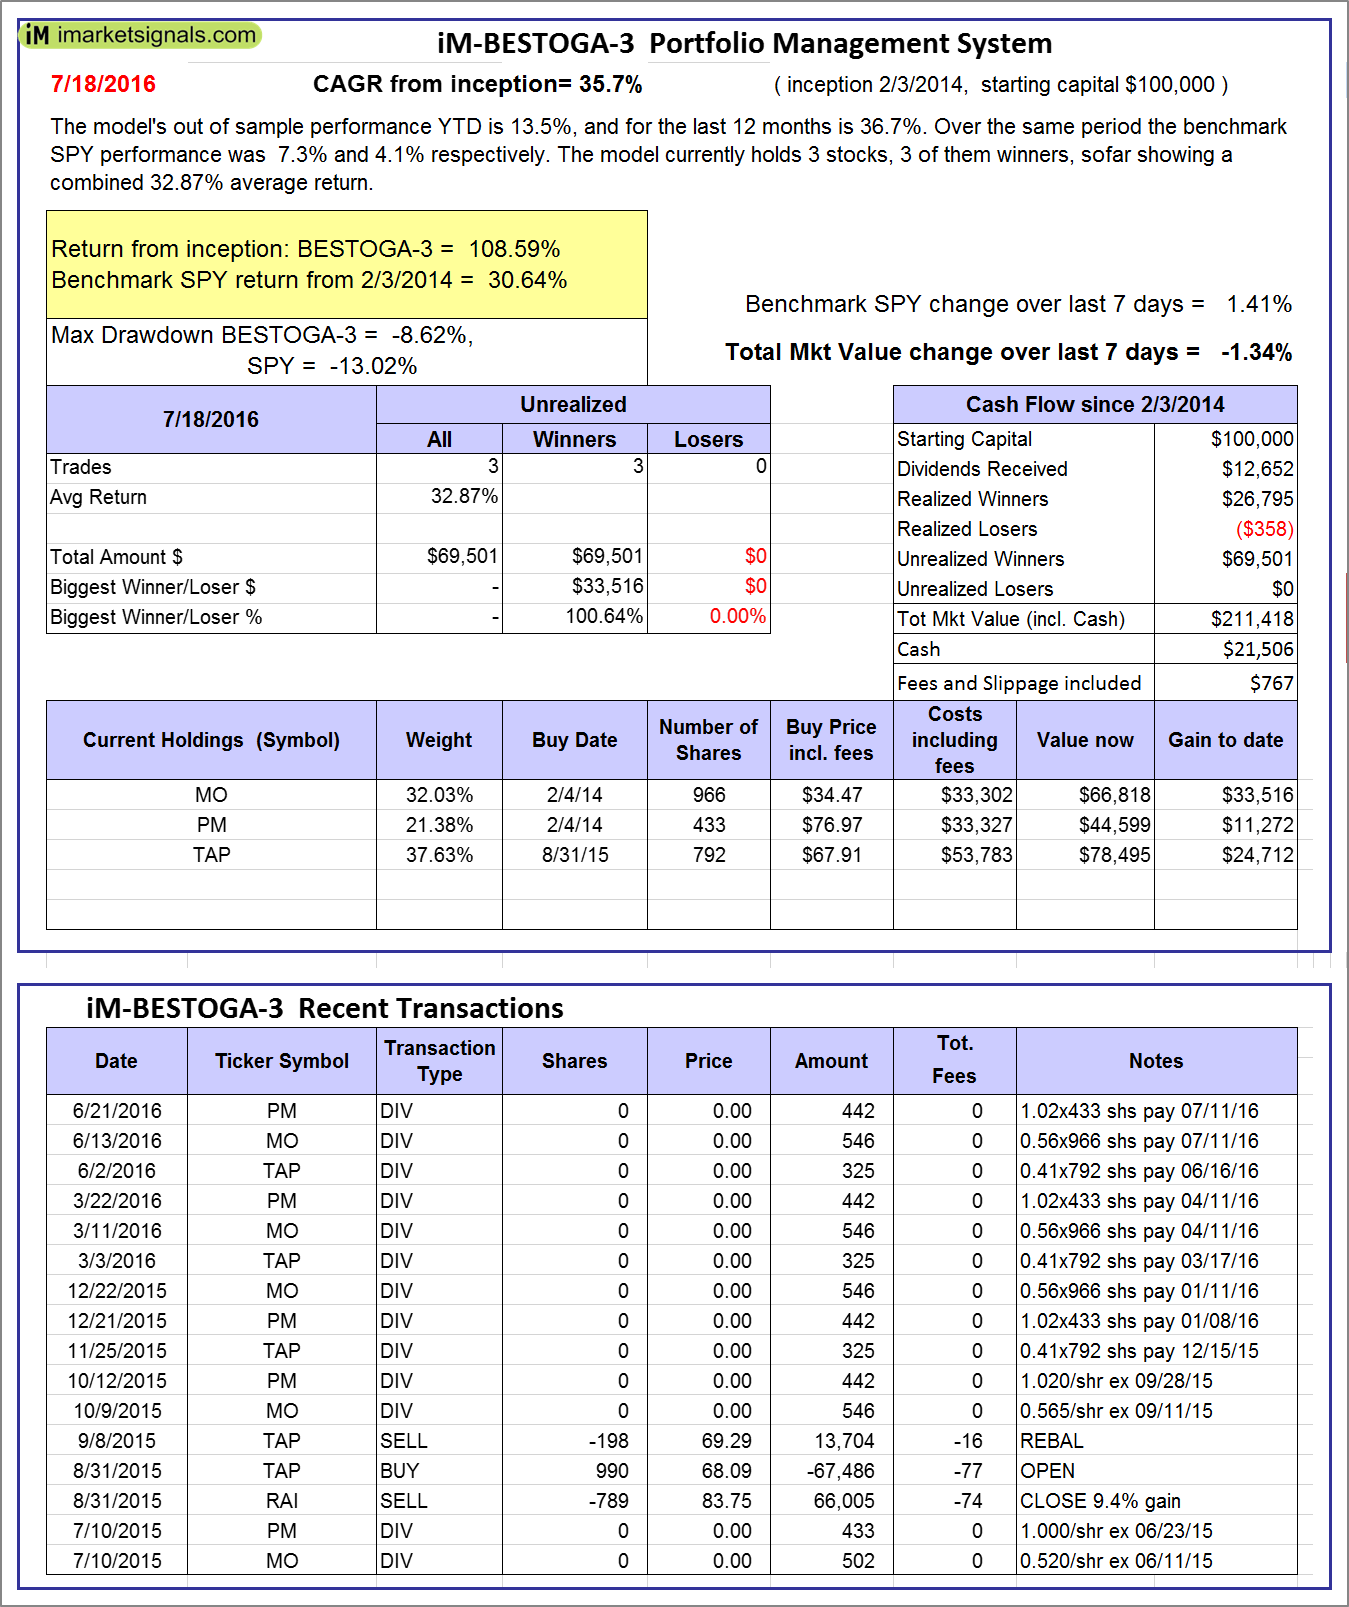 |
iM-BESTOGA-3: The model’s out of sample performance YTD is 13.5%, and for the last 12 months is 36.7%. Over the same period the benchmark SPY performance was 7.3% and 4.1% respectively. Over the previous week the market value of iM-BESTOGA-3 gained -1.34% at a time when SPY gained 1.41%. A starting capital of $100,000 at inception on 2/3/2014 would have grown to $211,418 which includes $21,506 cash and excludes $767 spent on fees and slippage. |
 |
iM-Best10(Short Russell3000): The model’s performance YTD is -30.3%, and for the last 12 months is -12.4%. Over the same period the benchmark SPY performance was 7.3% and 4.1% respectively. Over the previous week the market value of iM-Best10(Short Russell3000) gained -2.53% at a time when SPY gained 1.41%. Over the period 2/3/2014 to 7/18/2016 the starting capital of $100,000 would have grown to $9,903 which includes $19,936 cash and excludes $1,325 spent on fees and slippage. |
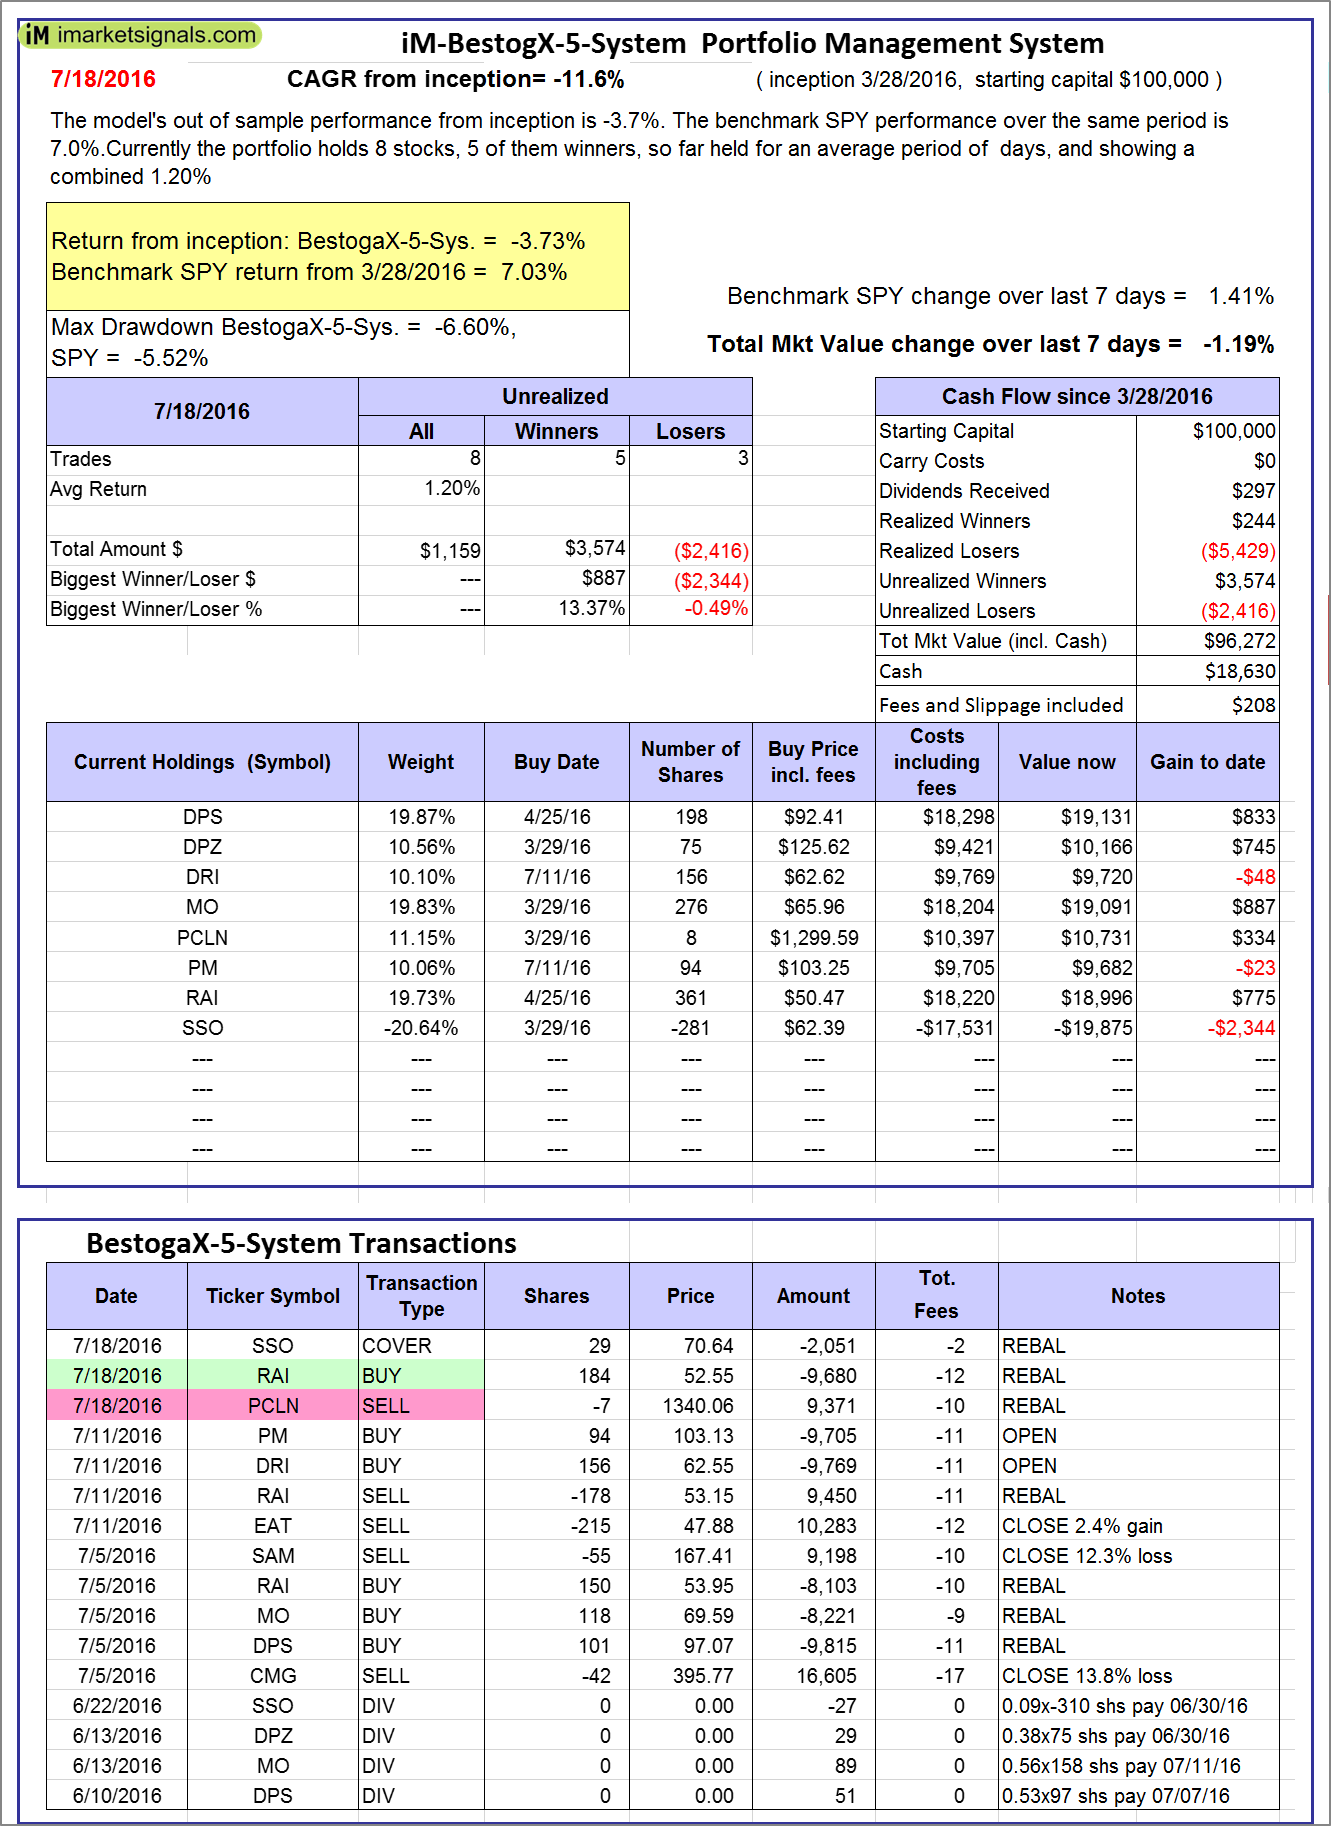 |
iM-BestogaX5-System: The model’s out of sample performance from inception is -3.7%. The benchmark SPY performance over the same period is 7.0%. Over the previous week the market value of iM-Best8(S&P 500)Tax-Eff. gained -1.19% at a time when SPY gained 1.41%. A starting capital of $100,000 at inception on 1/2/2009 would have grown to $96,272 which includes $18,630 cash and excludes $208 spent on fees and slippage. |
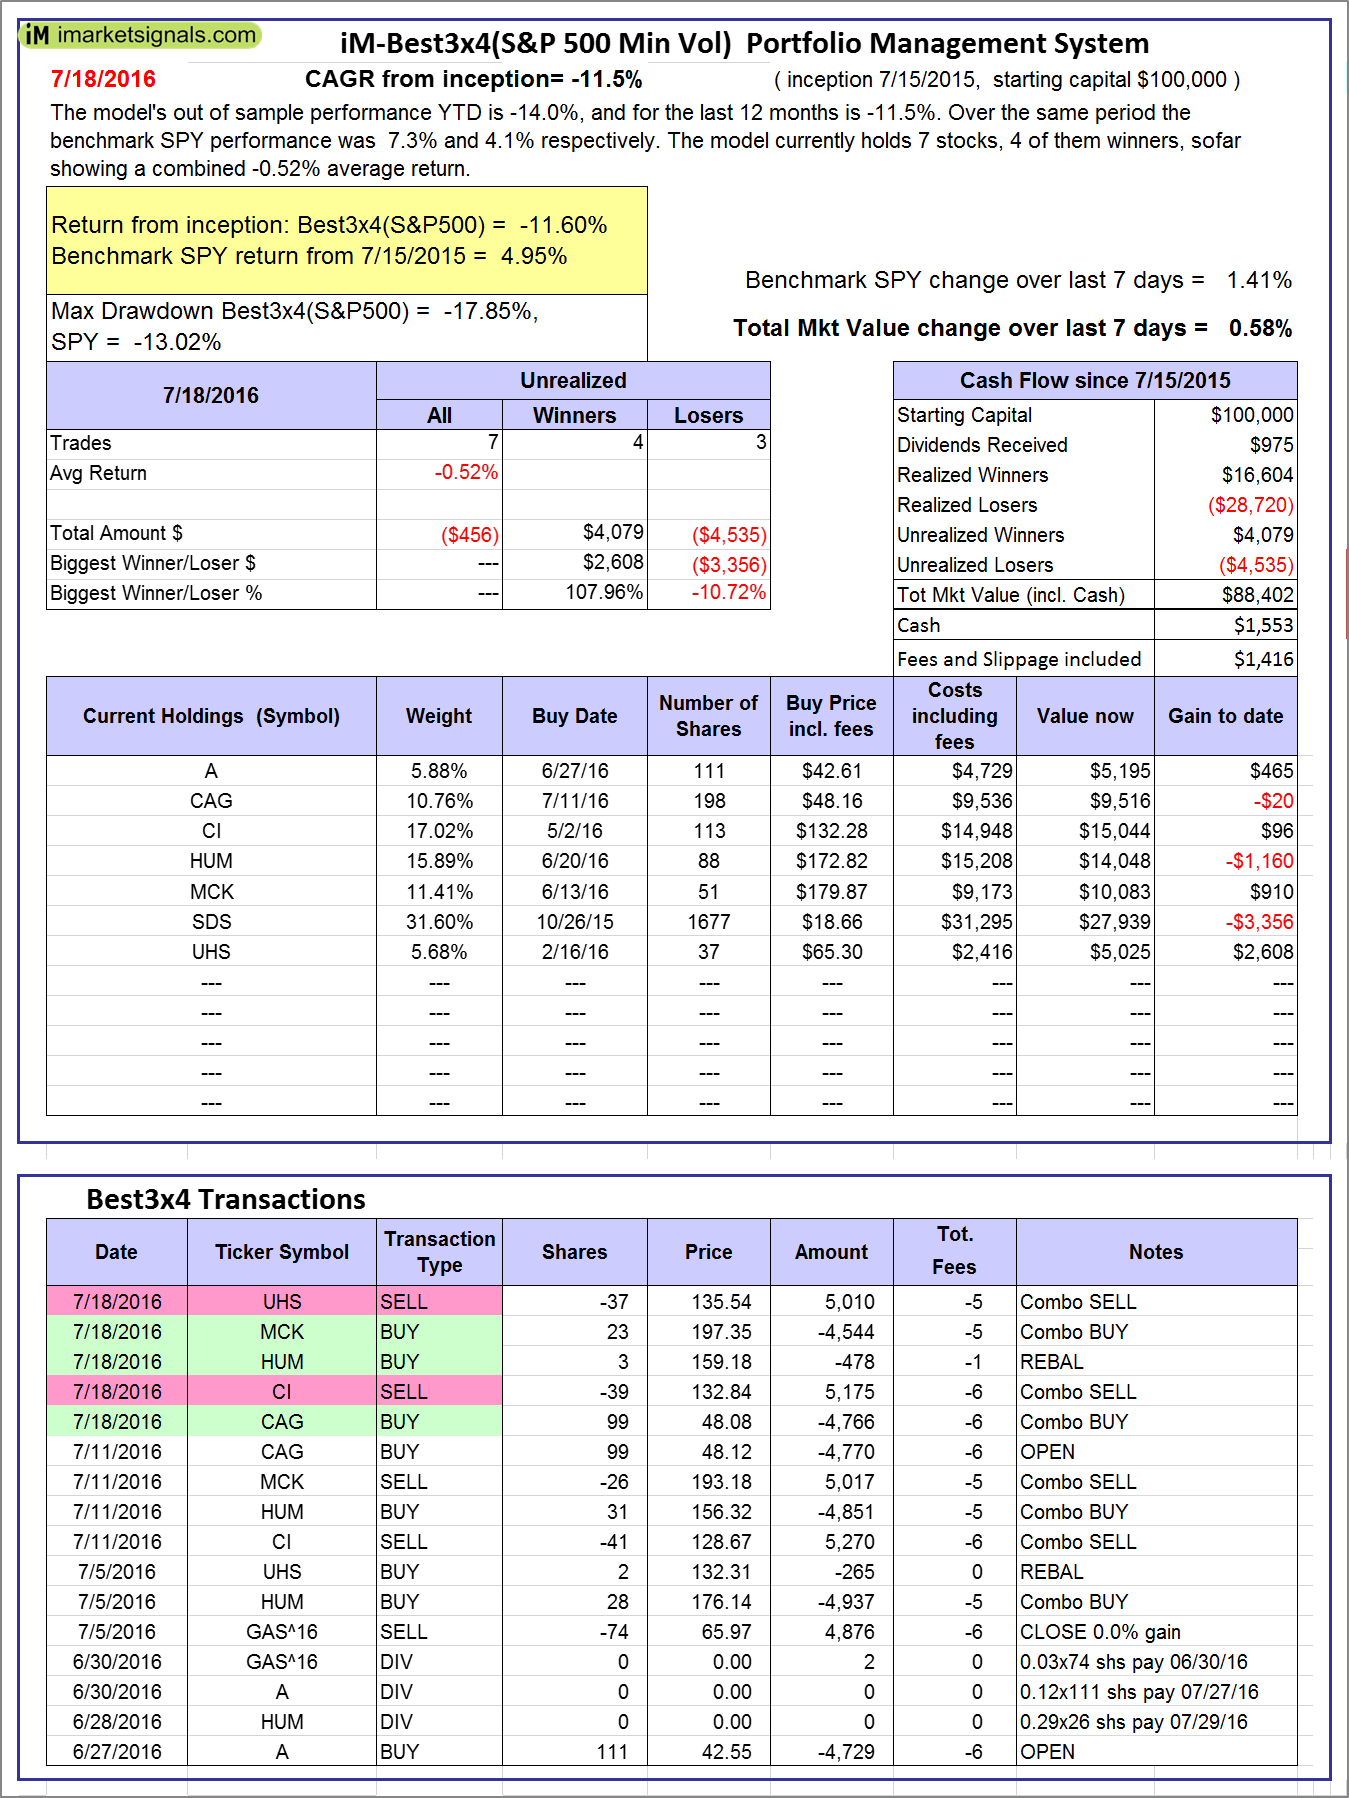 |
iM-Best3x4(S&P 500 Min Vol): The model’s out of sample performance YTD is -14.0%, and for the last 12 months is -11.5%. Over the same period the benchmark SPY performance was 7.3% and 4.1% respectively. Over the previous week the market value of iM-Best3x4 gained 0.58% at a time when SPY gained 1.41%. A starting capital of $100,000 at inception on 7/15/2015 would have grown to $88,402 which includes $1,553 cash and excludes $1,416 spent on fees and slippage. |
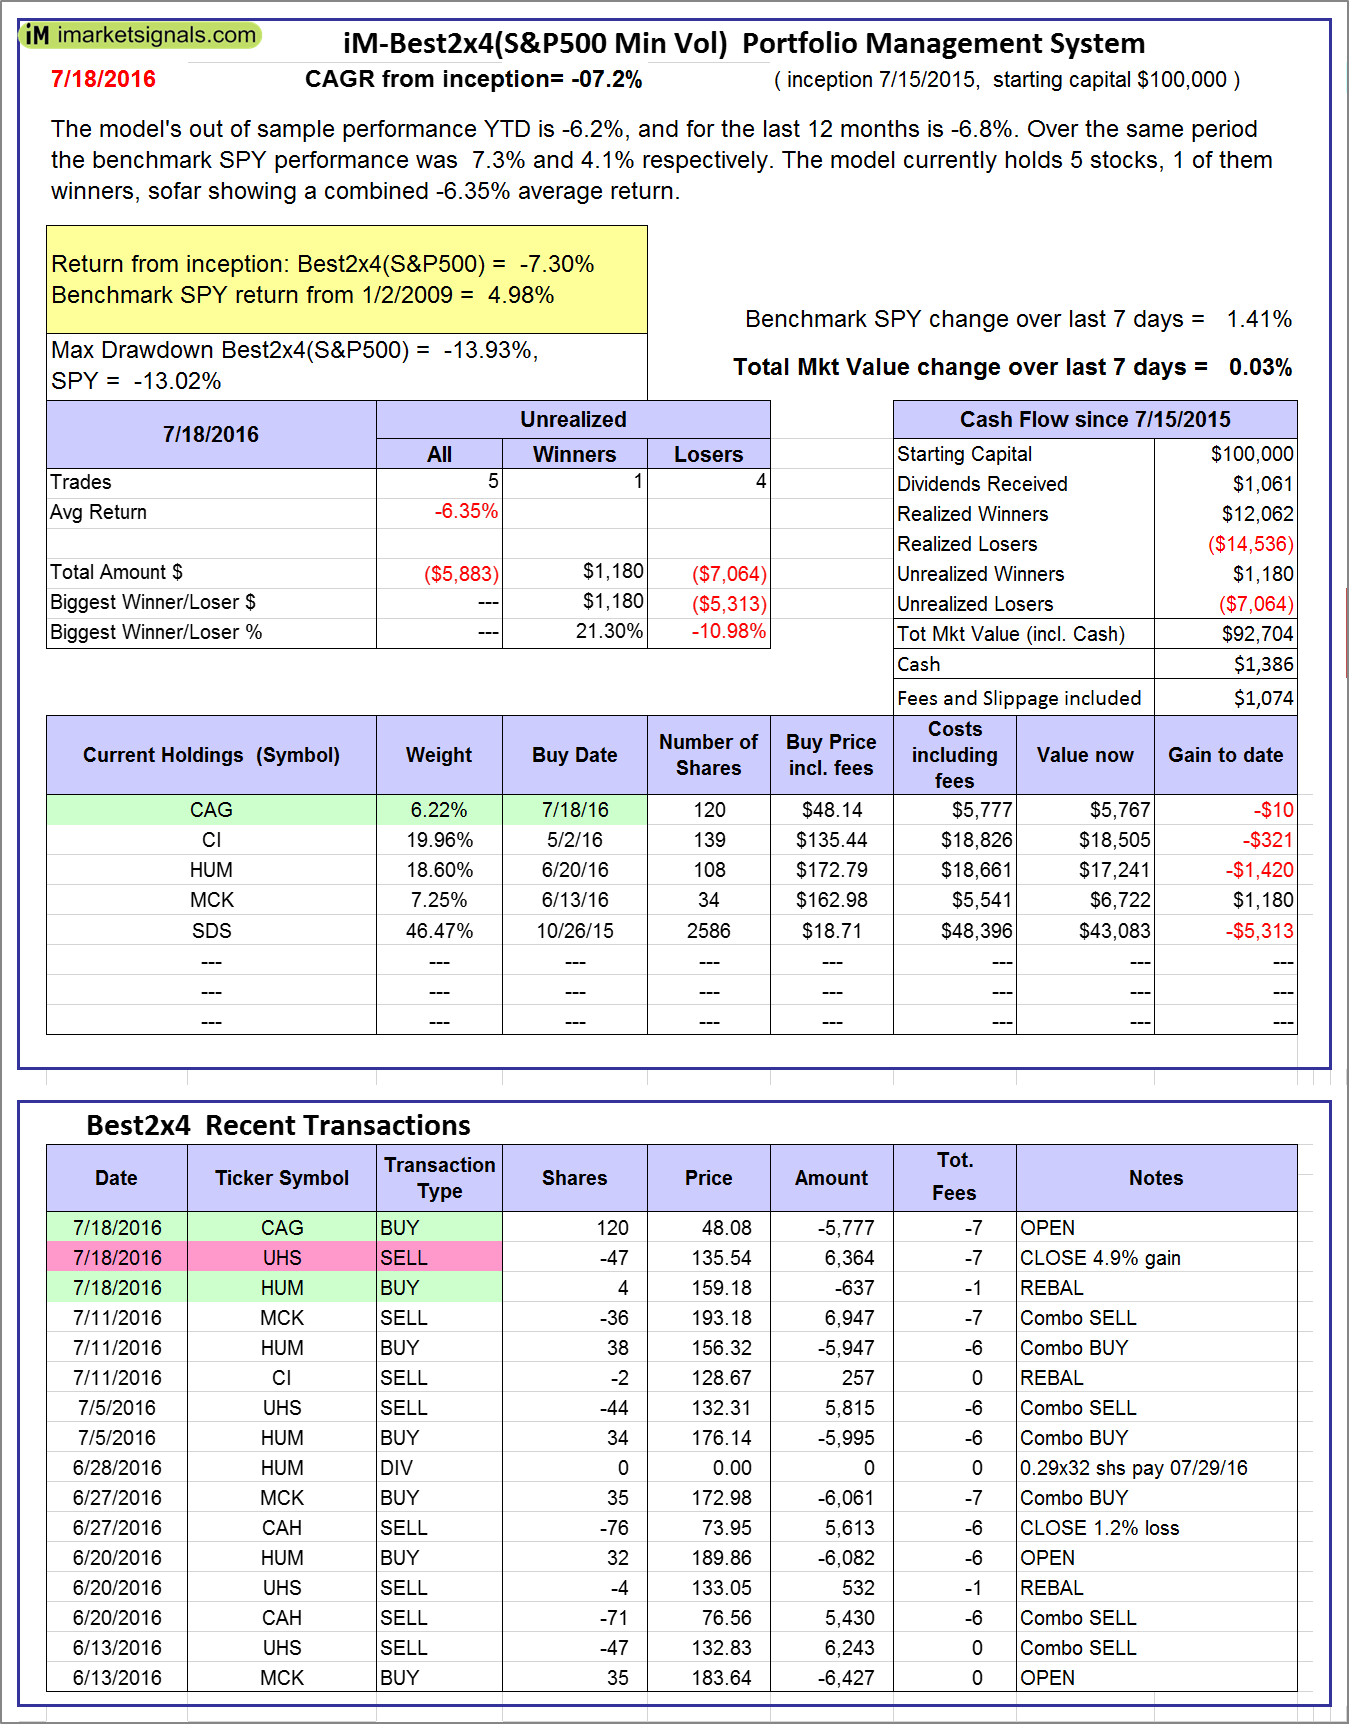 |
iM-Best2x4(S&P 500 Min Vol): The model’s out of sample performance YTD is -6.2%, and for the last 12 months is -6.8%. Over the same period the benchmark SPY performance was 7.3% and 4.1% respectively. Over the previous week the market value of iM-Best2x4 gained 0.03% at a time when SPY gained 1.41%. A starting capital of $100,000 at inception on 7/16/2015 would have grown to $92,704 which includes $1,386 cash and excludes $1,074 spent on fees and slippage. |
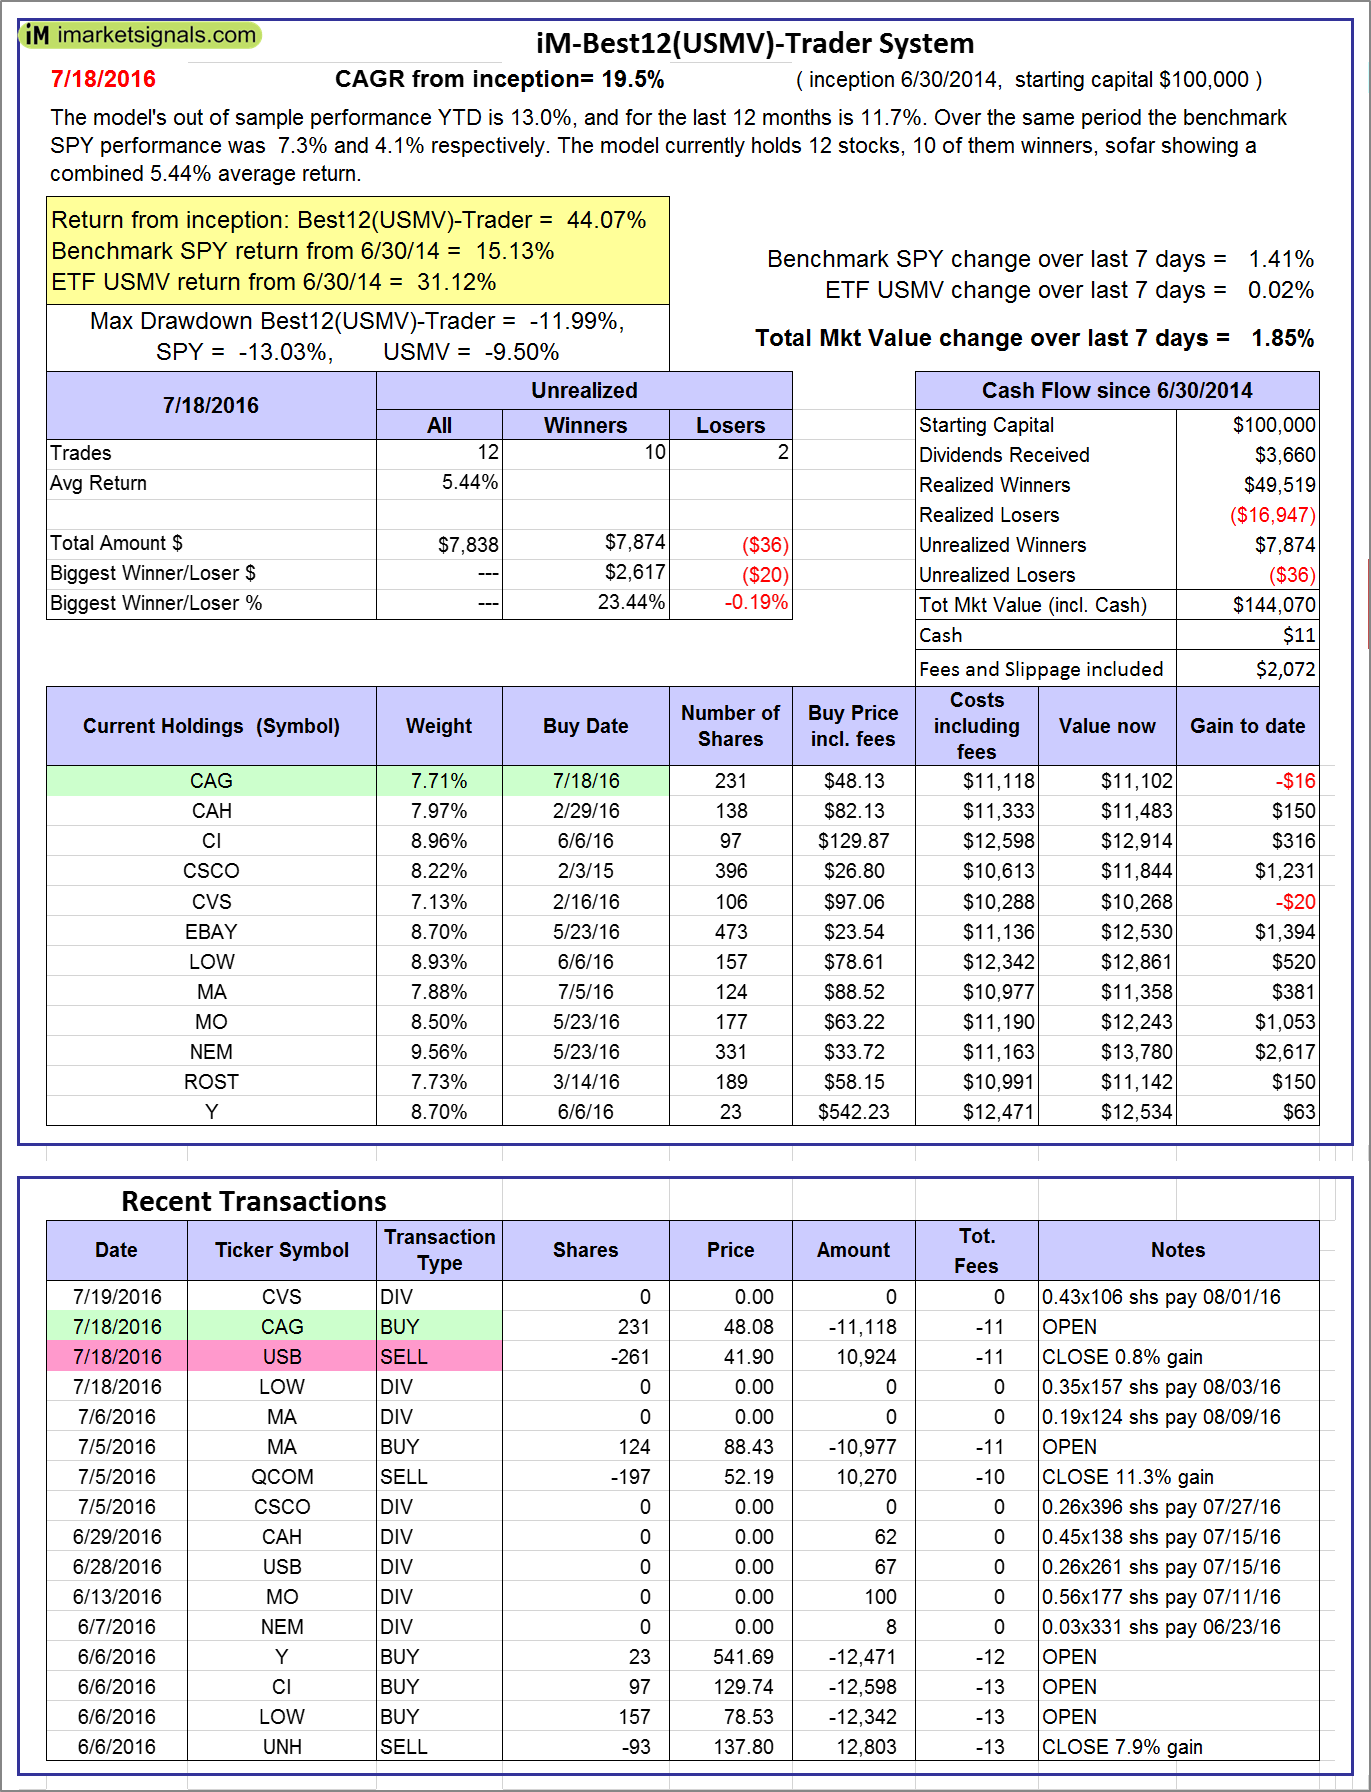  |
iM-Best12(USMV)-Trader: The model’s out of sample performance YTD is 13.0%, and for the last 12 months is 11.7%. Over the same period the benchmark SPY performance was 7.3% and 4.1% respectively. Since inception, on 7/1/2014, the model gained 44.07% while the benchmark SPY gained 15.13% and the ETF USMV gained 31.12% over the same period. Over the previous week the market value of iM-Best12(USMV)-Trader gained 1.85% at a time when SPY gained 1.41%. A starting capital of $100,000 at inception on 7/1/2014 would have grown to $144,070 which includes $11 cash and excludes $2,072 spent on fees and slippage. |
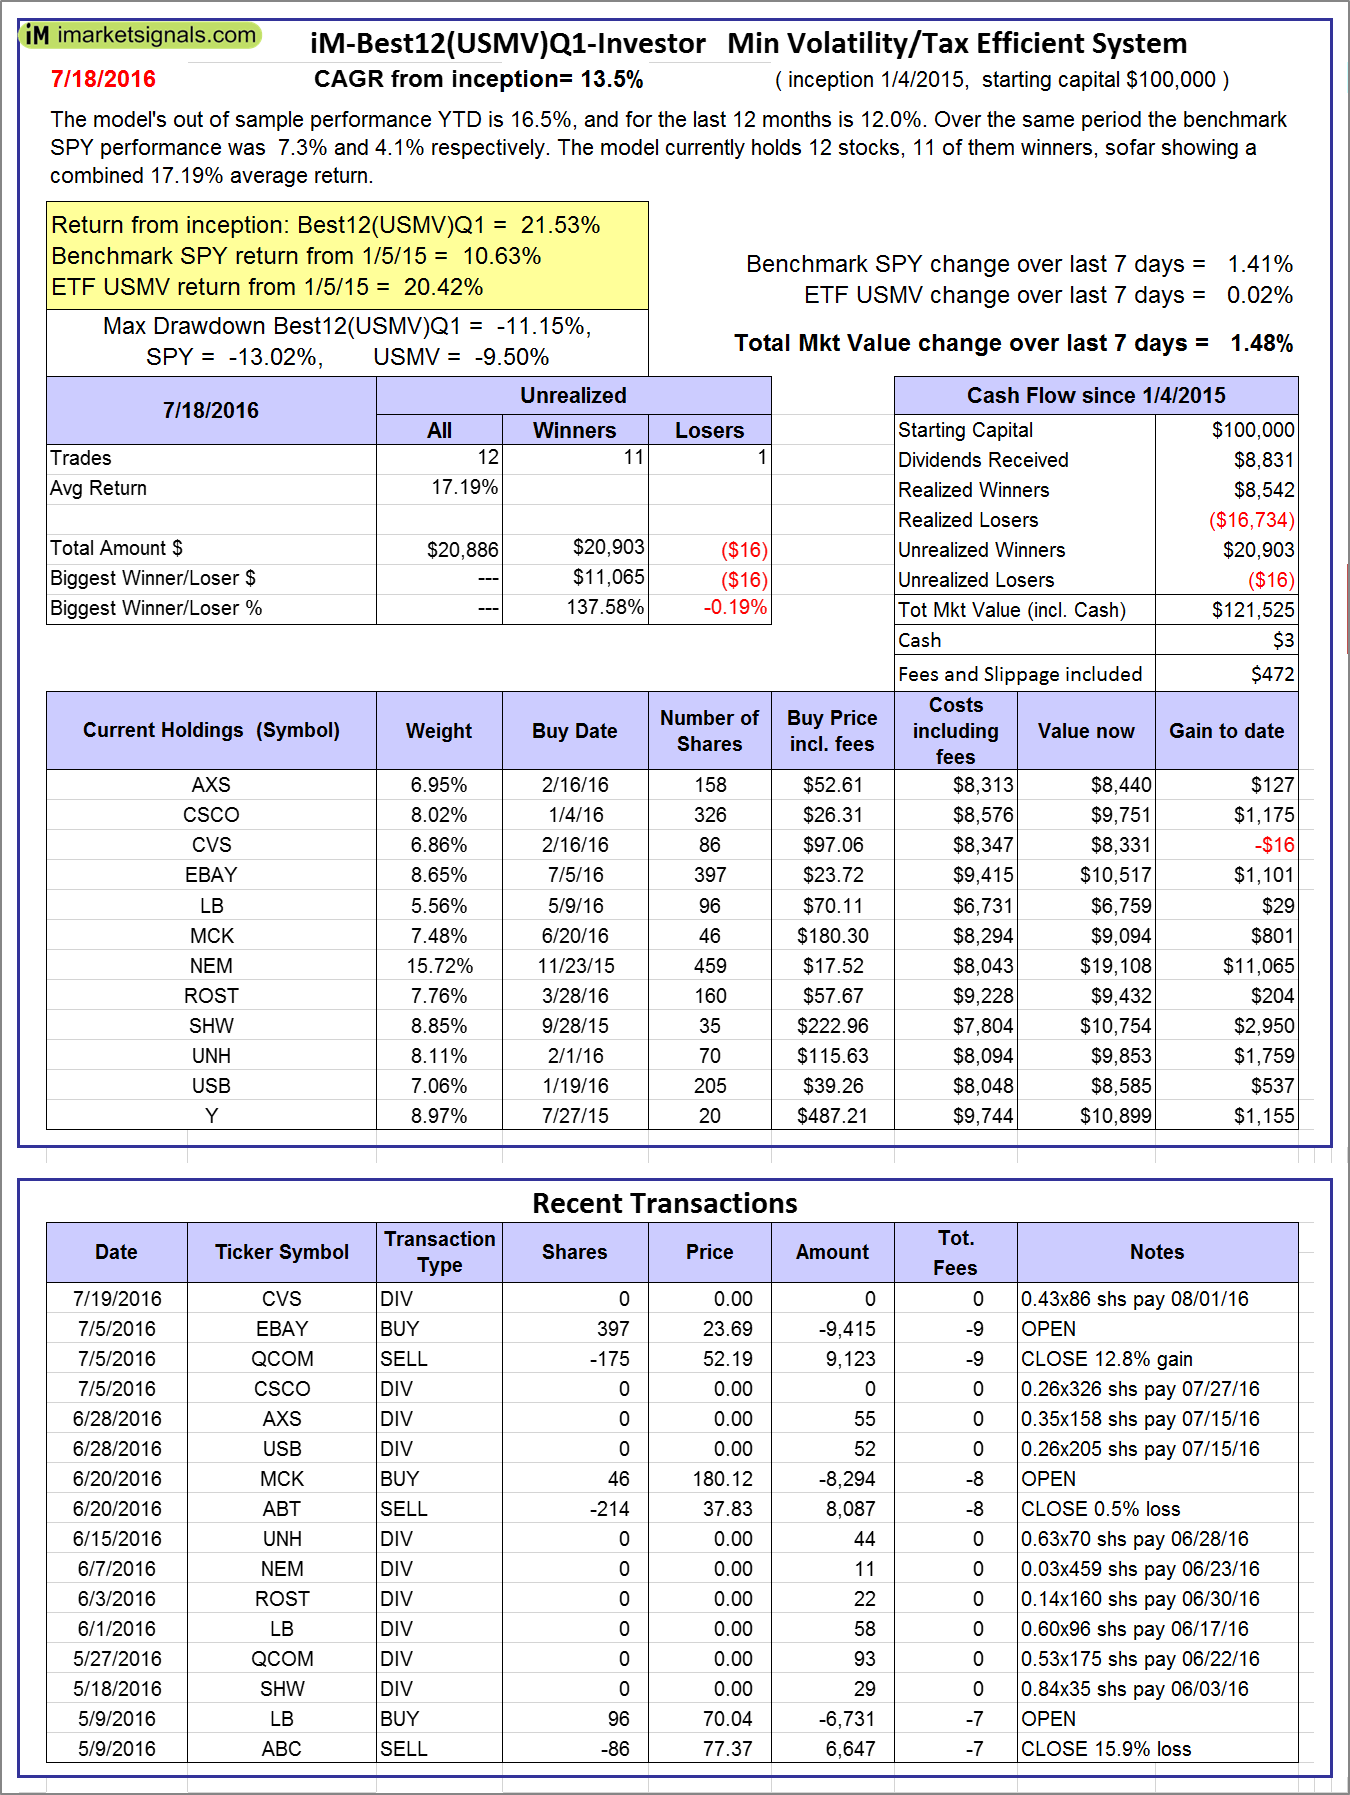 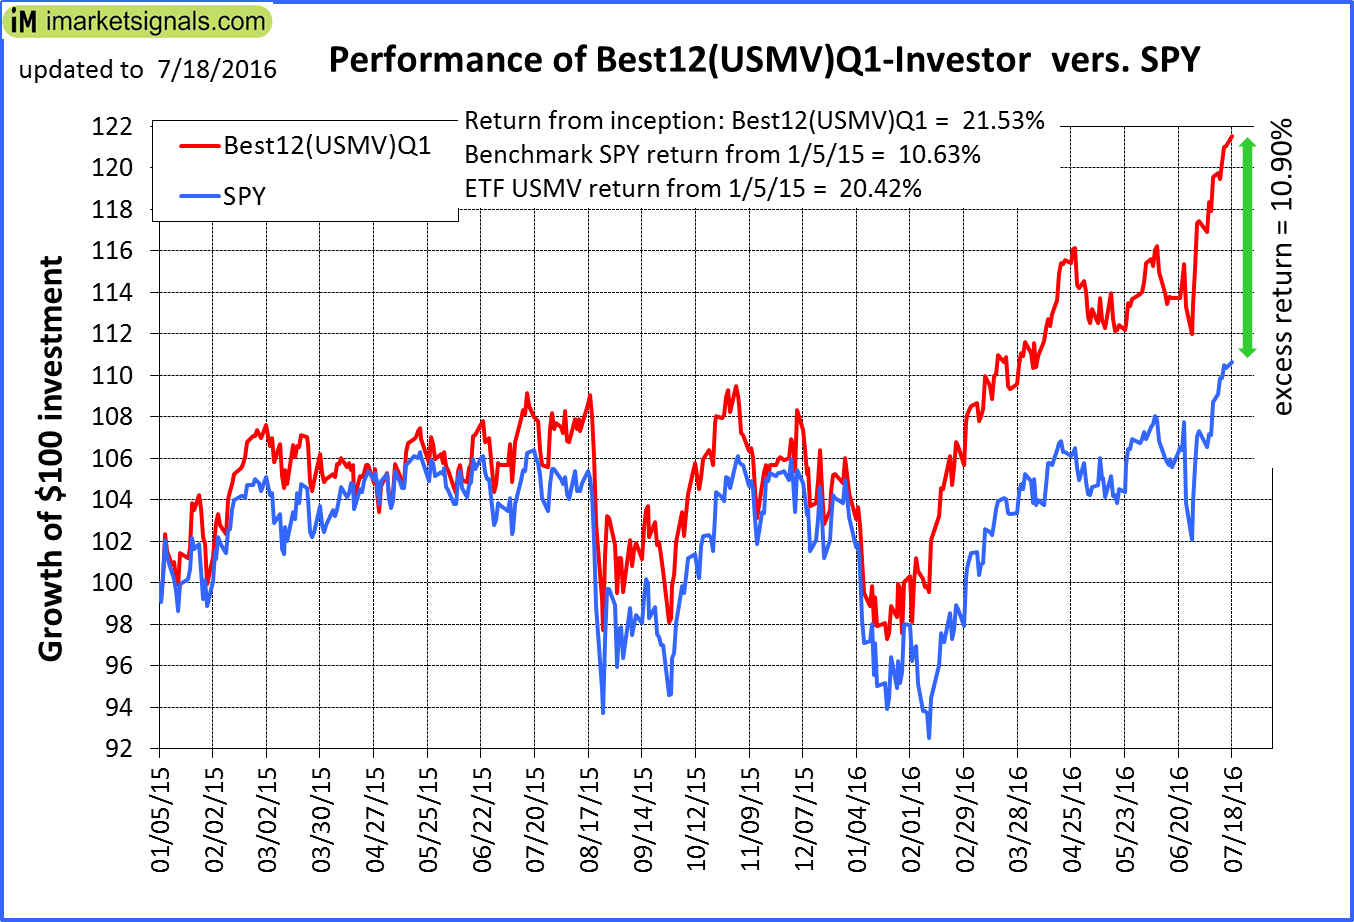 |
iM-Best12(USMV)Q1-Investor: The model’s out of sample performance YTD is 16.5%, and for the last 12 months is 12.0%. Over the same period the benchmark SPY performance was 7.3% and 4.1% respectively. Since inception, on 1/5/2015, the model gained 21.53% while the benchmark SPY gained 10.63% and the ETF USMV gained 20.42% over the same period. Over the previous week the market value of iM-Best12(USMV)Q1 gained 1.48% at a time when SPY gained 1.41%. A starting capital of $100,000 at inception on 1/5/2015 would have grown to $121,525 which includes $3 cash and excludes $472 spent on fees and slippage. |
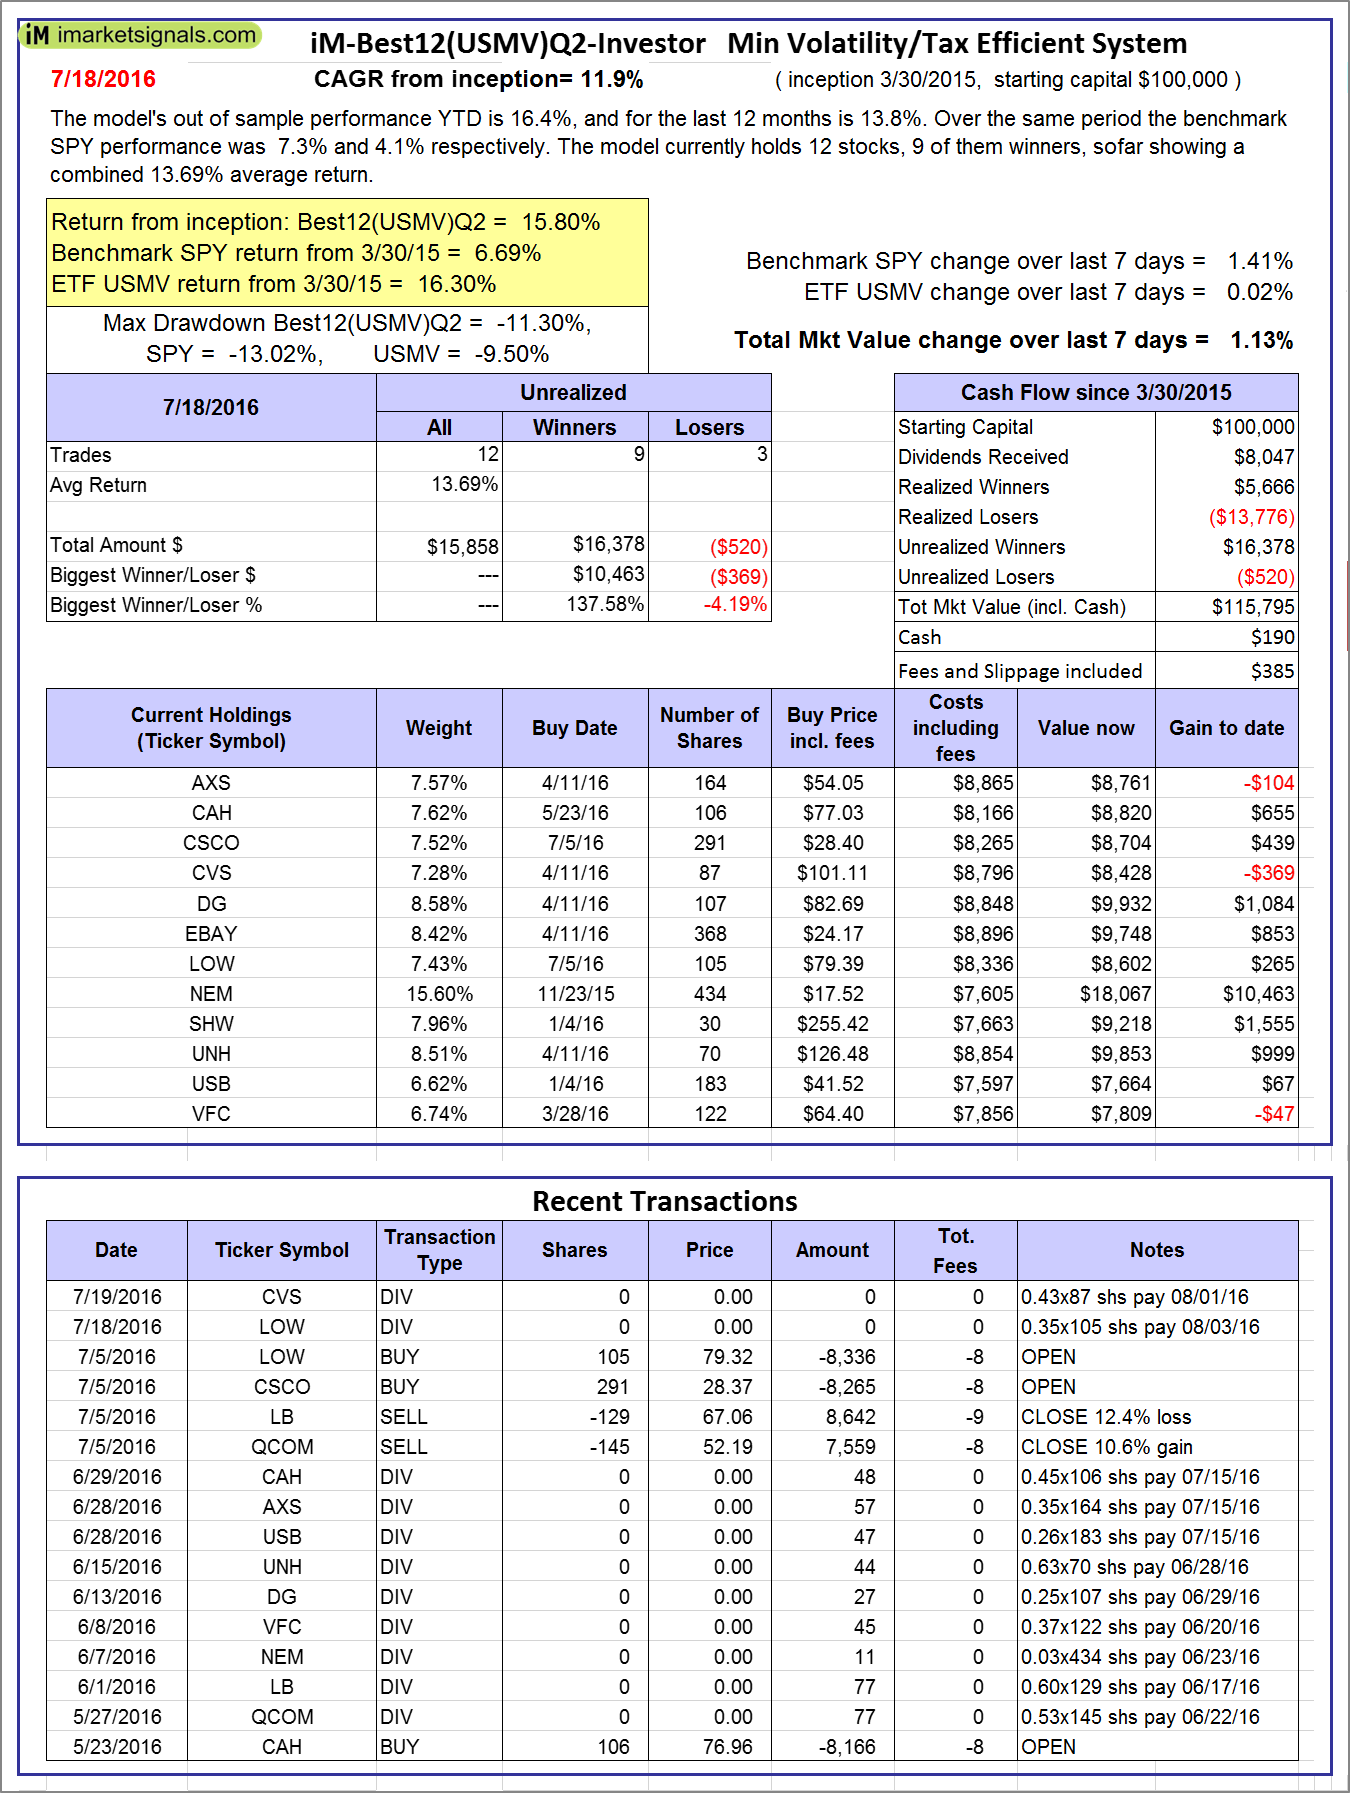 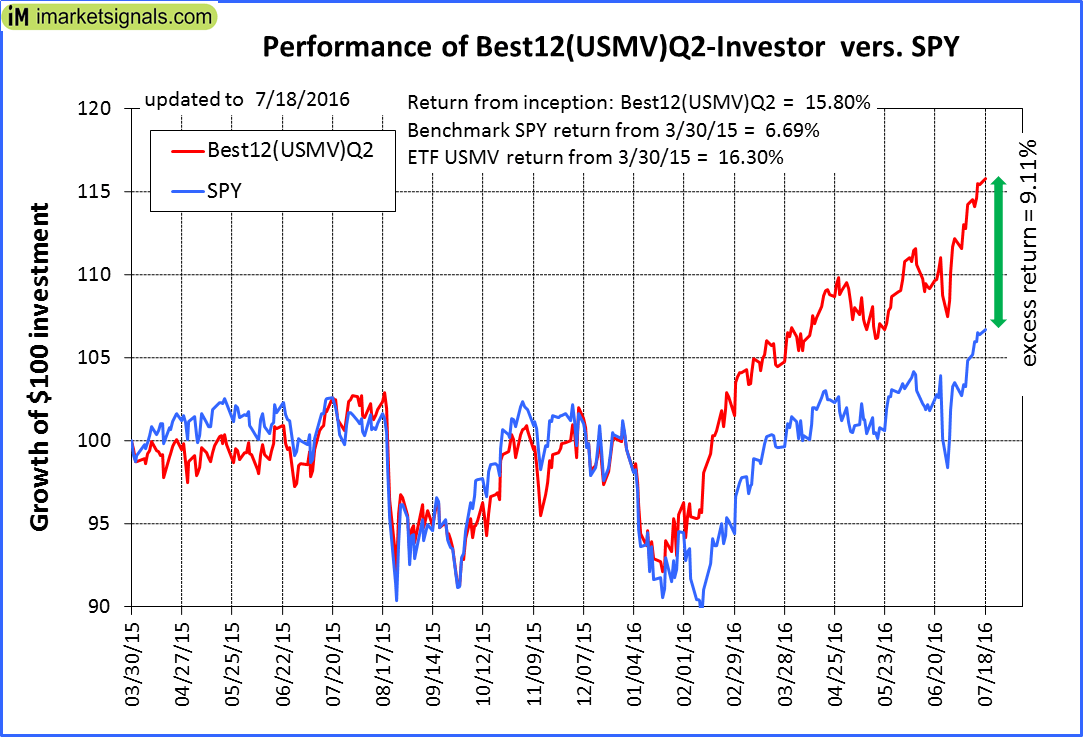 |
iM-Best12(USMV)Q2-Investor: The model’s out of sample performance YTD is 16.4%, and for the last 12 months is 13.8%. Over the same period the benchmark SPY performance was 7.3% and 4.1% respectively. Since inception, on 3/31/2015, the model gained 15.80% while the benchmark SPY gained 6.69% and the ETF USMV gained 16.30% over the same period. Over the previous week the market value of iM-Best12(USMV)Q2 gained 1.13% at a time when SPY gained 1.41%. A starting capital of $100,000 at inception on 3/31/2015 would have grown to $115,795 which includes $190 cash and excludes $385 spent on fees and slippage. |
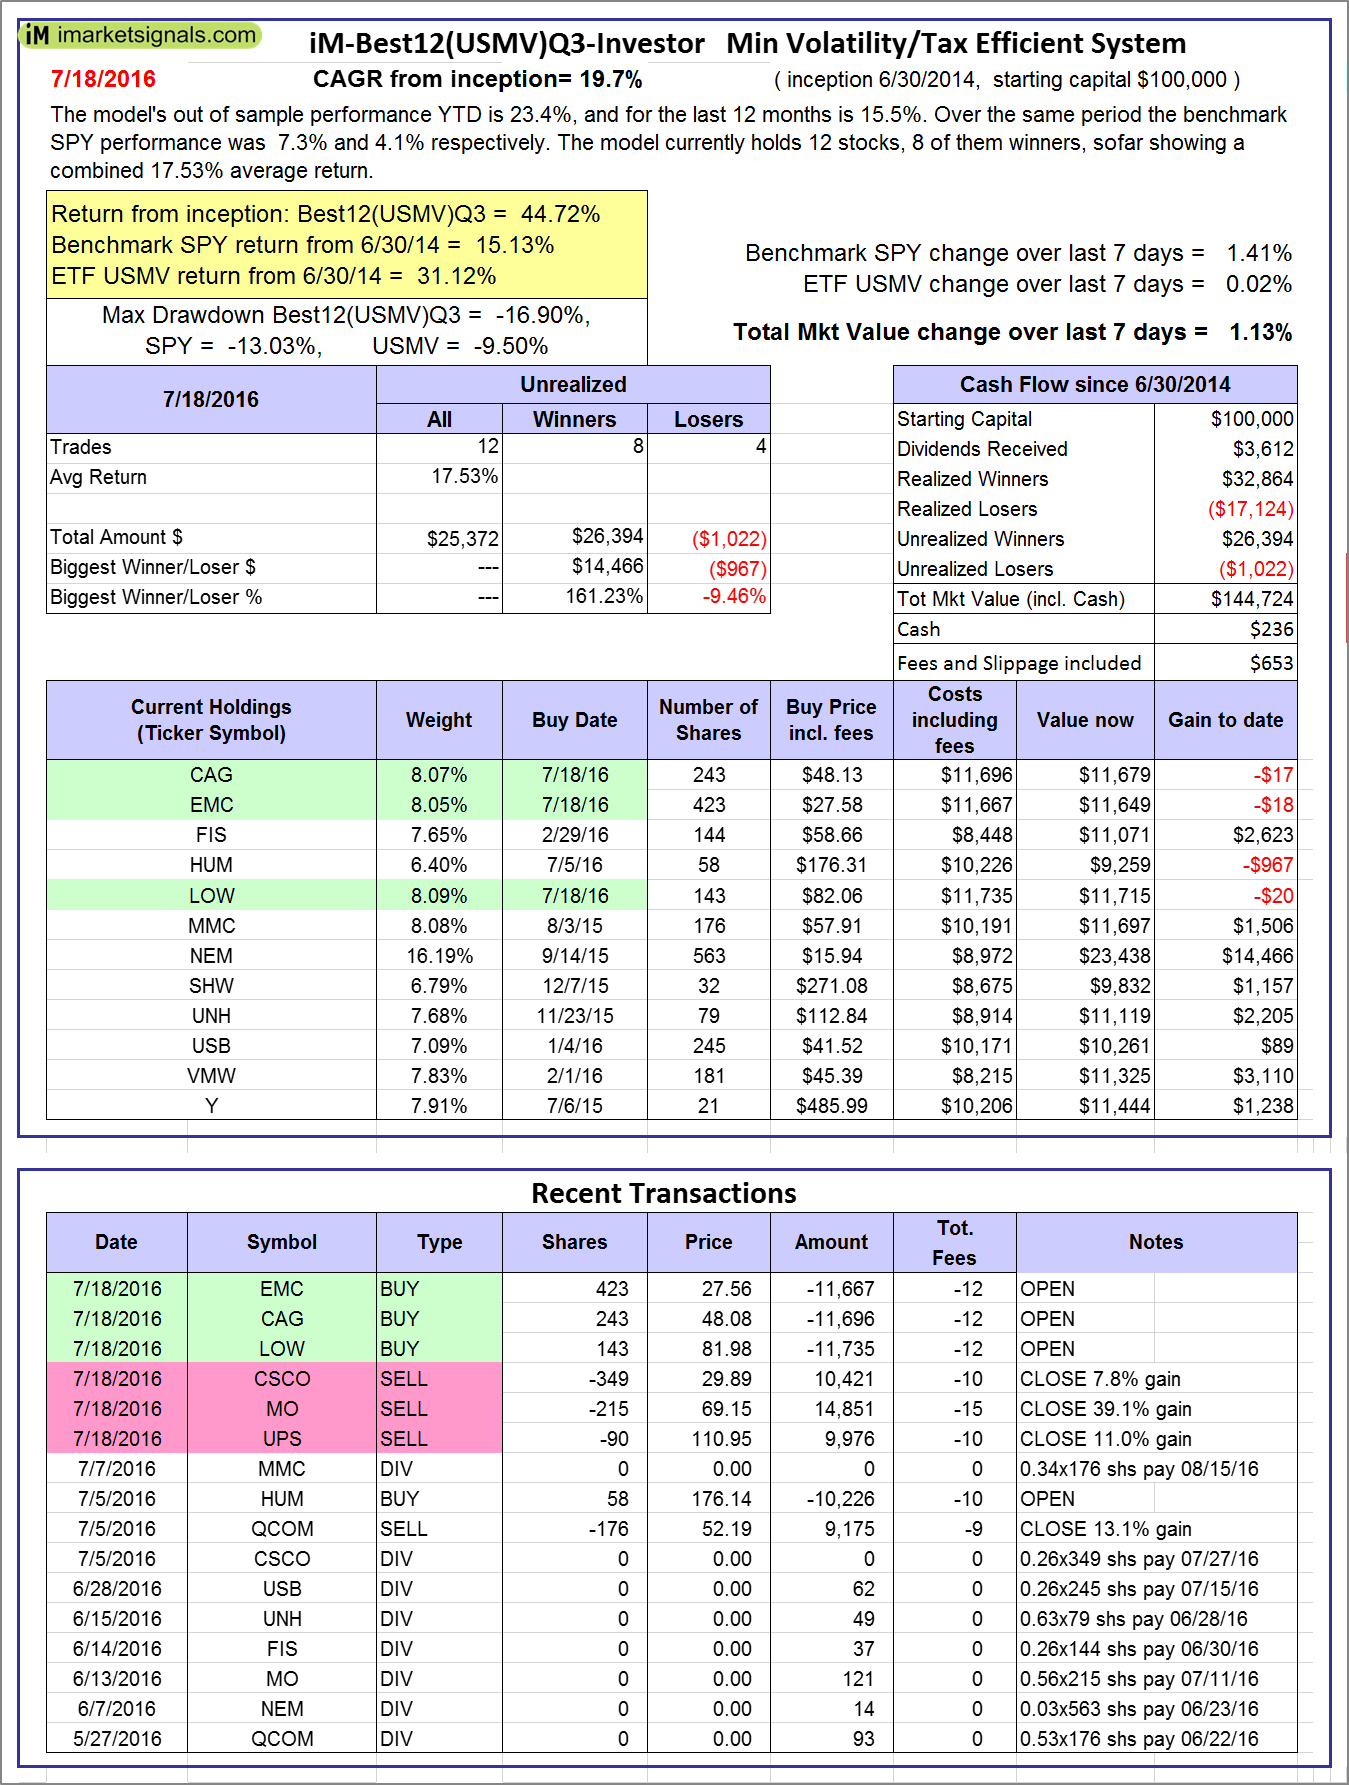 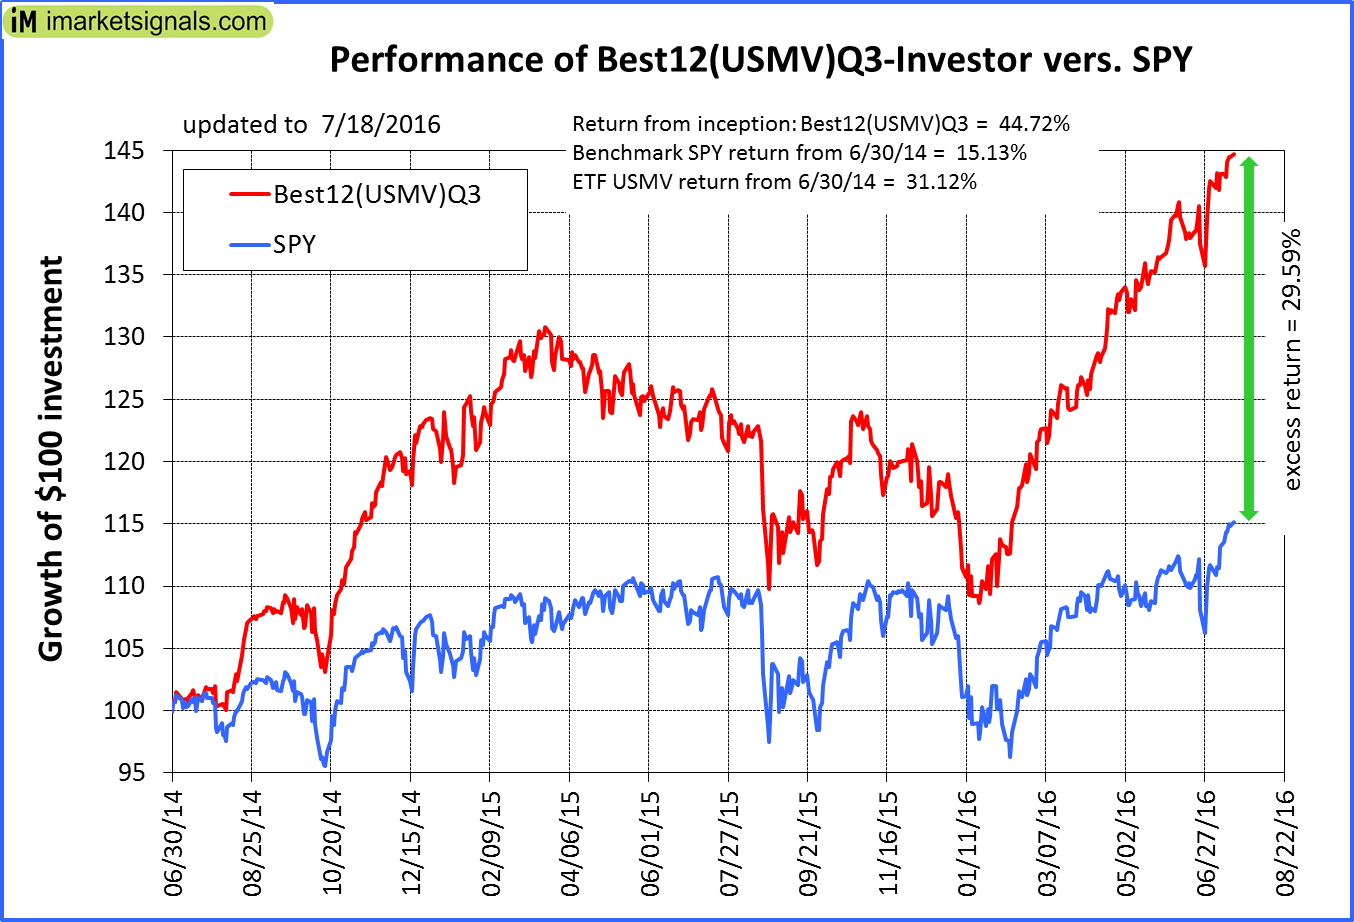 |
iM-Best12(USMV)Q3-Investor: The model’s out of sample performance YTD is 23.4%, and for the last 12 months is 15.5%. Over the same period the benchmark SPY performance was 7.3% and 4.1% respectively. Since inception, on 7/1/2014, the model gained 44.72% while the benchmark SPY gained 15.13% and the ETF USMV gained 31.12% over the same period. Over the previous week the market value of iM-Best12(USMV)Q3 gained 1.13% at a time when SPY gained 1.41%. A starting capital of $100,000 at inception on 7/1/2014 would have grown to $144,724 which includes $236 cash and excludes $653 spent on fees and slippage. |
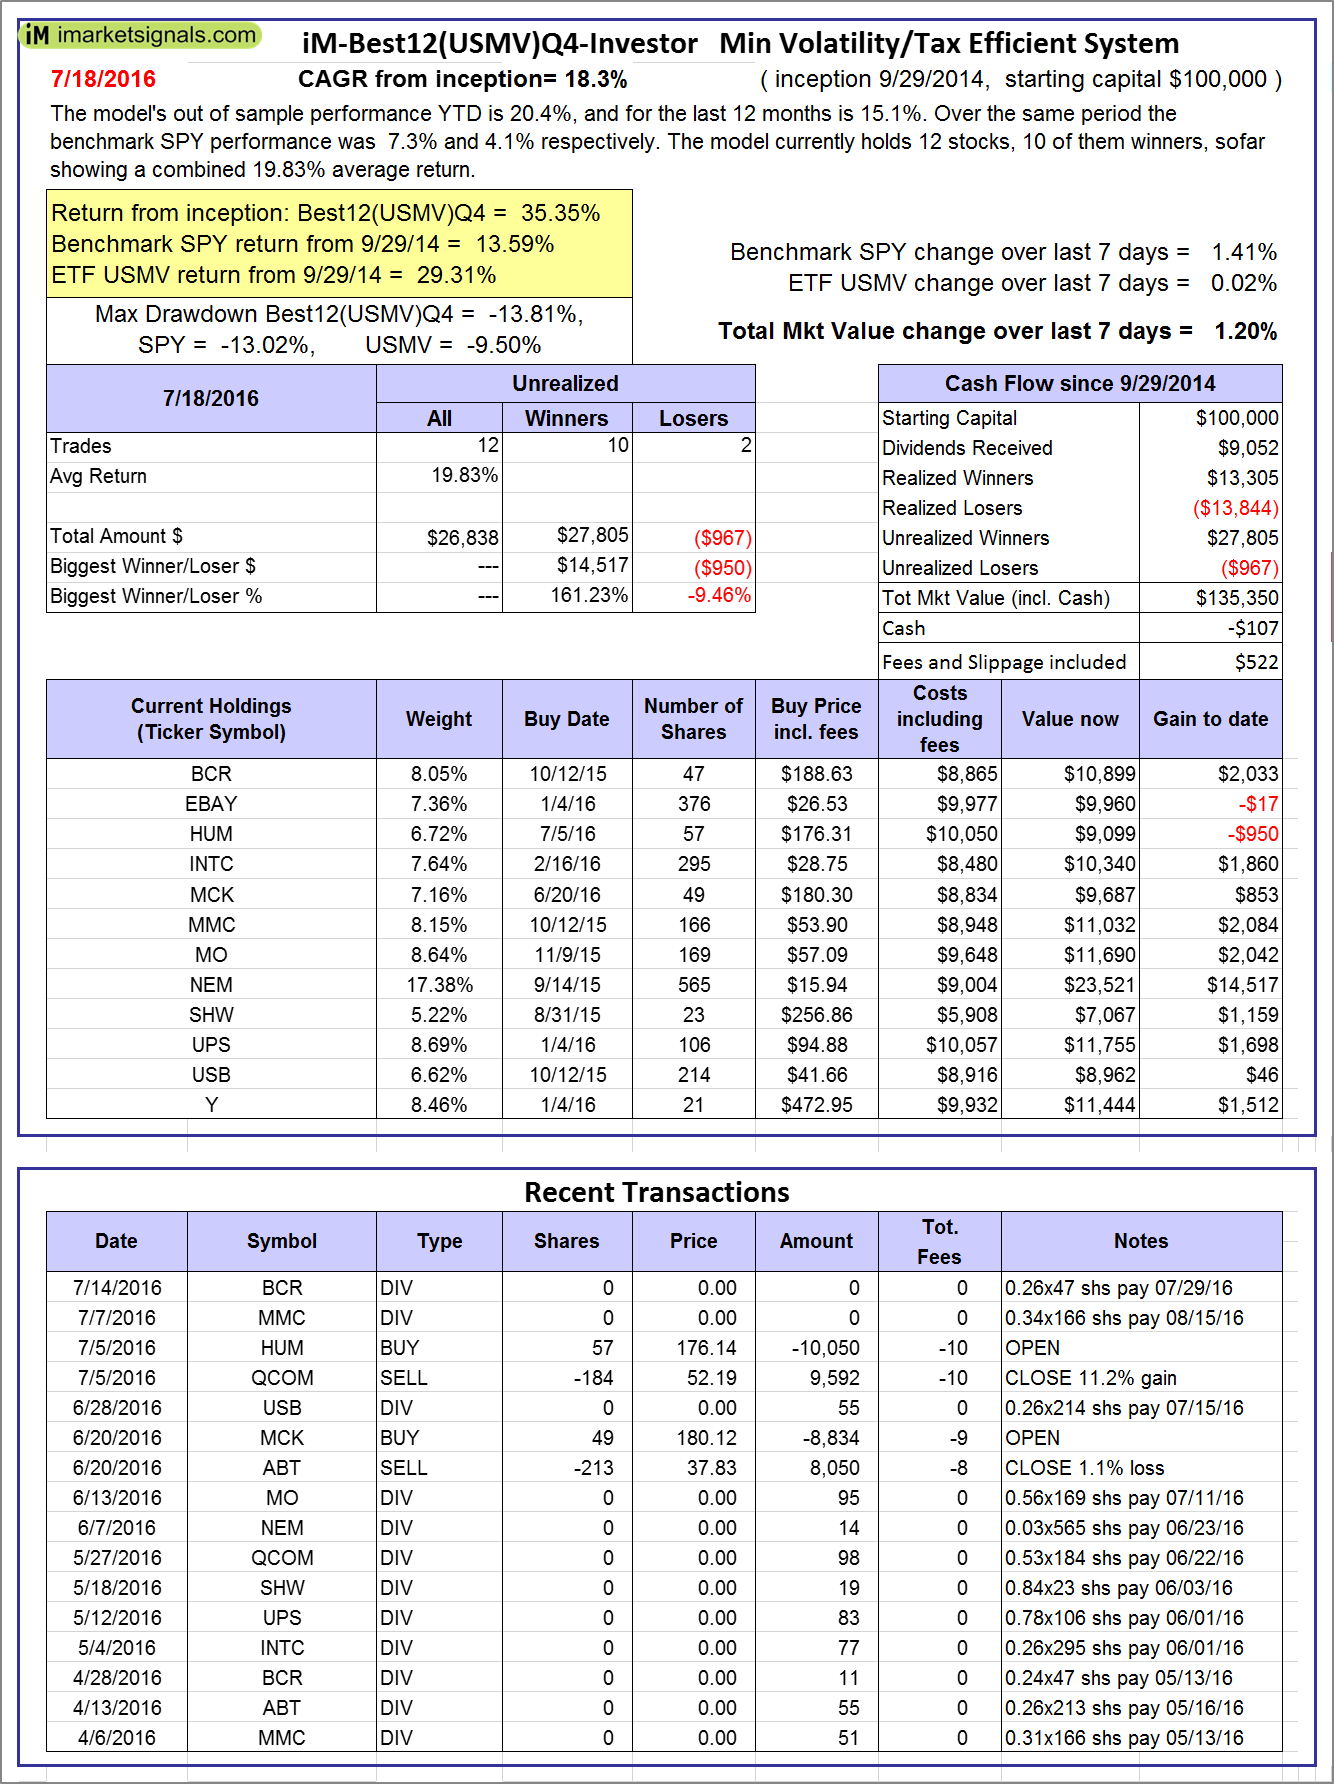 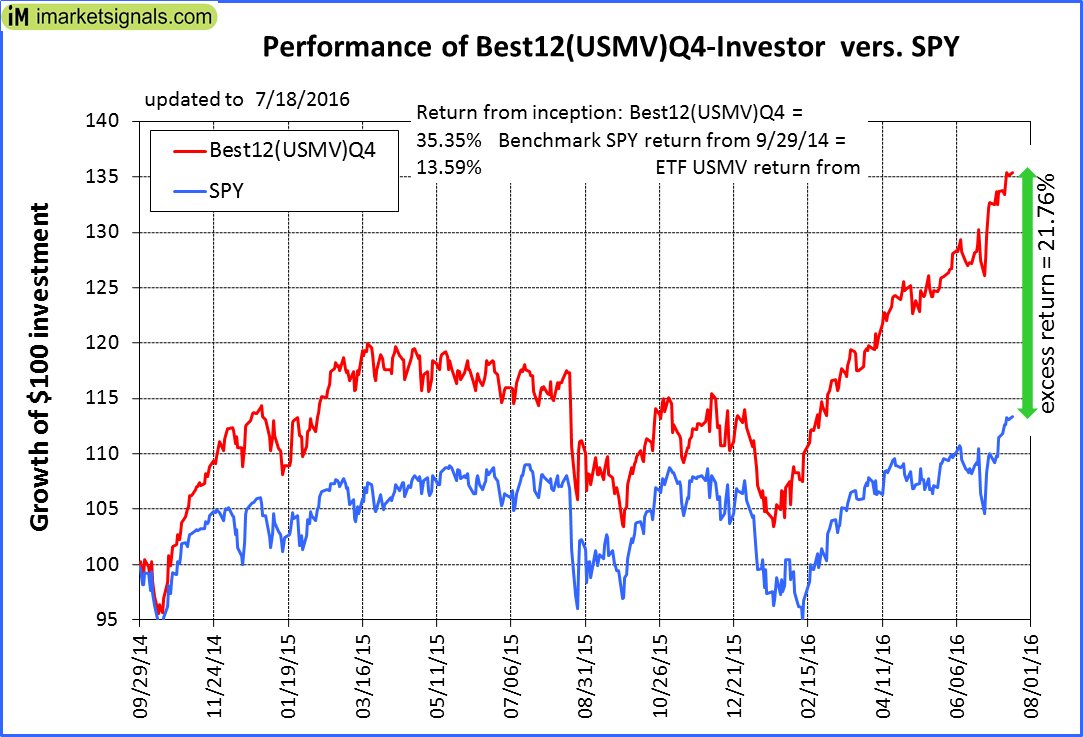 |
iM-Best12(USMV)Q4-Investor: Since inception, on 9/30/2014, the model gained 35.35% while the benchmark SPY gained 13.59% and the ETF USMV gained 29.31% over the same period. Over the previous week the market value of iM-Best12(USMV)Q4 gained 1.20% at a time when SPY gained 1.41%. A starting capital of $100,000 at inception on 9/30/2014 would have grown to $135,350 which includes -$107 cash and excludes $522 spent on fees and slippage. |
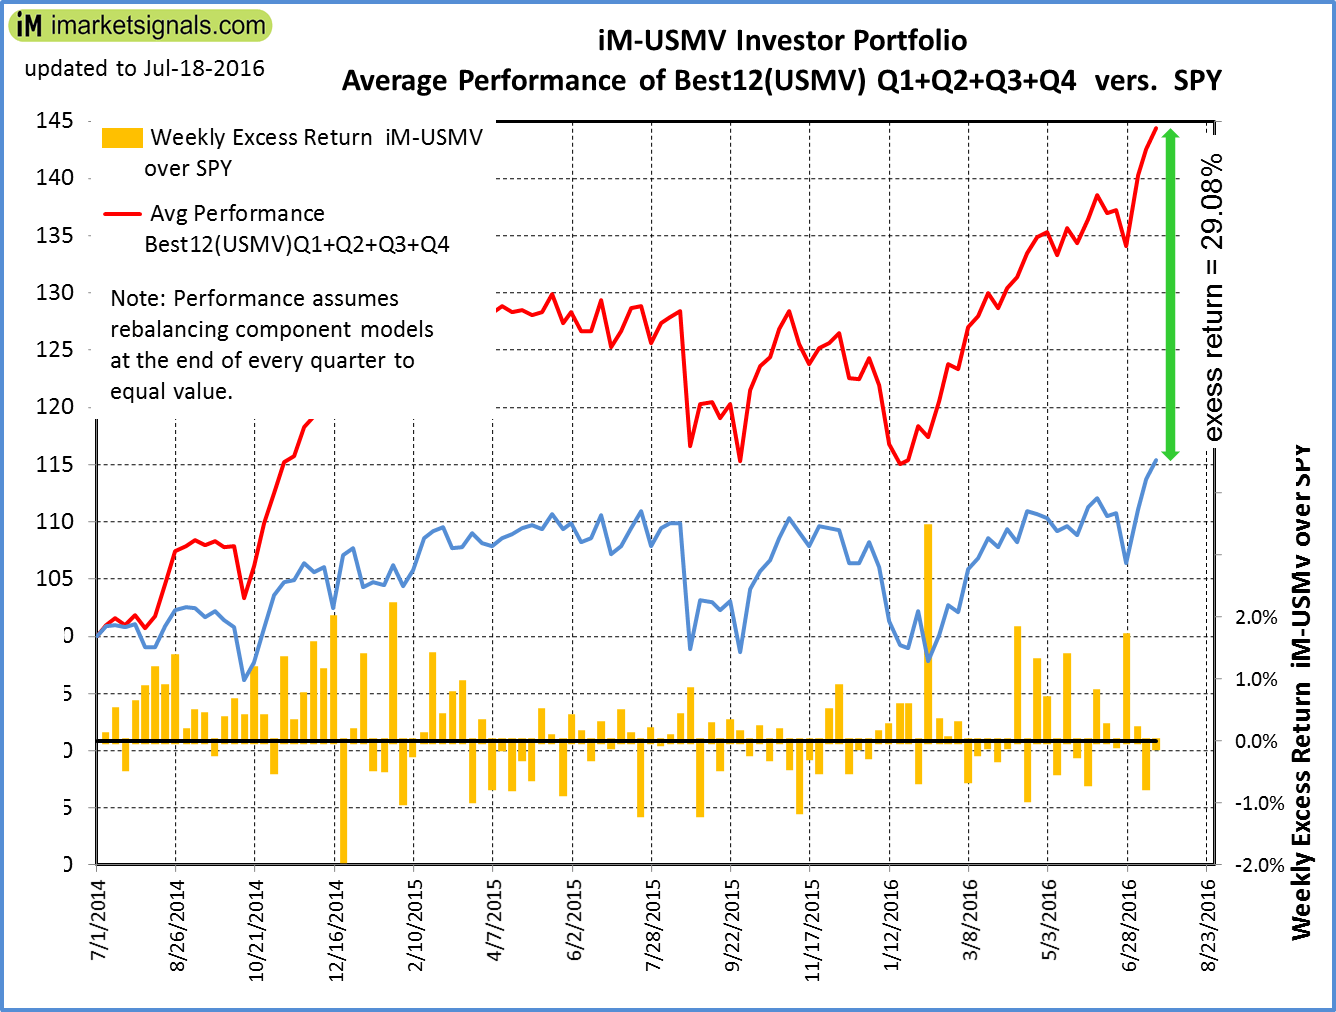 |
Average Performance of iM-Best12(USMV)Q1+Q2+Q3+Q4-Investor resulted in an excess return of 29.08% over SPY. (see iM-USMV Investor Portfolio) |
 |
iM-Best(Short): The model’s out of sample performance YTD is -6.4%, and for the last 12 months is -3.9%. Over the same period the benchmark SPY performance was 7.3% and 4.1% respectively. Over the previous week the market value of iM-Best(Short) gained 0.35% at a time when SPY gained 1.41%. Over the period 1/2/2009 to 7/18/2016 the starting capital of $100,000 would have grown to $97,952 which includes $97,952 cash and excludes $19,466 spent on fees and slippage. |
iM-Best Reports – 7/11/2016
Posted in pmp SPY-SH
Leave a Reply
You must be logged in to post a comment.