
  |
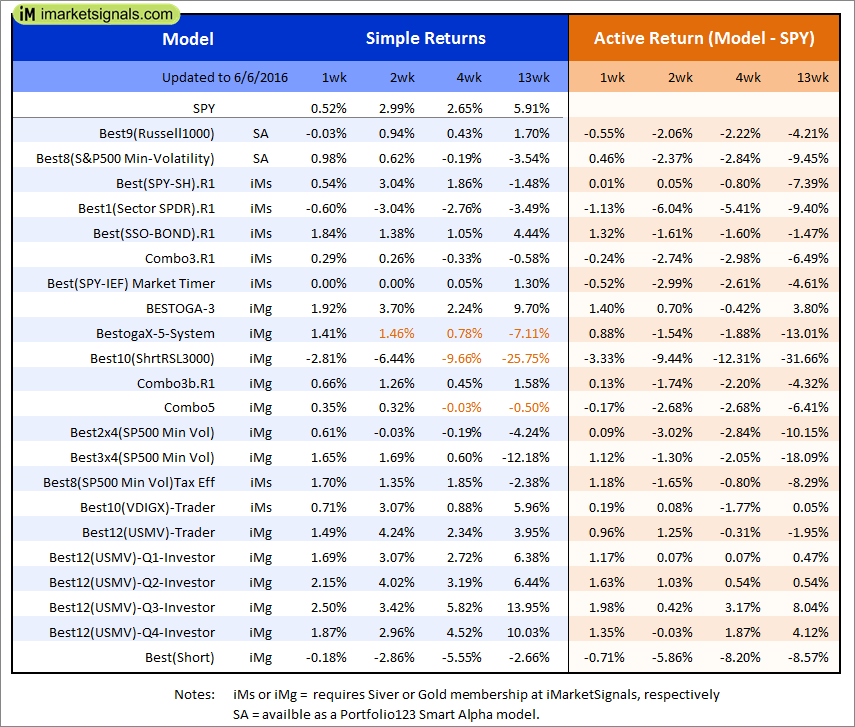
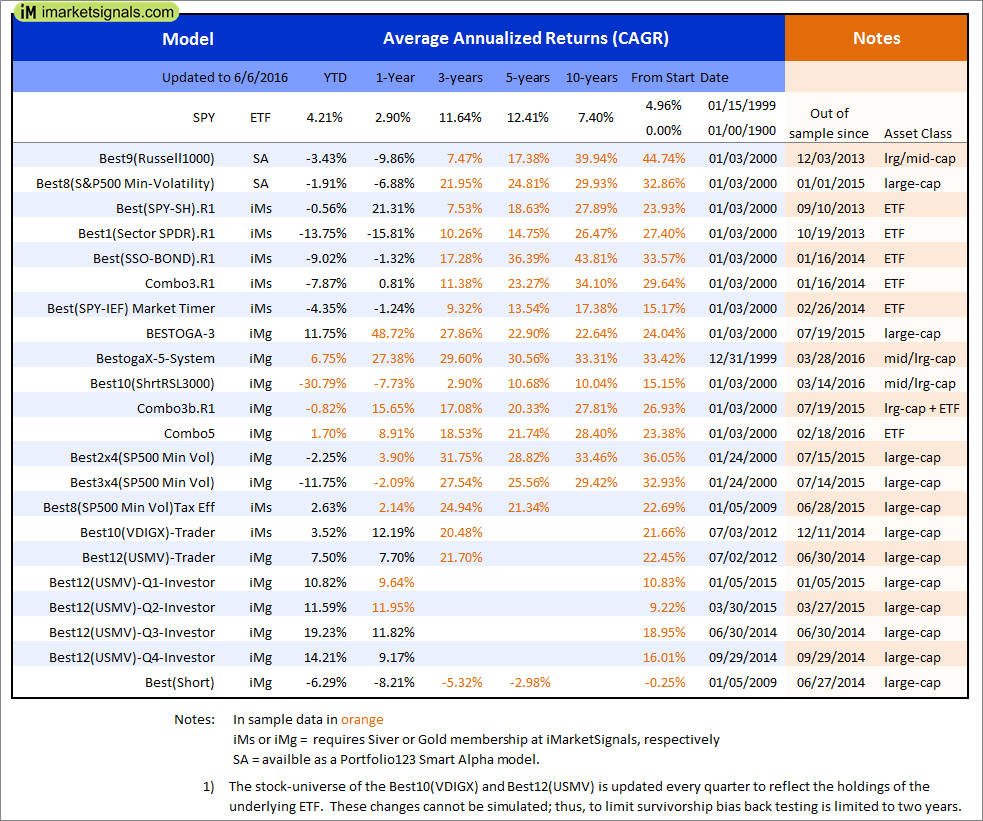
Out of sample performance summary of our models for the past 1, 2, 4 and 13 week periods. The active active return indicates how the models over- or underperformed the benchmark ETF SPY. Also the YTD, and the 1-, 3-, 5- and 10-year annualized returns are shown in the second table |
 |
iM-Best(SPY-SH).R1: The model’s out of sample performance YTD is -0.6%, and for the last 12 months is 21.4%. Over the same period the benchmark SPY performance was 4.2% and 2.9% respectively. Over the previous week the market value of Best(SPY-SH) gained 0.73% at a time when SPY gained 0.72%. A starting capital of $100,000 at inception on 1/2/2009 would have grown to $432,394 which includes -$7,214 cash and excludes $15,358 spent on fees and slippage. |
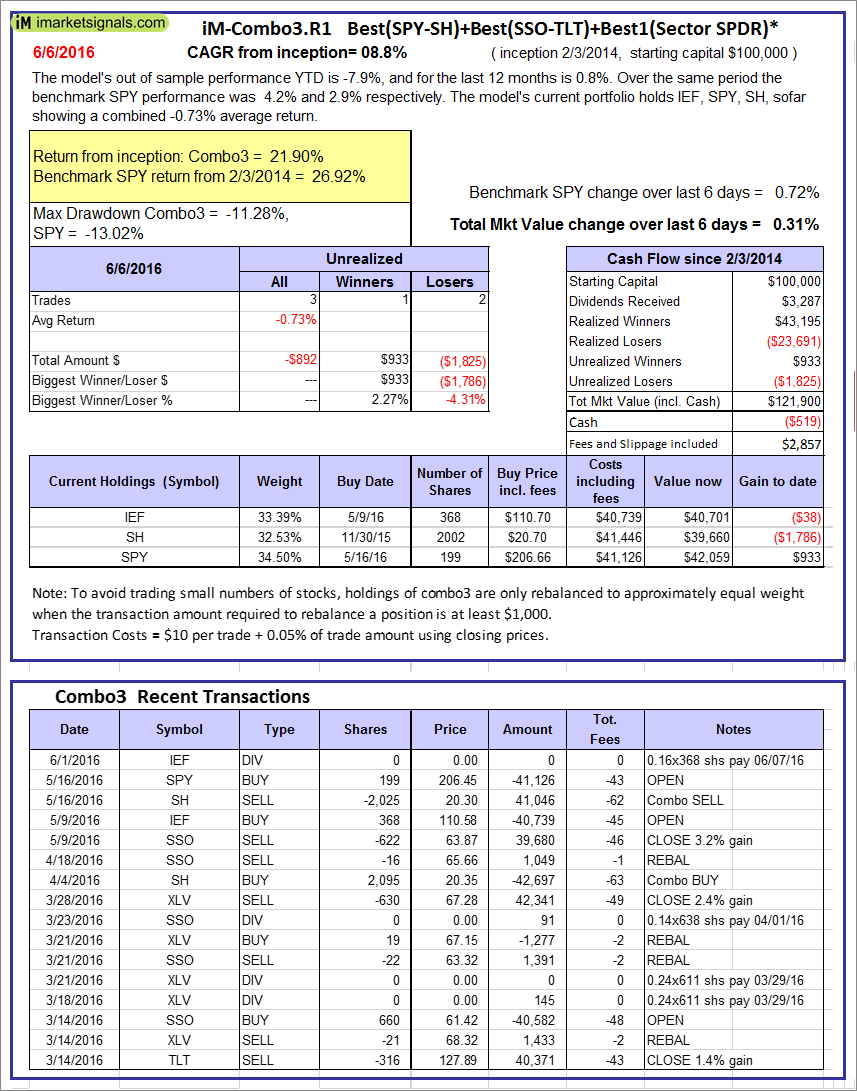 |
iM-Combo3.R1: The model’s out of sample performance YTD is -7.9%, and for the last 12 months is 0.8%. Over the same period the benchmark SPY performance was 4.2% and 2.9% respectively. Over the previous week the market value of iM-Combo3.R1 gained 0.31% at a time when SPY gained 0.72%. A starting capital of $100,000 at inception on 2/3/2014 would have grown to $121,900 which includes -$519 cash and excludes $2,857 spent on fees and slippage. |
 |
iM-Combo5: The model’s out of sample performance from inception is -1.5%. The benchmark SPY performance over the same period is 10.6%. Over the previous week the market value of iM-Combo5 gained 0.34% at a time when SPY gained 0.72%. A starting capital of $100,000 at inception on 2/22/2016 would have grown to $98,484 which includes $19,794 cash and excludes $235 spent on fees and slippage. |
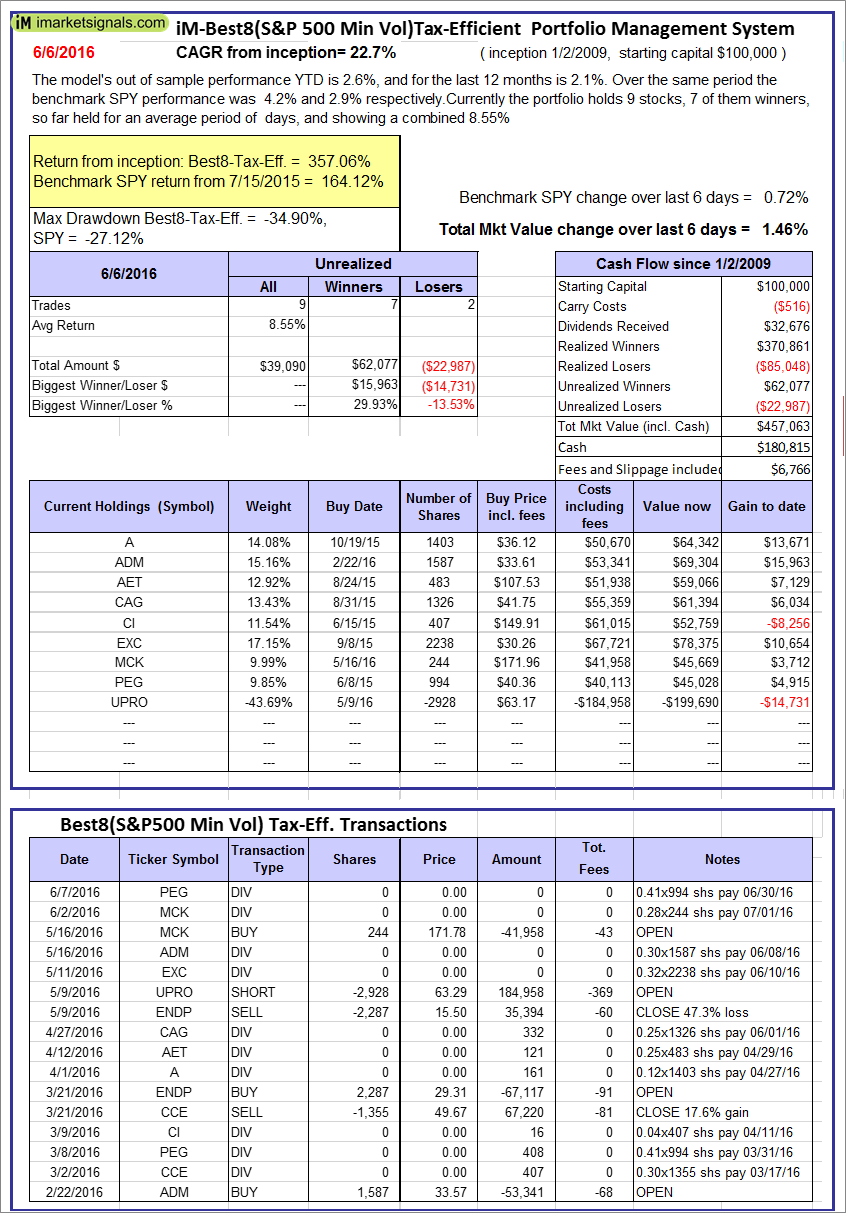 |
The iM-Best8(S&P500 Min Vol)Tax-Efficient The model’s out of sample performance YTD is 2.6%, and for the last 12 months is 2.1%. Over the same period the benchmark SPY performance was 4.2% and 2.9% respectively. Over the previous week the market value of iM-Best8(S&P 500)Tax-Eff. gained 1.46% at a time when SPY gained 0.72%. A starting capital of $100,000 at inception on 1/2/2009 would have grown to $457,063 which includes $180,815 cash and excludes $6,766 spent on fees and slippage. |
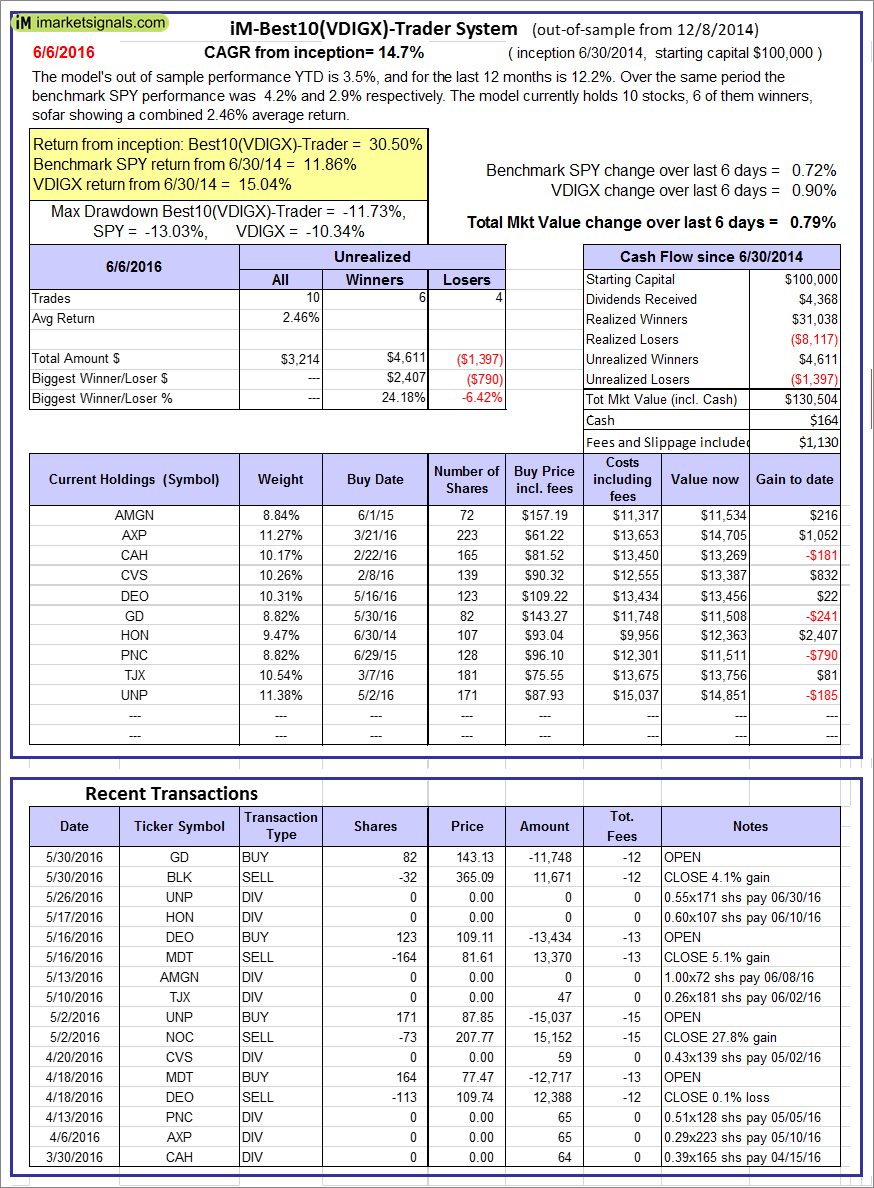 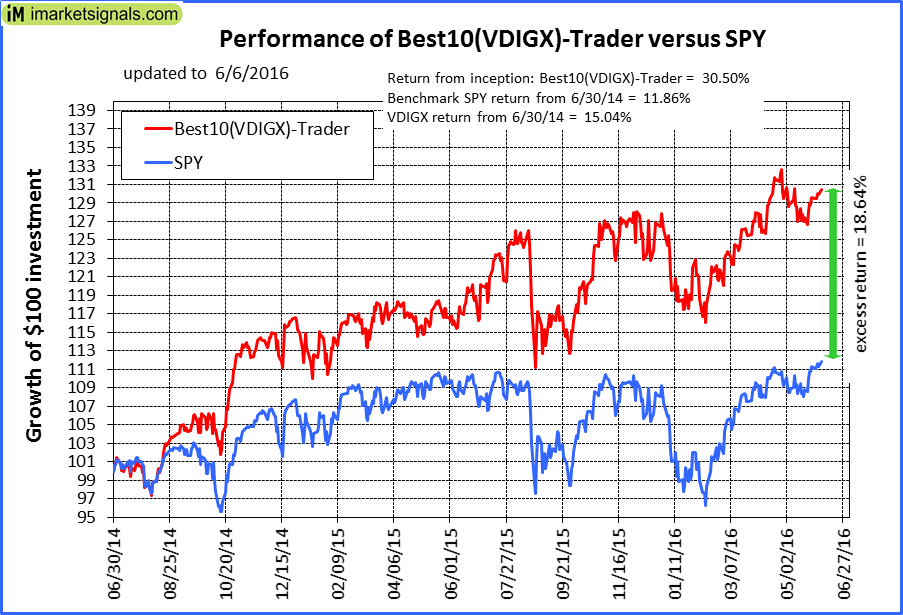 |
iM-Best10(VDIGX)-Trader: The model’s out of sample performance YTD is 3.5%, and for the last 12 months is 12.2%. Over the same period the benchmark SPY performance was 4.2% and 2.9% respectively. Since inception, on 7/1/2014, the model gained 30.50% while the benchmark SPY gained 11.86% and the ETF VDIGX gained 15.04% over the same period. Over the previous week the market value of iM-Best10(VDIGX) gained 0.79% at a time when SPY gained 0.72%. A starting capital of $100,000 at inception on 7/1/2014 would have grown to $130,504 which includes $164 cash and excludes $1,130 spent on fees and slippage. |
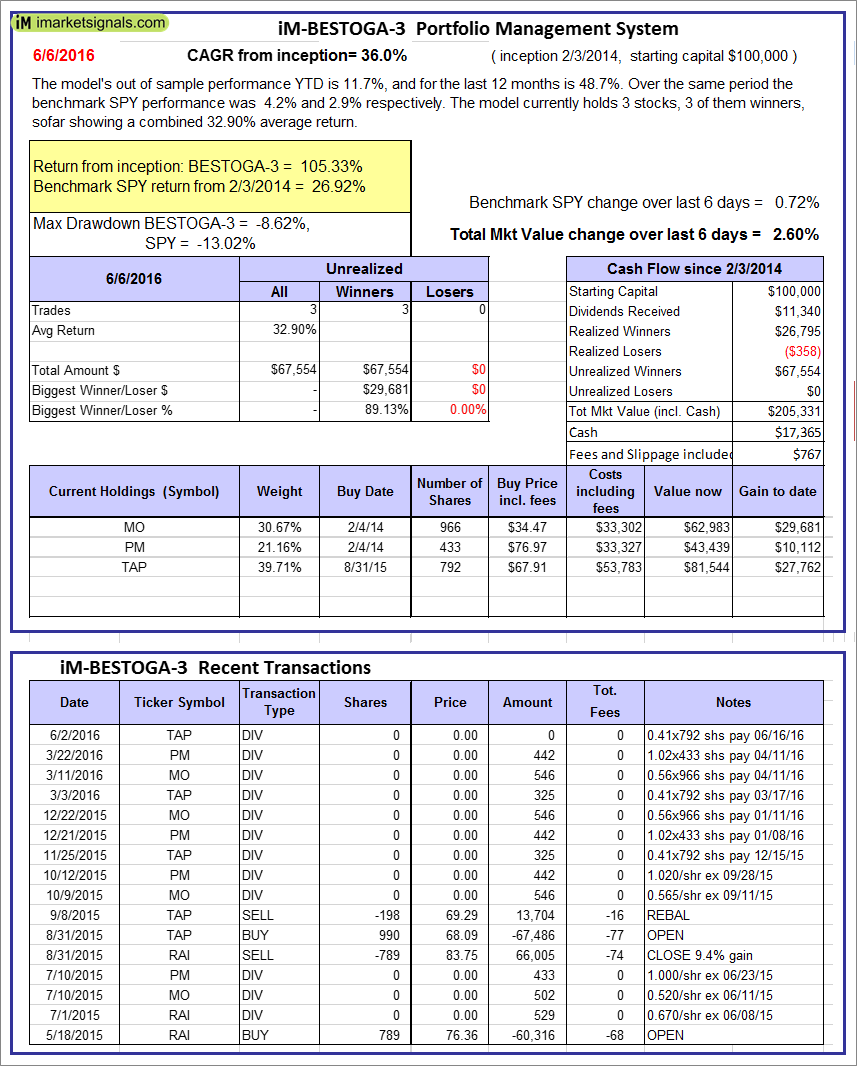 |
iM-BESTOGA-3: The model’s out of sample performance YTD is 11.7%, and for the last 12 months is 48.7%. Over the same period the benchmark SPY performance was 4.2% and 2.9% respectively. Over the previous week the market value of iM-BESTOGA-3 gained 2.60% at a time when SPY gained 0.72%. A starting capital of $100,000 at inception on 2/3/2014 would have grown to $205,331 which includes $17,365 cash and excludes $767 spent on fees and slippage. |
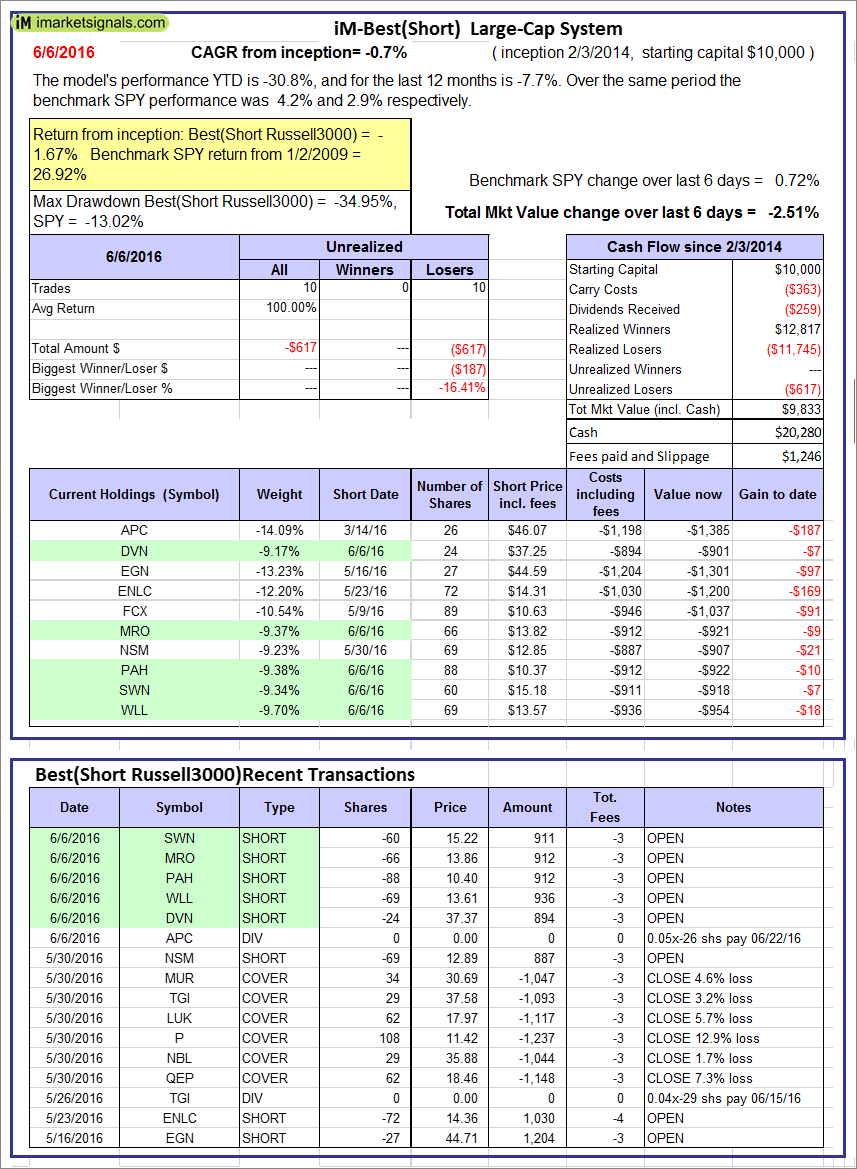 |
iM-Best10(Short Russell3000): The model’s performance YTD is -30.8%, and for the last 12 months is -7.7%. Over the same period the benchmark SPY performance was 4.2% and 2.9% respectively. Over the previous week the market value of iM-Best10(Short Russell3000) gained -2.51% at a time when SPY gained 0.72%. Over the period 2/3/2014 to 6/6/2016 the starting capital of $100,000 would have grown to $9,833 which includes $20,280 cash and excludes $1,246 spent on fees and slippage. |
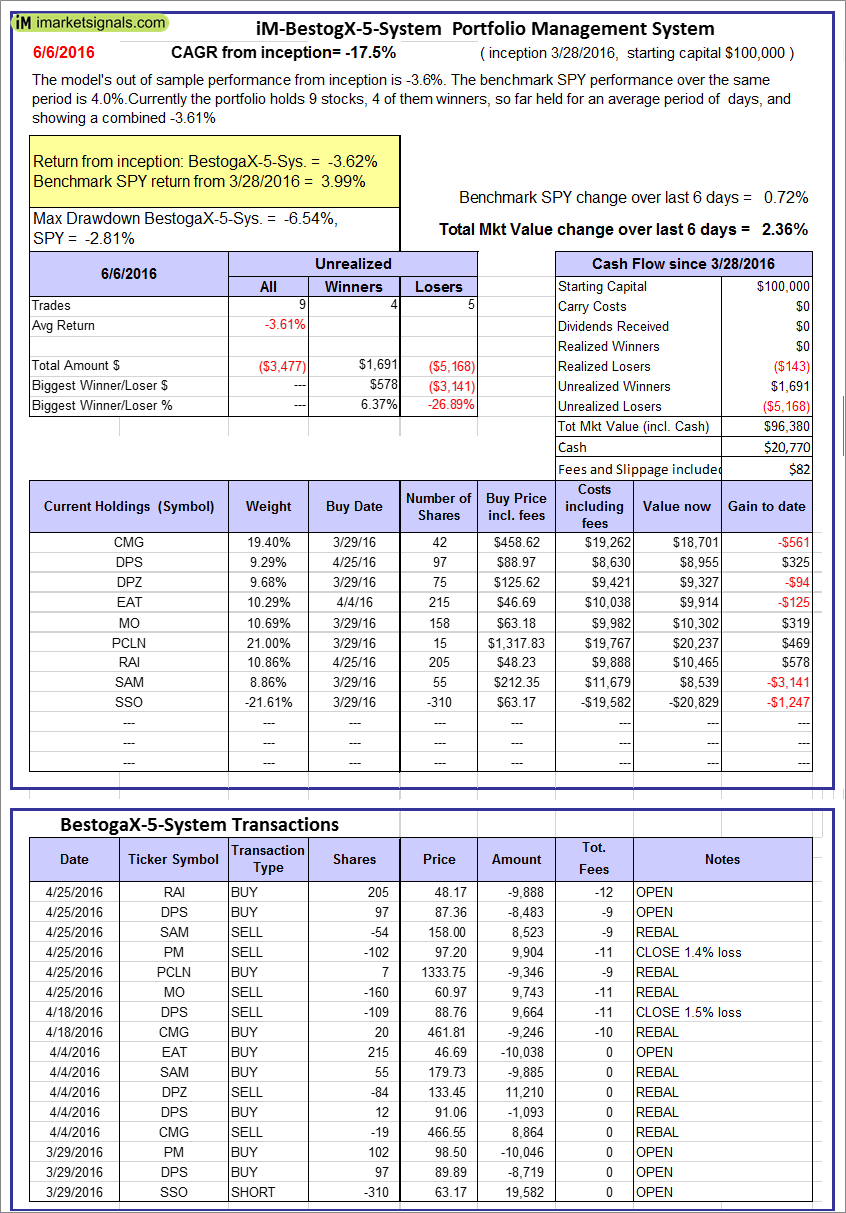 |
iM-BestogaX5-System: The model’s out of sample performance from inception is -3.6%. The benchmark SPY performance over the same period is 4.0%. Over the previous week the market value of iM-Best8(S&P 500)Tax-Eff. gained 2.36% at a time when SPY gained 0.72%. A starting capital of $100,000 at inception on 1/2/2009 would have grown to $96,380 which includes $20,770 cash and excludes $82 spent on fees and slippage. |
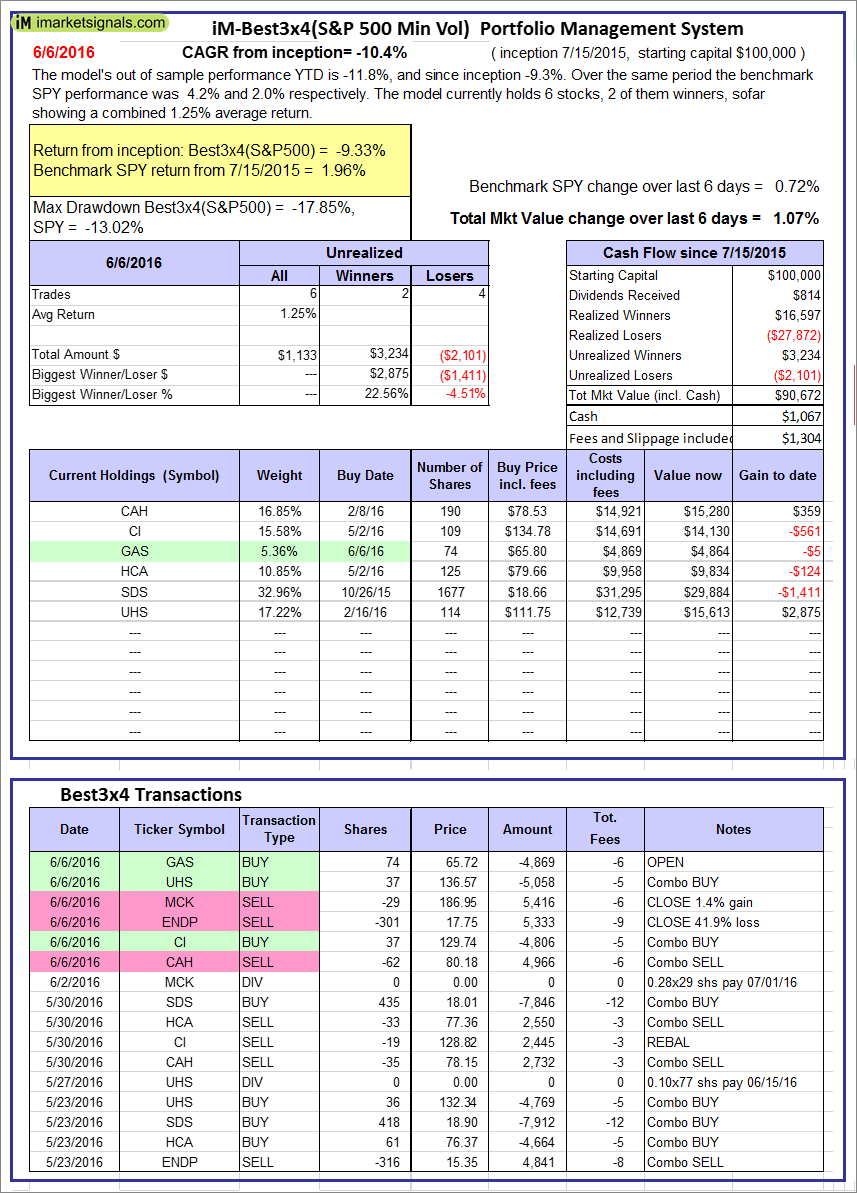 |
iM-Best3x4(S&P 500 Min Vol): The model’s out of sample performance YTD is -11.8%, and since inception -9.3%. Over the same period the benchmark SPY performance was 4.2% and 2.0% respectively. Over the previous week the market value of iM-Best3x4 gained 1.07% at a time when SPY gained 0.72%. A starting capital of $100,000 at inception on 7/15/2015 would have grown to $90,672 which includes $1,067 cash and excludes $1,304 spent on fees and slippage. |
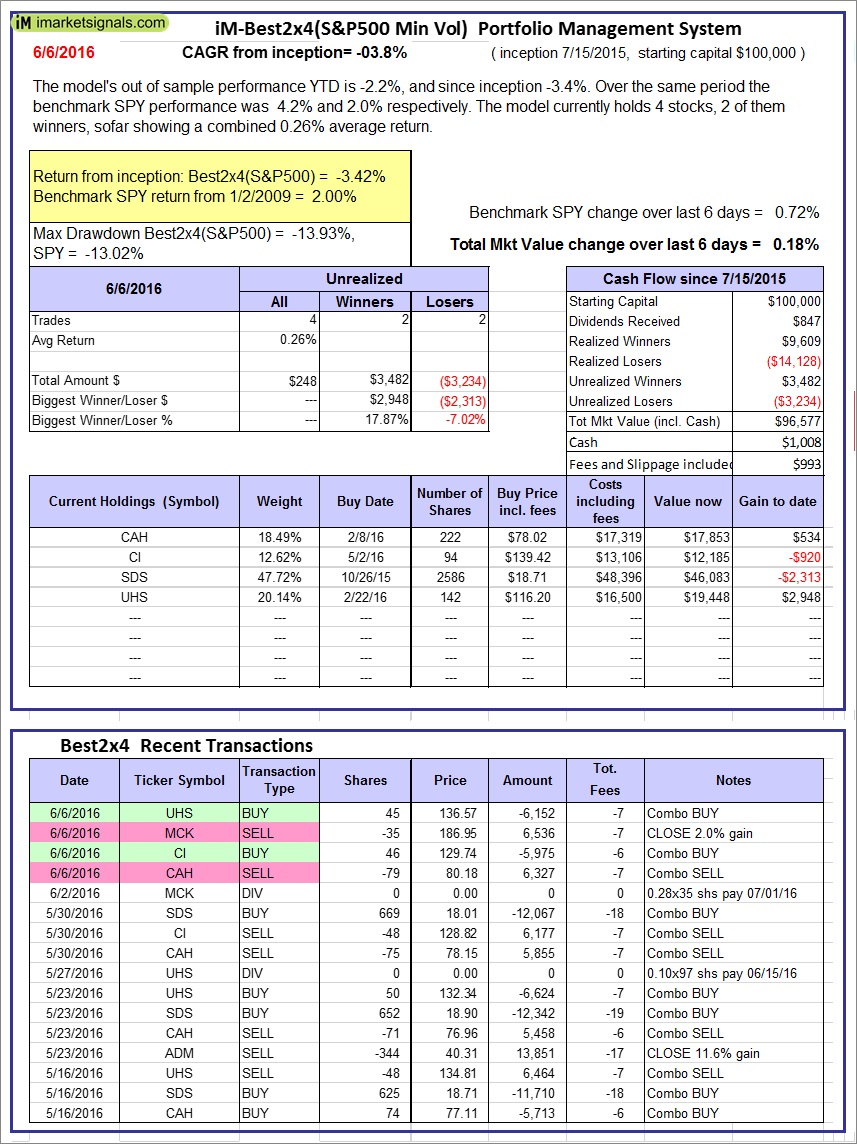 |
iM-Best2x4(S&P 500 Min Vol): The model’s out of sample performance YTD is -2.2%, and since inception -3.4%. Over the same period the benchmark SPY performance was 4.2% and 2.0% respectively. Over the previous week the market value of iM-Best2x4 gained 0.18% at a time when SPY gained 0.72%. A starting capital of $100,000 at inception on 7/16/2015 would have grown to $96,577 which includes $1,008 cash and excludes $993 spent on fees and slippage. |
 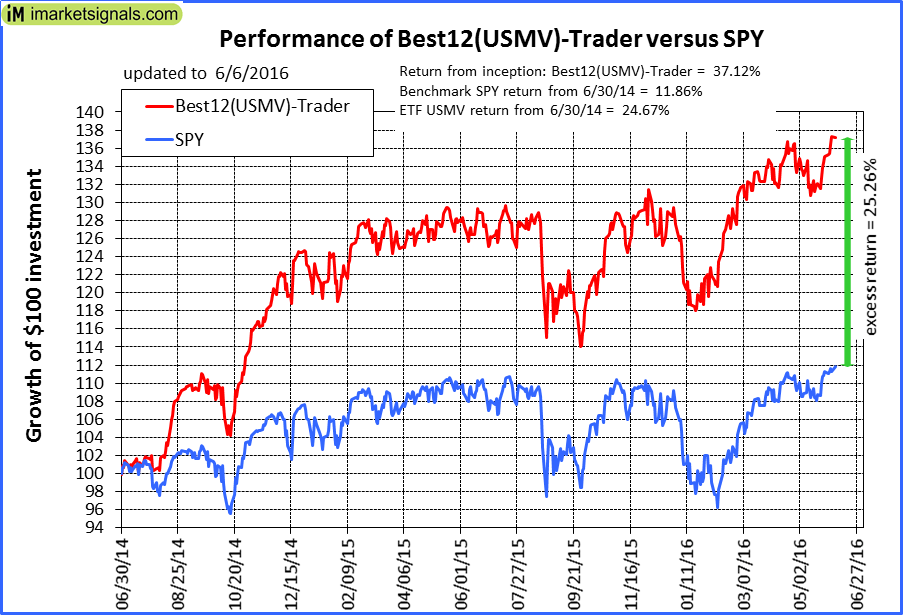 |
iM-Best12(USMV)-Trader: The model’s out of sample performance YTD is 7.5%, and for the last 12 months is 7.7%. Over the same period the benchmark SPY performance was 4.2% and 2.9% respectively. Since inception, on 7/1/2014, the model gained 37.12% while the benchmark SPY gained 11.86% and the ETF USMV gained 24.67% over the same period. Over the previous week the market value of iM-Best12(USMV)-Trader gained 1.39% at a time when SPY gained 0.72%. A starting capital of $100,000 at inception on 7/1/2014 would have grown to $137,117 which includes $440 cash and excludes $2,029 spent on fees and slippage. |
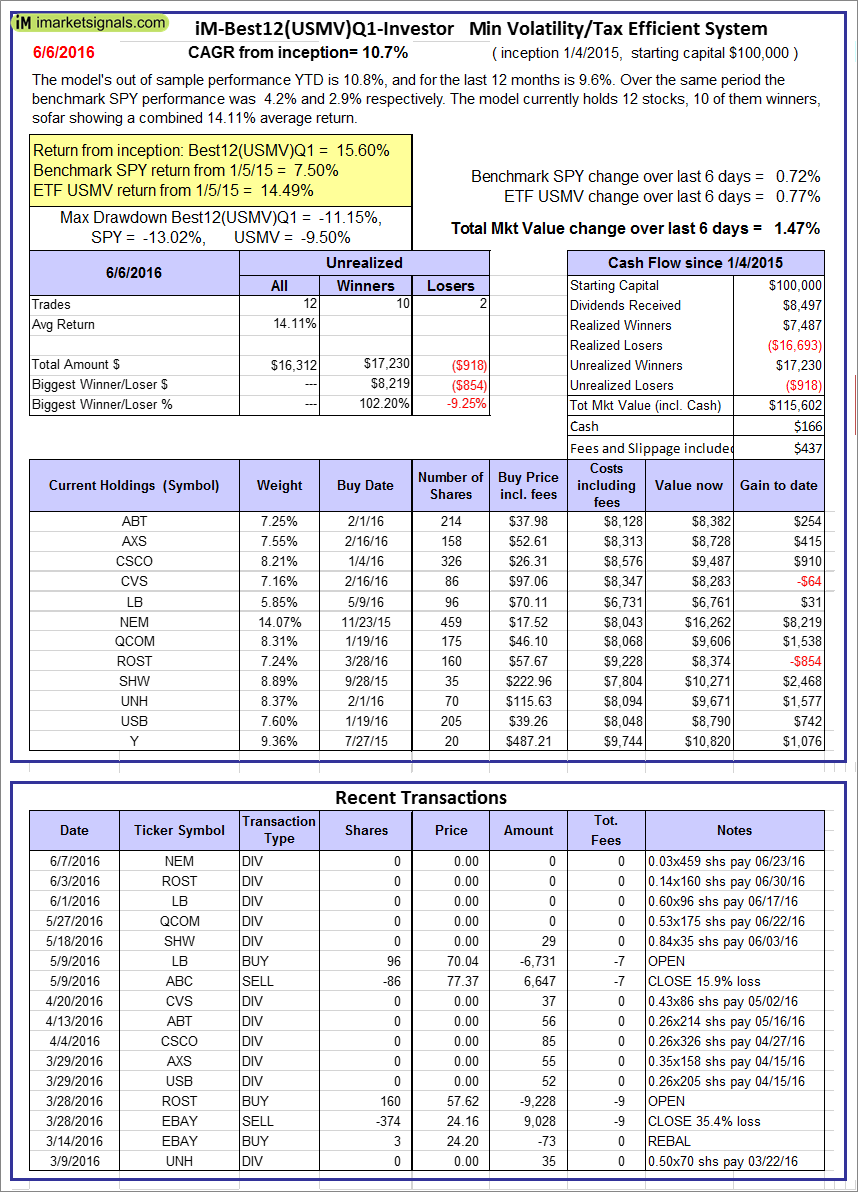 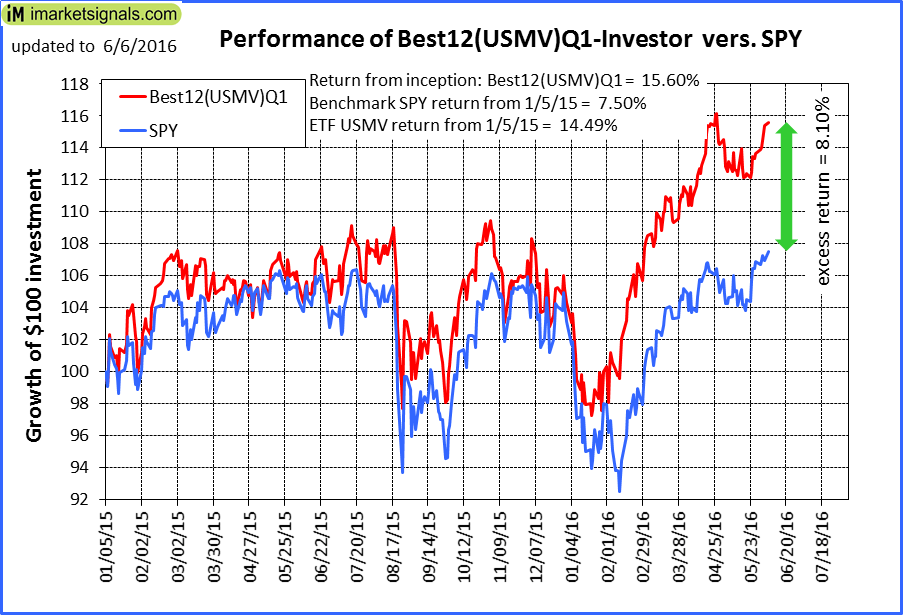 |
iM-Best12(USMV)Q1-Investor: The model’s out of sample performance YTD is 10.8%, and for the last 12 months is 9.6%. Over the same period the benchmark SPY performance was 4.2% and 2.9% respectively. Since inception, on 1/5/2015, the model gained 15.60% while the benchmark SPY gained 7.50% and the ETF USMV gained 14.49% over the same period. Over the previous week the market value of iM-Best12(USMV)Q1 gained 1.47% at a time when SPY gained 0.72%. A starting capital of $100,000 at inception on 1/5/2015 would have grown to $115,602 which includes $166 cash and excludes $437 spent on fees and slippage. |
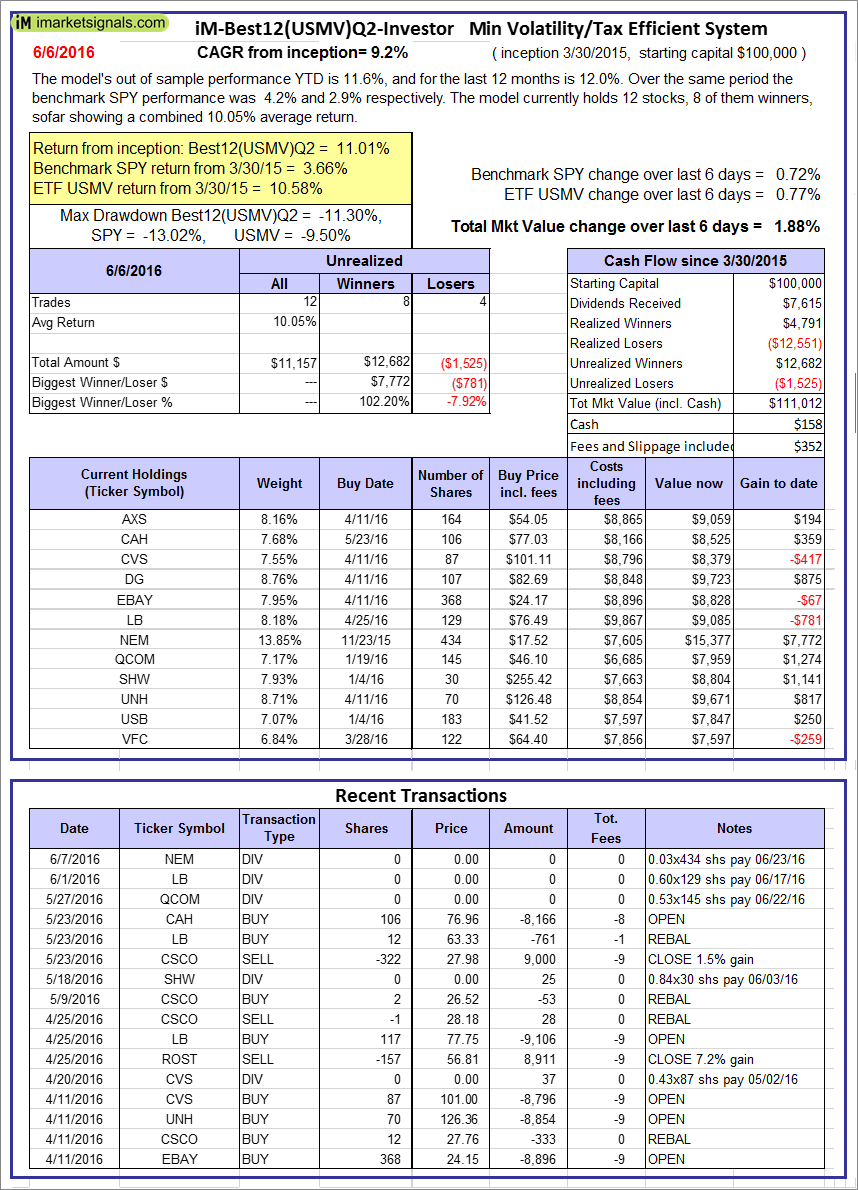  |
iM-Best12(USMV)Q2-Investor: The model’s out of sample performance YTD is 11.6%, and for the last 12 months is 12.0%. Over the same period the benchmark SPY performance was 4.2% and 2.9% respectively. Since inception, on 3/31/2015, the model gained 11.01% while the benchmark SPY gained 3.66% and the ETF USMV gained 10.58% over the same period. Over the previous week the market value of iM-Best12(USMV)Q2 gained 1.88% at a time when SPY gained 0.72%. A starting capital of $100,000 at inception on 3/31/2015 would have grown to $111,012 which includes $158 cash and excludes $352 spent on fees and slippage. |
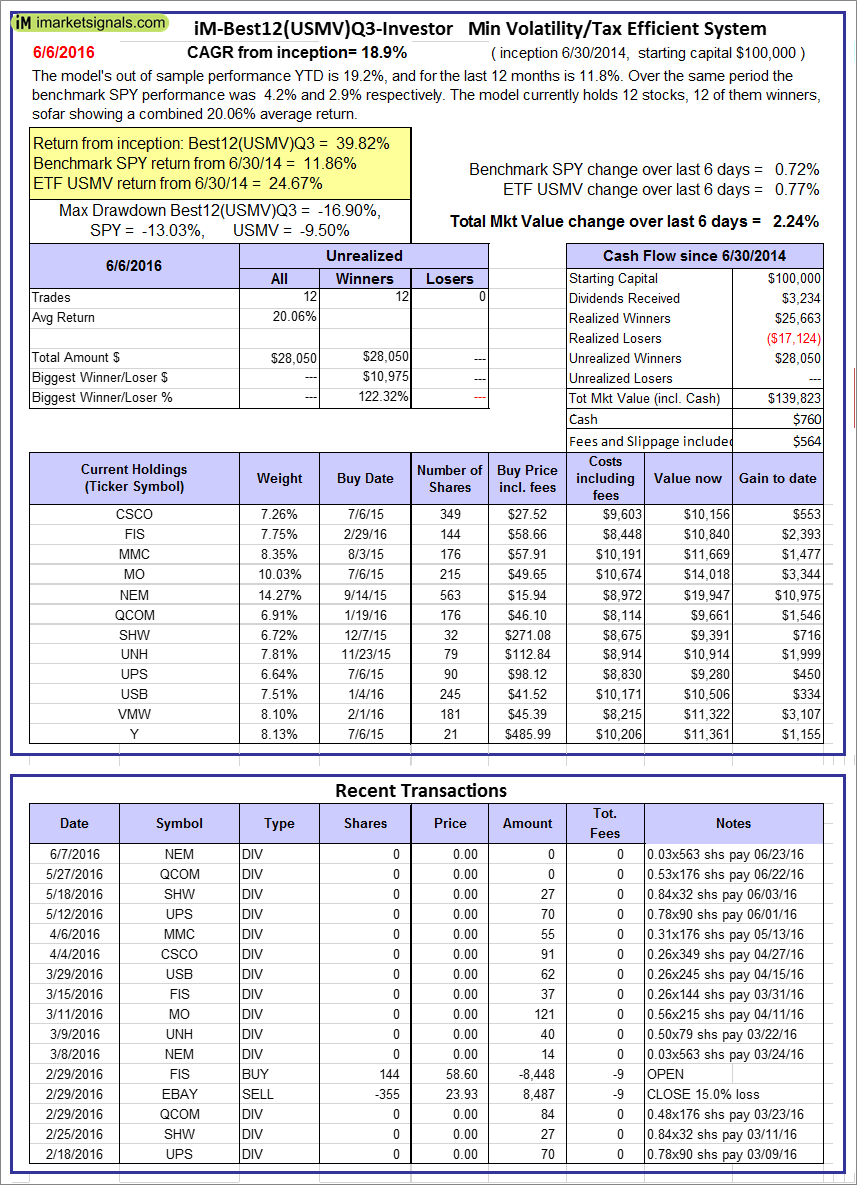  |
iM-Best12(USMV)Q3-Investor: The model’s out of sample performance YTD is 19.2%, and for the last 12 months is 11.8%. Over the same period the benchmark SPY performance was 4.2% and 2.9% respectively. Since inception, on 7/1/2014, the model gained 39.82% while the benchmark SPY gained 11.86% and the ETF USMV gained 24.67% over the same period. Over the previous week the market value of iM-Best12(USMV)Q3 gained 2.24% at a time when SPY gained 0.72%. A starting capital of $100,000 at inception on 7/1/2014 would have grown to $139,823 which includes $760 cash and excludes $564 spent on fees and slippage. |
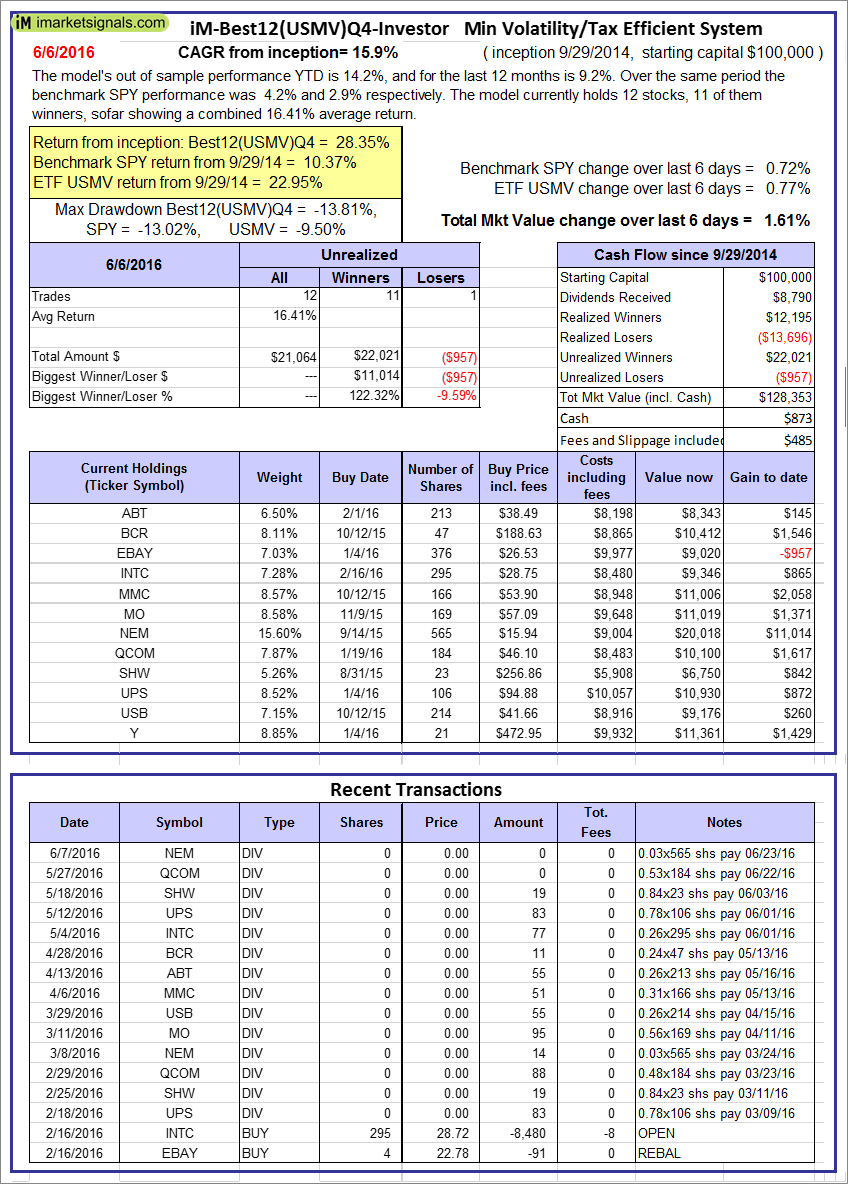 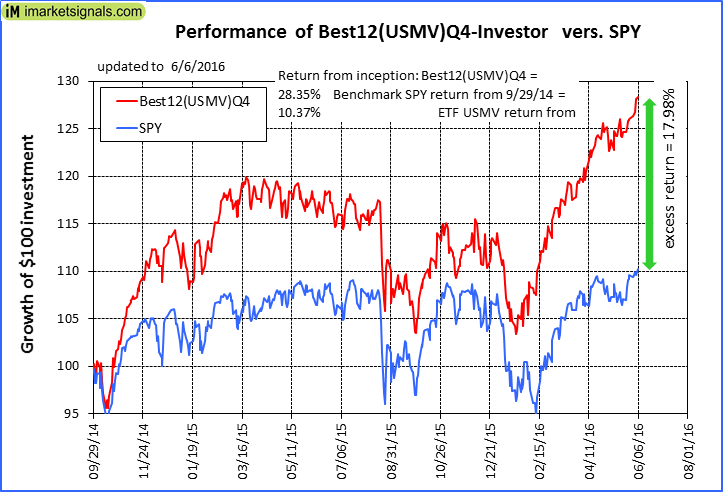 |
iM-Best12(USMV)Q4-Investor: Since inception, on 9/30/2014, the model gained 28.35% while the benchmark SPY gained 10.37% and the ETF USMV gained 22.95% over the same period. Over the previous week the market value of iM-Best12(USMV)Q4 gained 1.61% at a time when SPY gained 0.72%. A starting capital of $100,000 at inception on 9/30/2014 would have grown to $128,353 which includes $873 cash and excludes $485 spent on fees and slippage. |
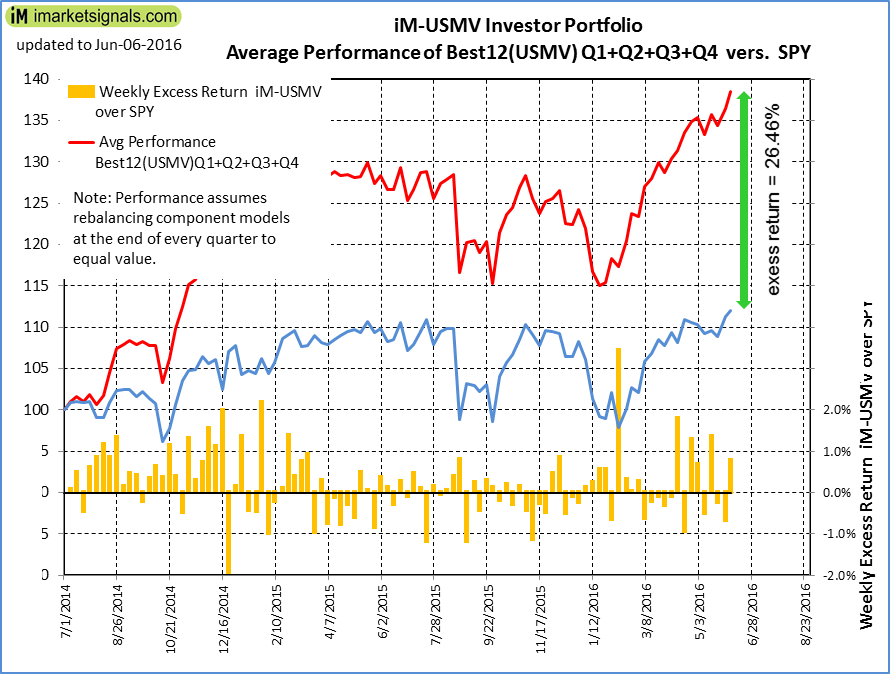 |
Average Performance of iM-Best12(USMV)Q1+Q2+Q3+Q4-Investor resulted in an excess return of 26.46% over SPY. (see iM-USMV Investor Portfolio) |
 |
iM-Best(Short): The model’s out of sample performance YTD is -6.3%, and for the last 12 months is -8.2%. Over the same period the benchmark SPY performance was 4.2% and 2.9% respectively. Over the previous week the market value of iM-Best(Short) gained -0.13% at a time when SPY gained 0.72%. Over the period 1/2/2009 to 6/6/2016 the starting capital of $100,000 would have grown to $98,105 which includes $98,105 cash and excludes $19,220 spent on fees and slippage. |
iM-Best Reports – 6/6/2016
Posted in pmp SPY-SH
Leave a Reply
You must be logged in to post a comment.