
  |
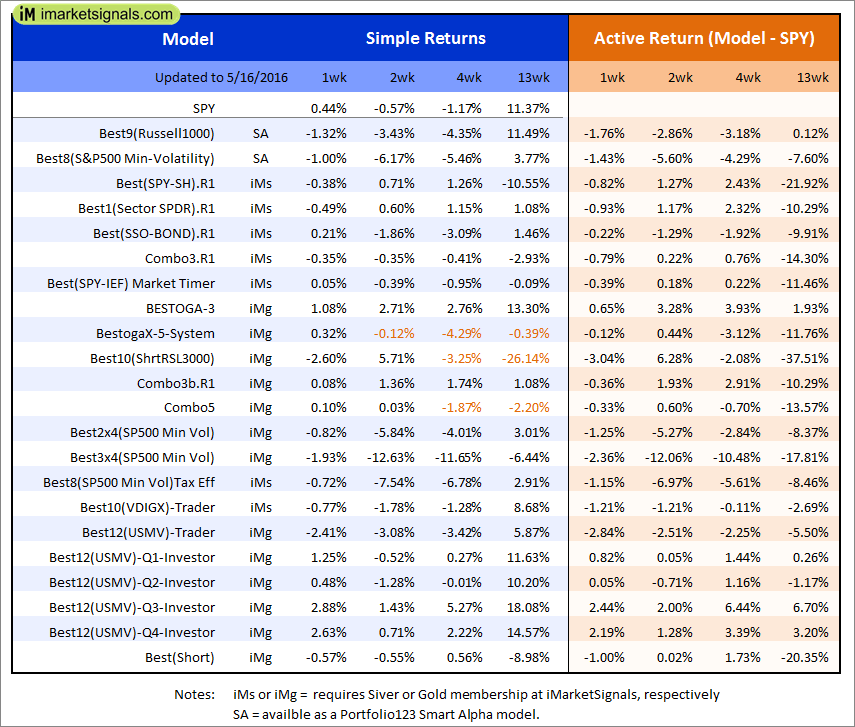
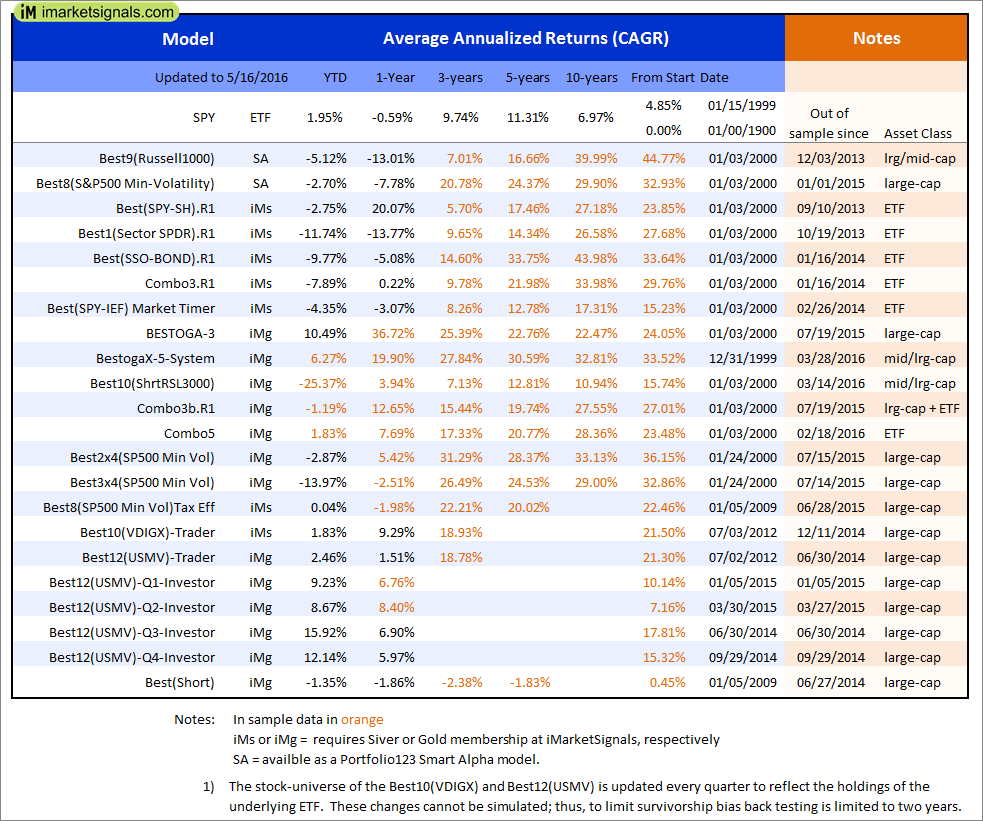
Out of sample performance summary of our models for the past 1, 2, 4 and 13 week periods. The active active return indicates how the models over- or underperformed the benchmark ETF SPY. Also the YTD, and the 1-, 3-, 5- and 10-year annualized returns are shown in the second table |
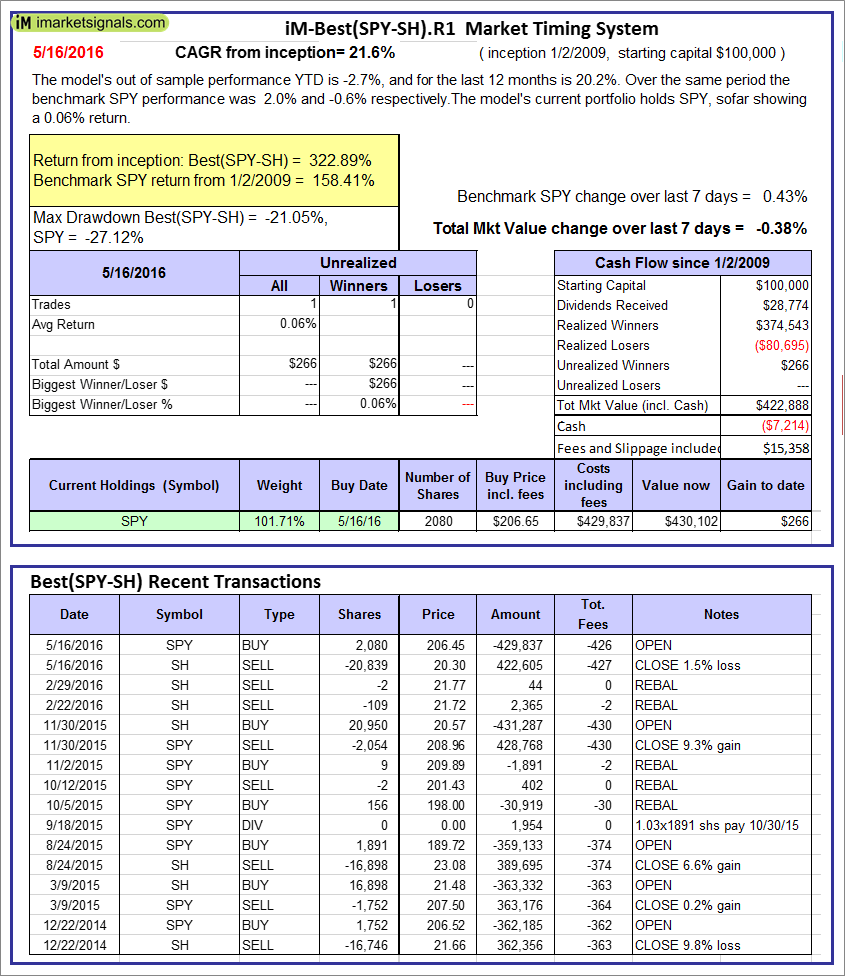 |
iM-Best(SPY-SH).R1: The model’s out of sample performance YTD is -2.7%, and for the last 12 months is 20.2%. Over the same period the benchmark SPY performance was 2.0% and -0.6% respectively. Over the previous week the market value of Best(SPY-SH) gained -0.38% at a time when SPY gained 0.43%. A starting capital of $100,000 at inception on 1/2/2009 would have grown to $422,888 which includes -$7,214 cash and excludes $15,358 spent on fees and slippage. |
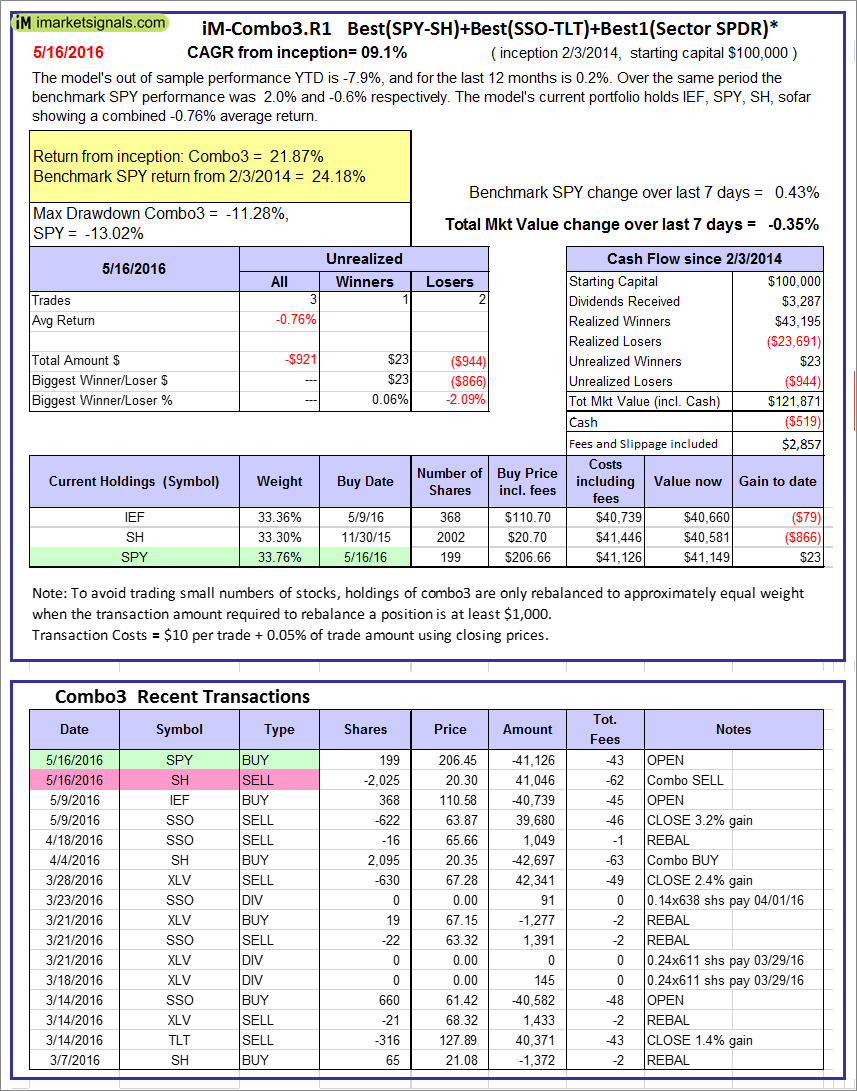 |
iM-Combo3.R1: The model’s out of sample performance YTD is -7.9%, and for the last 12 months is 0.2%. Over the same period the benchmark SPY performance was 2.0% and -0.6% respectively. Over the previous week the market value of iM-Combo3.R1 gained -0.35% at a time when SPY gained 0.43%. A starting capital of $100,000 at inception on 2/3/2014 would have grown to $121,871 which includes -$519 cash and excludes $2,857 spent on fees and slippage. |
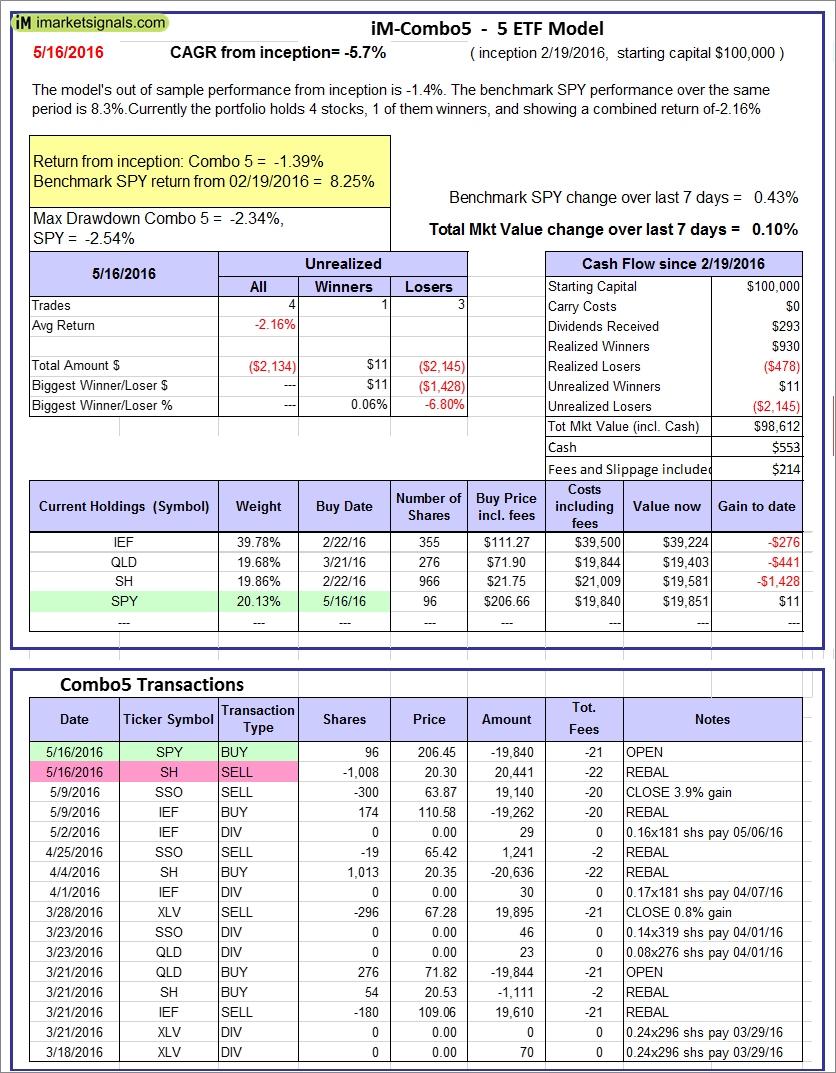 |
iM-Combo5: The model’s out of sample performance from inception is -1.4%. The benchmark SPY performance over the same period is 8.3%. Over the previous week the market value of iM-Combo5 gained 0.10% at a time when SPY gained 0.43%. A starting capital of $100,000 at inception on 2/22/2016 would have grown to $98,612 which includes $553 cash and excludes $214 spent on fees and slippage. |
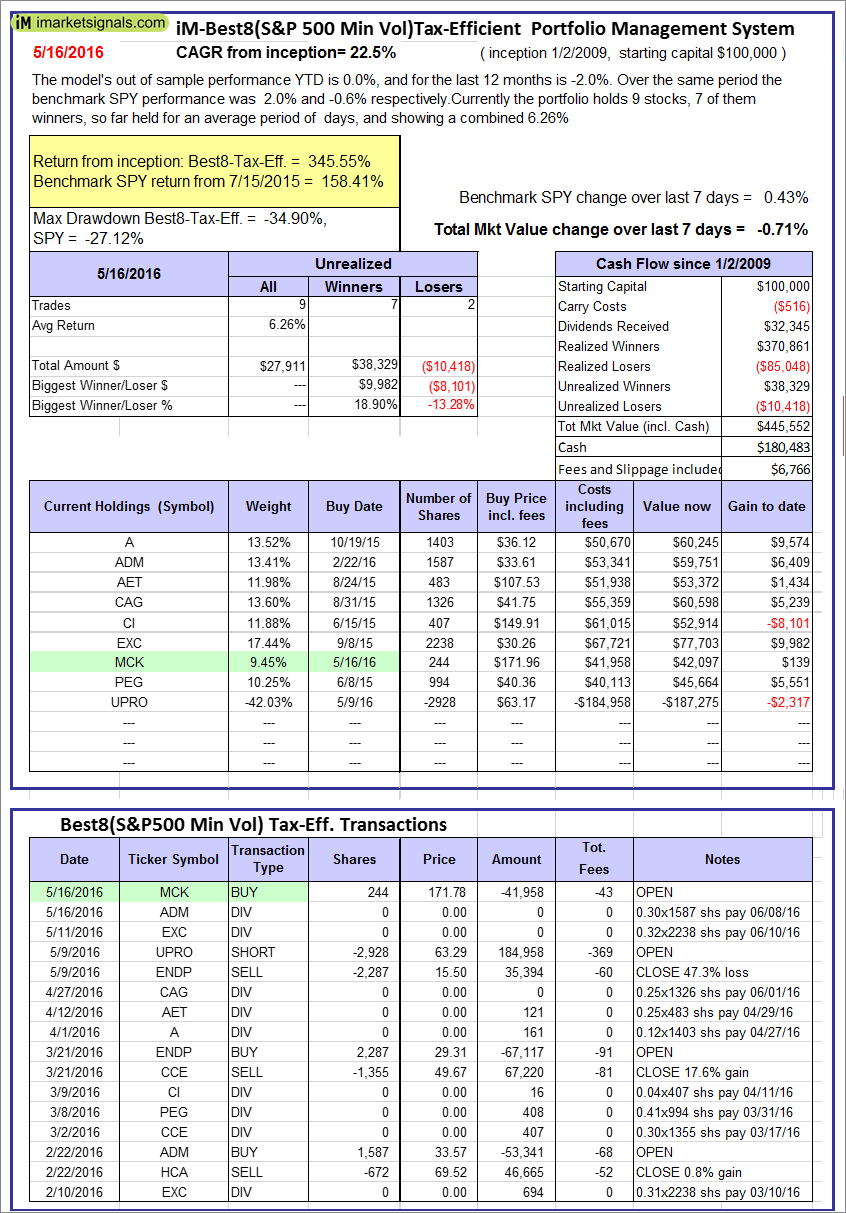 |
The iM-Best8(S&P500 Min Vol)Tax-Efficient The model’s out of sample performance YTD is 0.0%, and for the last 12 months is -2.0%. Over the same period the benchmark SPY performance was 2.0% and -0.6% respectively. Over the previous week the market value of iM-Best8(S&P 500)Tax-Eff. gained -0.71% at a time when SPY gained 0.43%. A starting capital of $100,000 at inception on 1/2/2009 would have grown to $445,552 which includes $180,483 cash and excludes $6,766 spent on fees and slippage. |
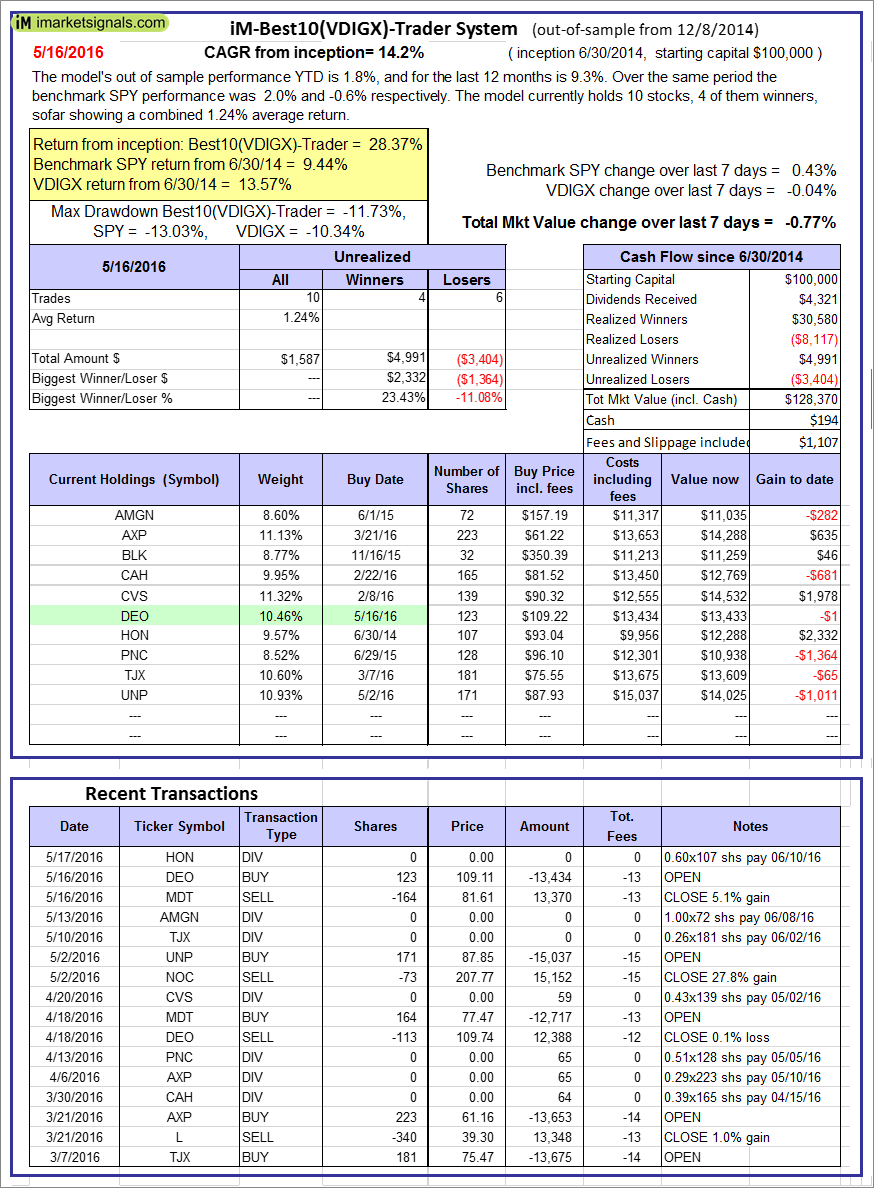 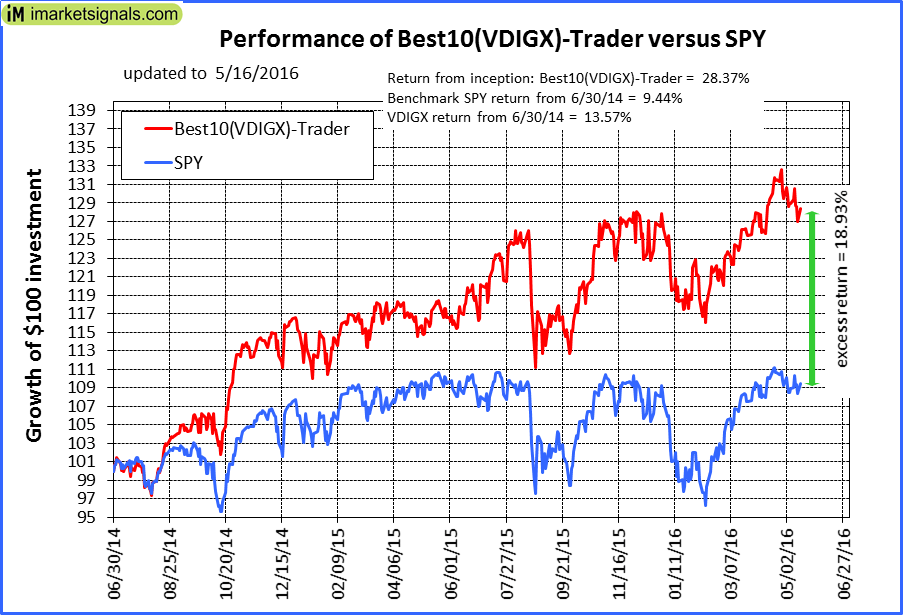 |
iM-Best10(VDIGX)-Trader: The model’s out of sample performance YTD is 1.8%, and for the last 12 months is 9.3%. Over the same period the benchmark SPY performance was 2.0% and -0.6% respectively. Since inception, on 7/1/2014, the model gained 28.37% while the benchmark SPY gained 9.44% and the ETF VDIGX gained 13.57% over the same period. Over the previous week the market value of iM-Best10(VDIGX) gained -0.77% at a time when SPY gained 0.43%. A starting capital of $100,000 at inception on 7/1/2014 would have grown to $128,370 which includes $194 cash and excludes $1,107 spent on fees and slippage. |
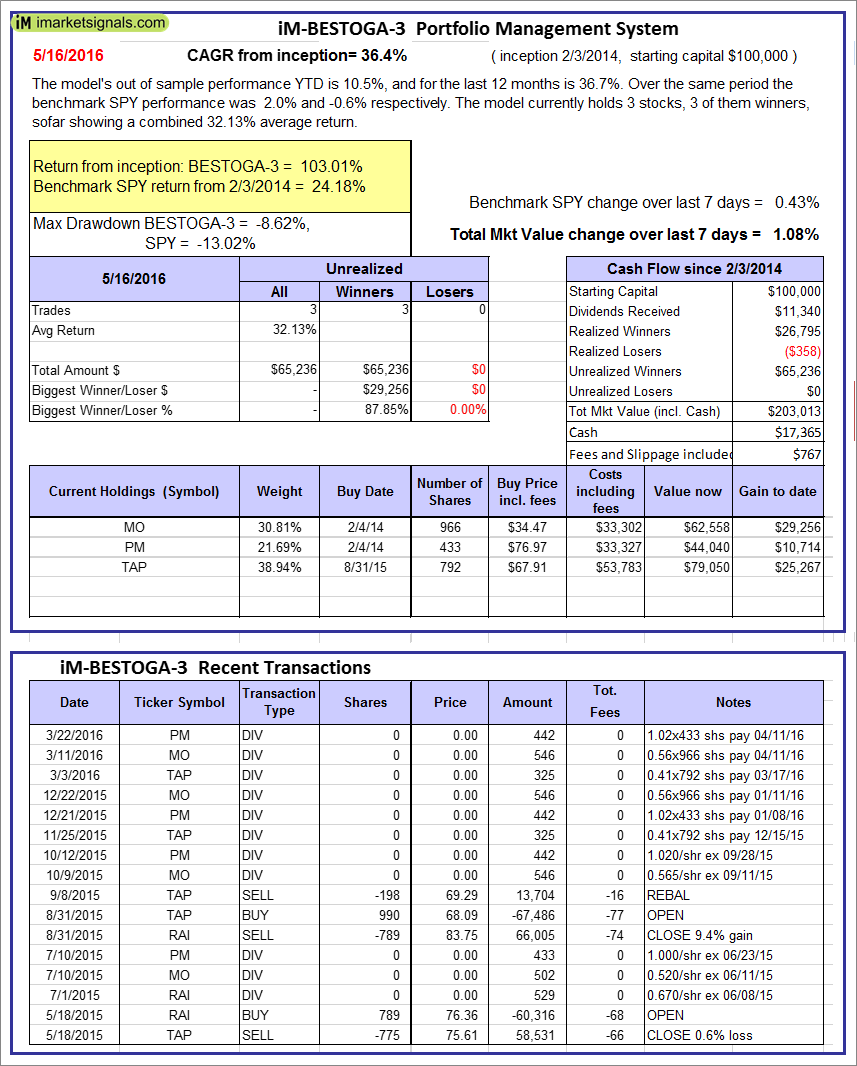 |
iM-BESTOGA-3: The model’s out of sample performance YTD is 10.5%, and for the last 12 months is 36.7%. Over the same period the benchmark SPY performance was 2.0% and -0.6% respectively. Over the previous week the market value of iM-BESTOGA-3 gained 1.08% at a time when SPY gained 0.43%. A starting capital of $100,000 at inception on 2/3/2014 would have grown to $203,013 which includes $17,365 cash and excludes $767 spent on fees and slippage. |
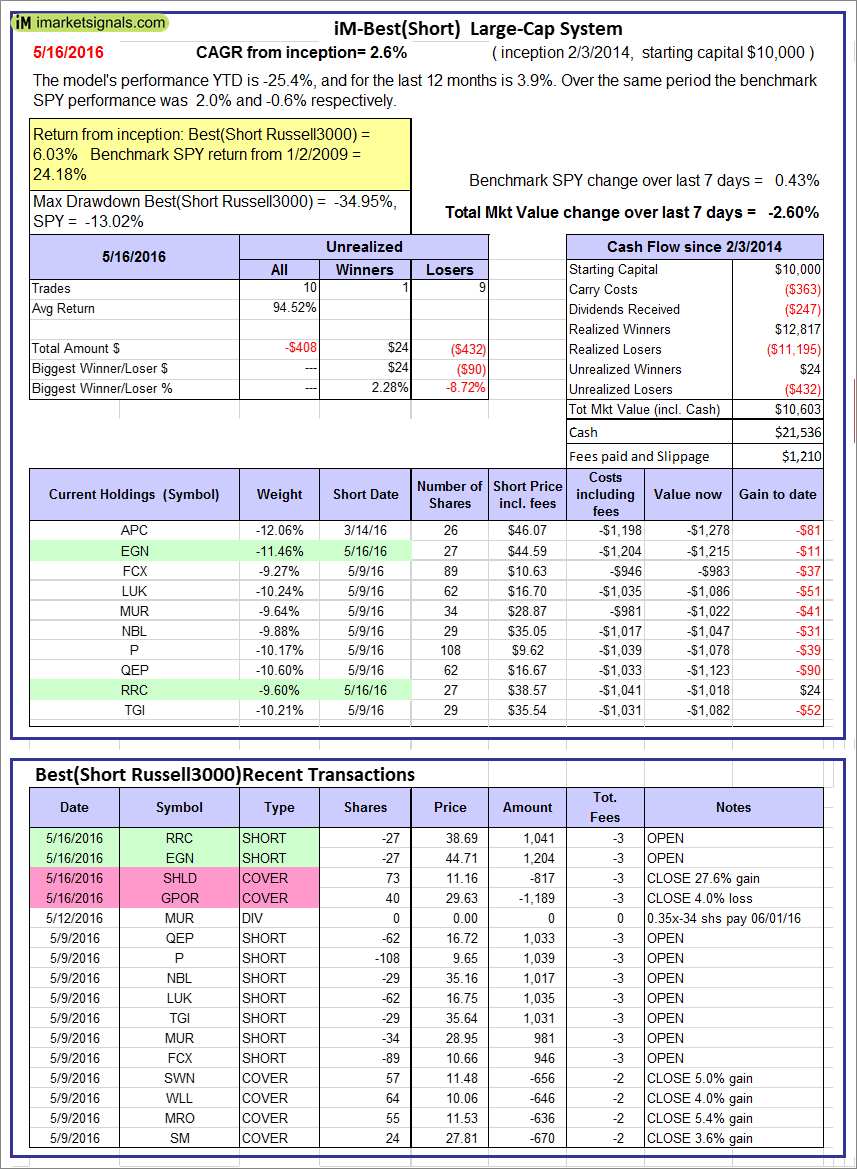 |
iM-Best10(Short Russell3000): The model’s performance YTD is -25.4%, and for the last 12 months is 3.9%. Over the same period the benchmark SPY performance was 2.0% and -0.6% respectively. Over the previous week the market value of iM-Best10(Short Russell3000) gained -2.60% at a time when SPY gained 0.43%. Over the period 2/3/2014 to 5/16/2016 the starting capital of $100,000 would have grown to $10,603 which includes $21,536 cash and excludes $1,210 spent on fees and slippage. |
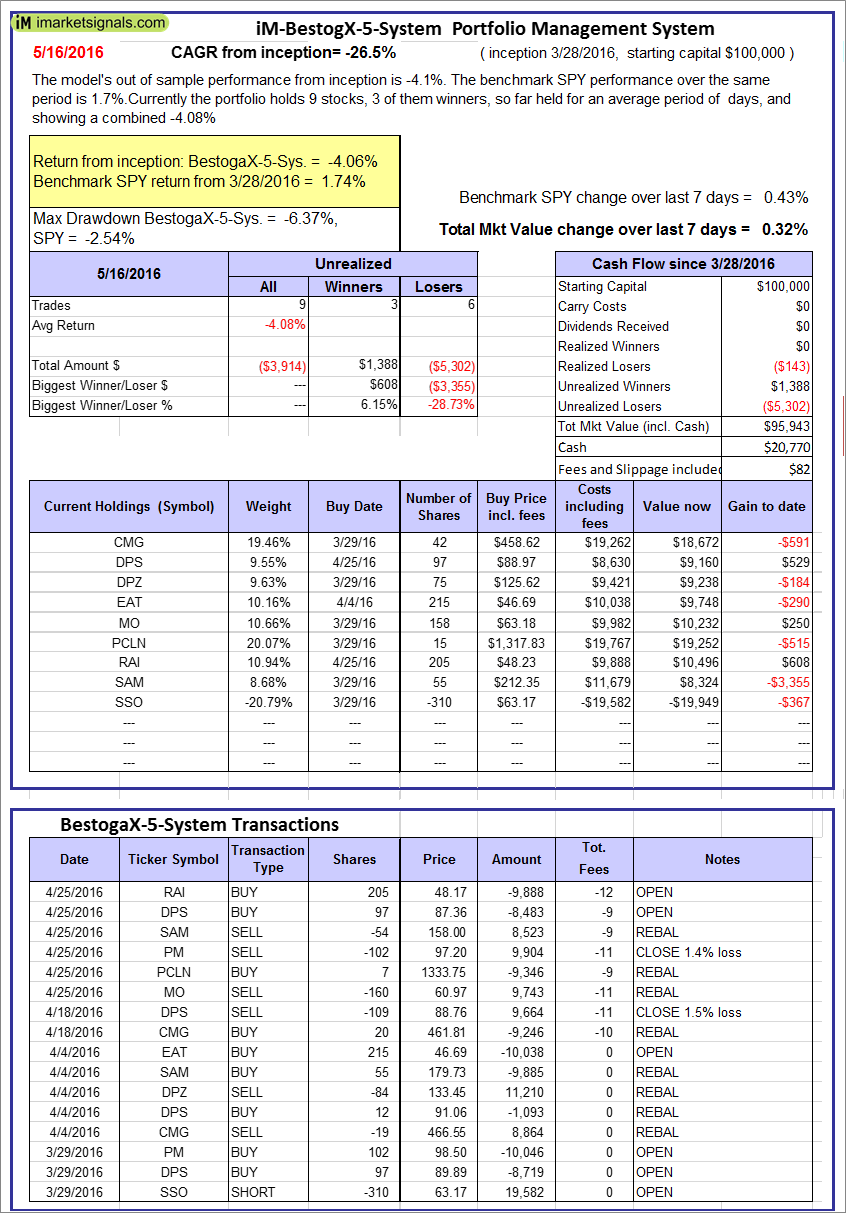 |
iM-BestogaX5-System: The model’s out of sample performance from inception is -4.1%. The benchmark SPY performance over the same period is 1.7%. Over the previous week the market value of iM-Best8(S&P 500)Tax-Eff. gained 0.32% at a time when SPY gained 0.43%. A starting capital of $100,000 at inception on 1/2/2009 would have grown to $95,943 which includes $20,770 cash and excludes $82 spent on fees and slippage. |
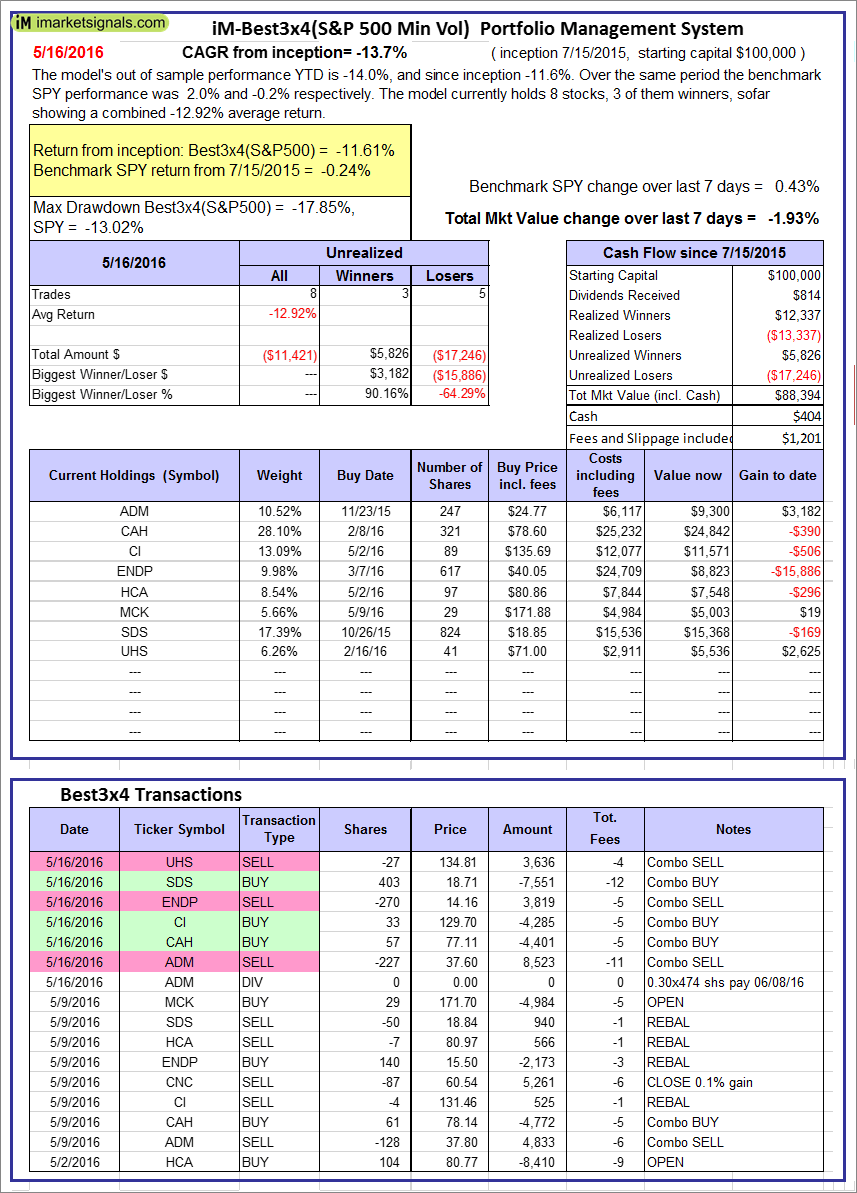 |
iM-Best3x4(S&P 500 Min Vol): The model’s out of sample performance YTD is -14.0%, and since inception -11.6%. Over the same period the benchmark SPY performance was 2.0% and -0.2% respectively. Over the previous week the market value of iM-Best3x4 gained -1.93% at a time when SPY gained 0.43%. A starting capital of $100,000 at inception on 7/15/2015 would have grown to $88,394 which includes $404 cash and excludes $1,201 spent on fees and slippage. |
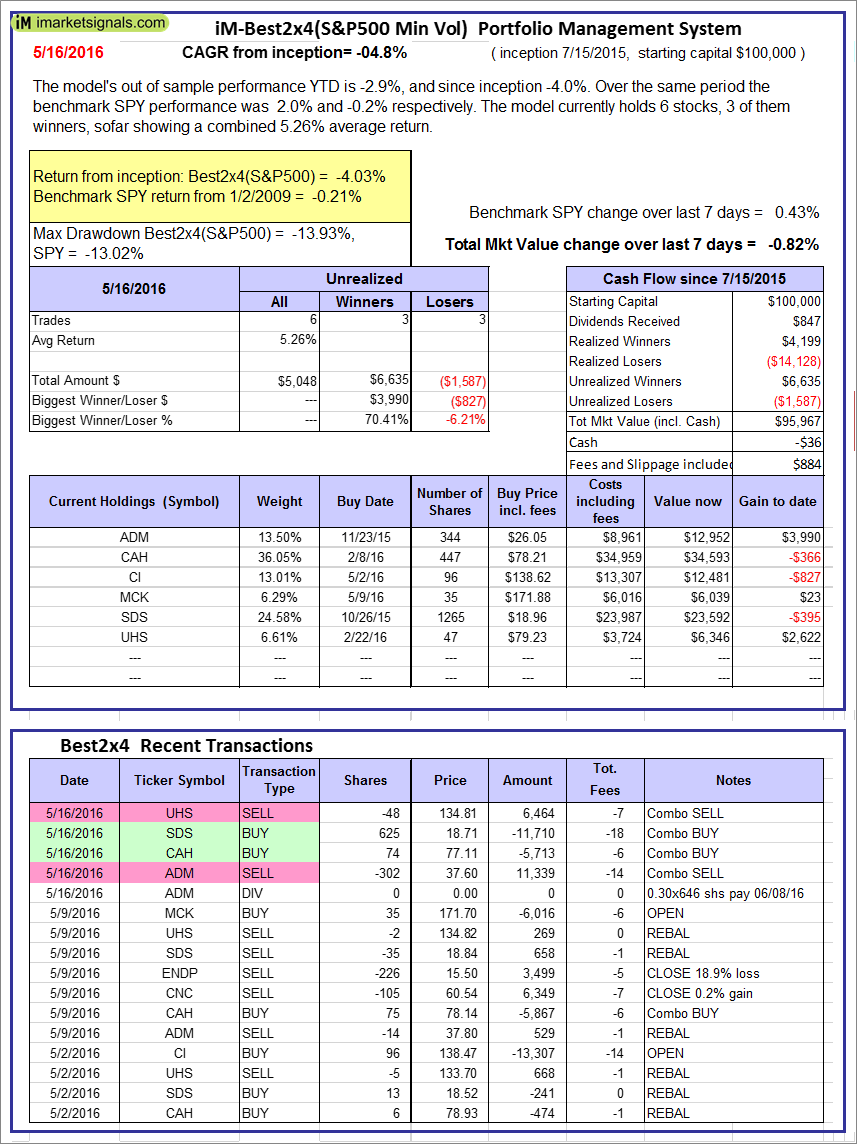 |
iM-Best2x4(S&P 500 Min Vol): The model’s out of sample performance YTD is -2.9%, and since inception -4.0%. Over the same period the benchmark SPY performance was 2.0% and -0.2% respectively. Over the previous week the market value of iM-Best2x4 gained -0.82% at a time when SPY gained 0.43%. A starting capital of $100,000 at inception on 7/16/2015 would have grown to $95,967 which includes -$36 cash and excludes $884 spent on fees and slippage. |
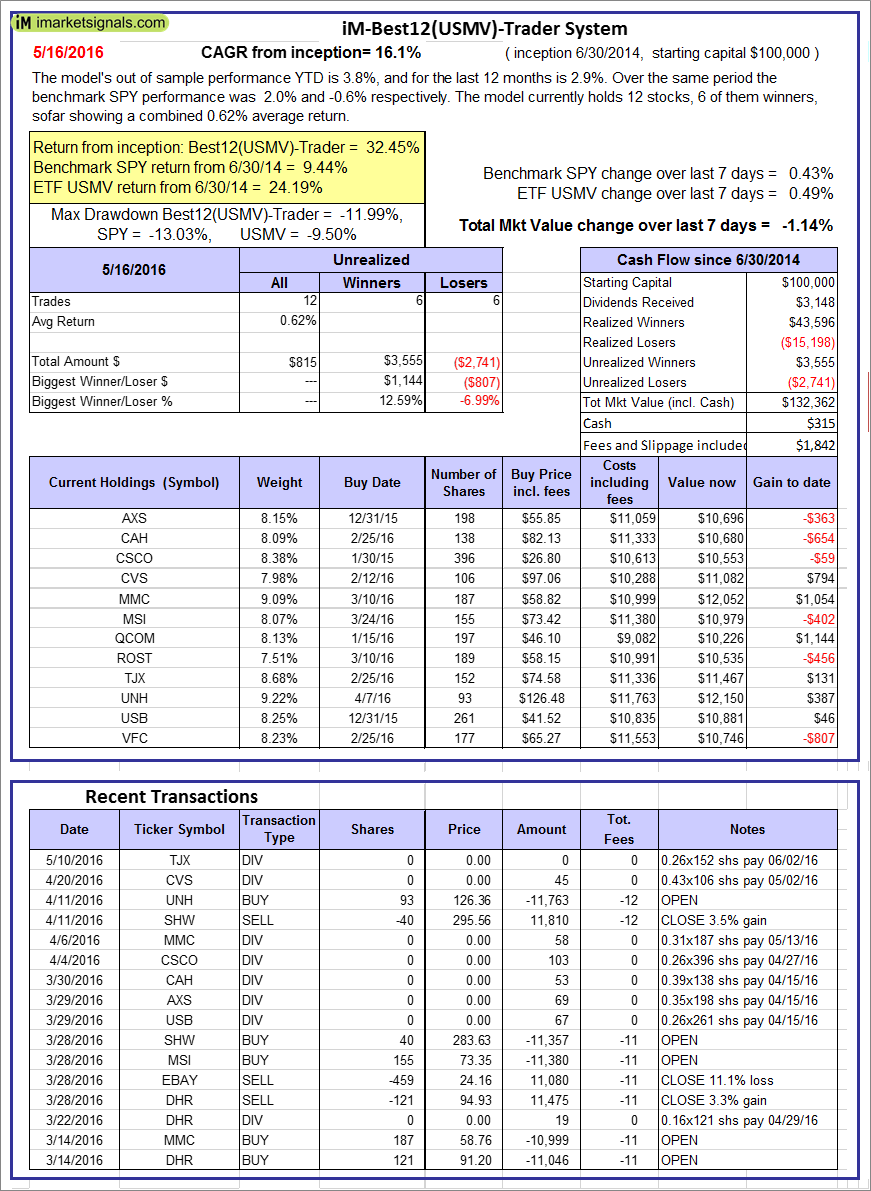 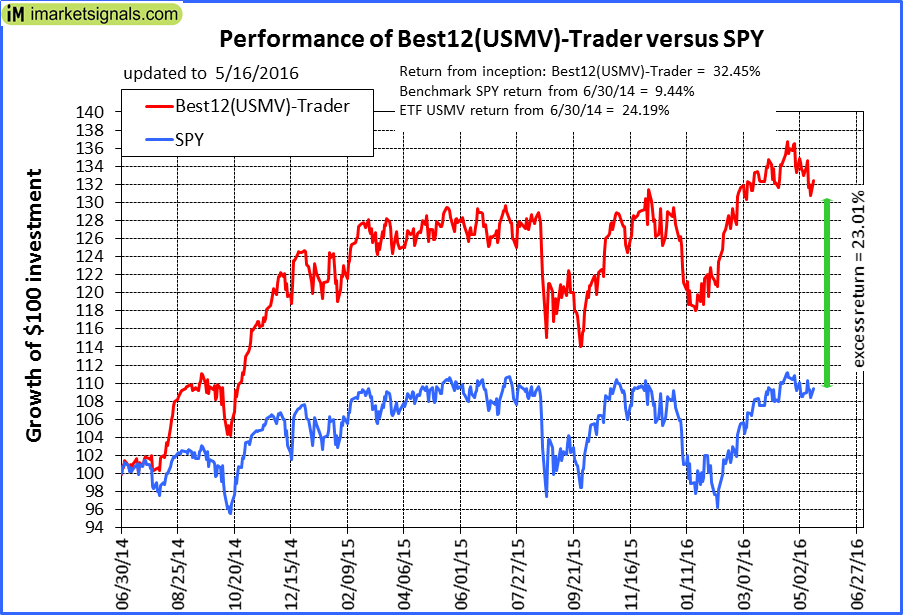 |
iM-Best12(USMV)-Trader: The model’s out of sample performance YTD is 2.5%, and for the last 12 months is 1.5%. Over the same period the benchmark SPY performance was 2.0% and -0.6% respectively. Since inception, on 7/1/2014, the model gained 30.68% while the benchmark SPY gained 9.44% and the ETF USMV gained 24.19% over the same period. Over the previous week the market value of iM-Best12(USMV)-Trader gained -2.41% at a time when SPY gained 0.43%. A starting capital of $100,000 at inception on 7/1/2014 would have grown to $130,685 which includes -$134 cash and excludes $1,932 spent on fees and slippage. |
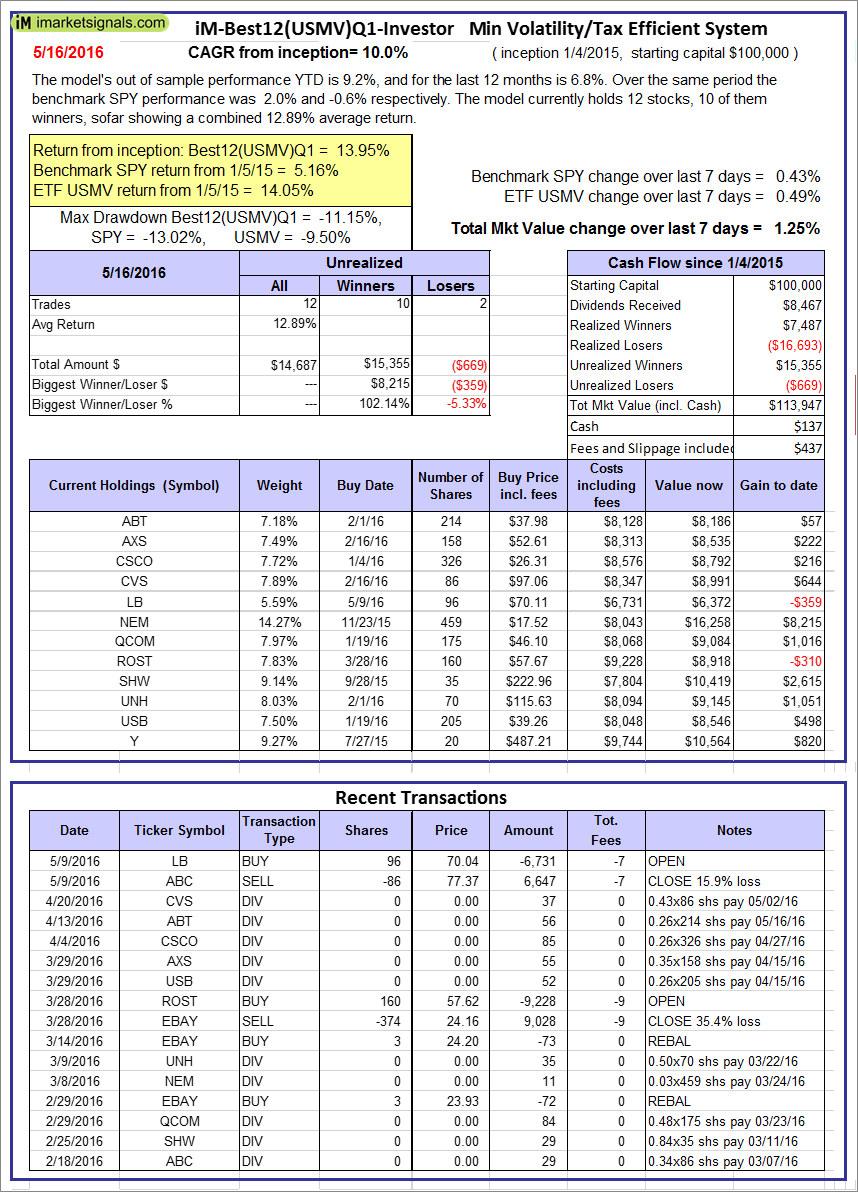 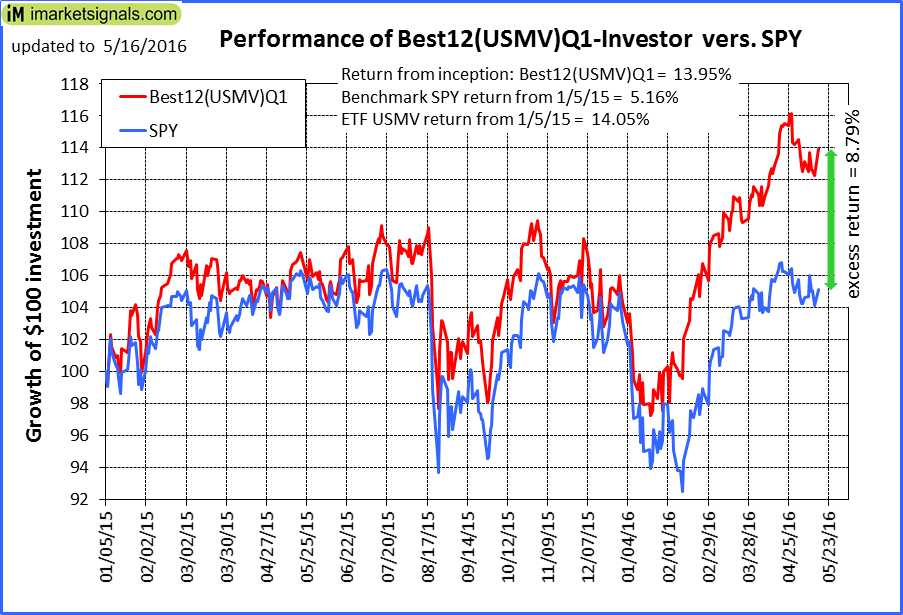 |
iM-Best12(USMV)Q1-Investor: The model’s out of sample performance YTD is 9.2%, and for the last 12 months is 6.8%. Over the same period the benchmark SPY performance was 2.0% and -0.6% respectively. Since inception, on 1/5/2015, the model gained 13.95% while the benchmark SPY gained 5.16% and the ETF USMV gained 14.05% over the same period. Over the previous week the market value of iM-Best12(USMV)Q1 gained 1.25% at a time when SPY gained 0.43%. A starting capital of $100,000 at inception on 1/5/2015 would have grown to $113,947 which includes $137 cash and excludes $437 spent on fees and slippage. |
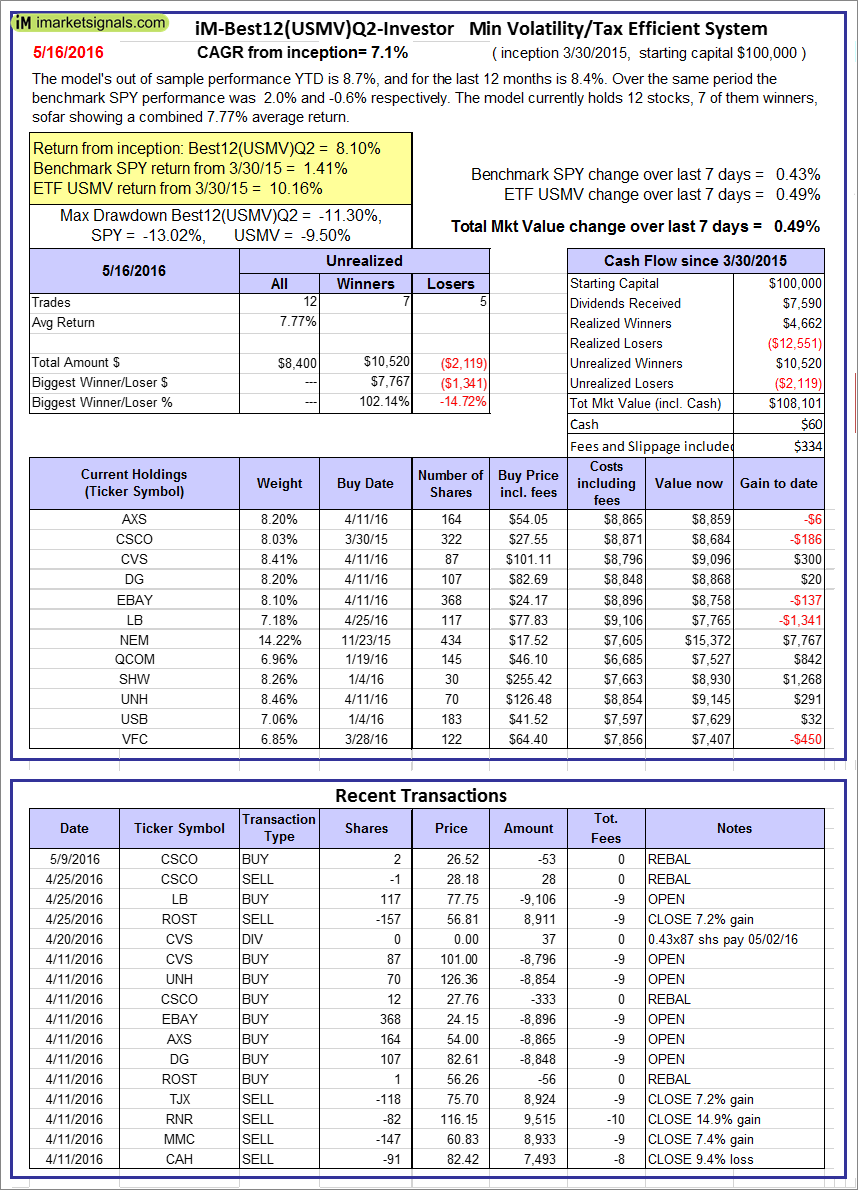 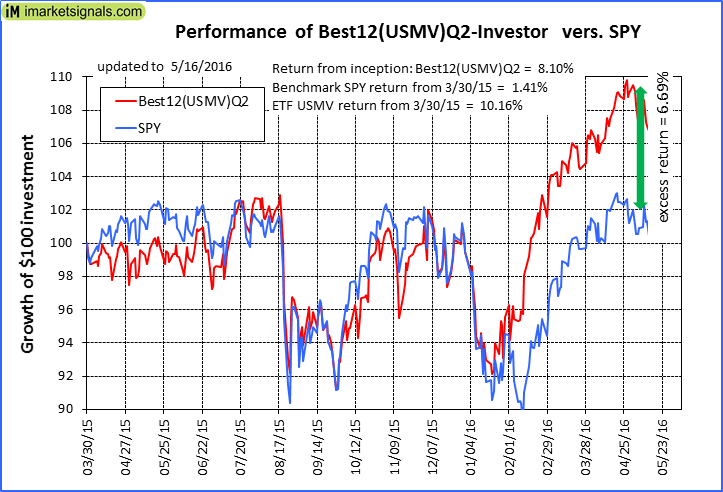 |
iM-Best12(USMV)Q2-Investor: The model’s out of sample performance YTD is 8.7%, and for the last 12 months is 8.4%. Over the same period the benchmark SPY performance was 2.0% and -0.6% respectively. Since inception, on 3/31/2015, the model gained 8.10% while the benchmark SPY gained 1.41% and the ETF USMV gained 10.16% over the same period. Over the previous week the market value of iM-Best12(USMV)Q2 gained 0.49% at a time when SPY gained 0.43%. A starting capital of $100,000 at inception on 3/31/2015 would have grown to $108,101 which includes $60 cash and excludes $334 spent on fees and slippage. |
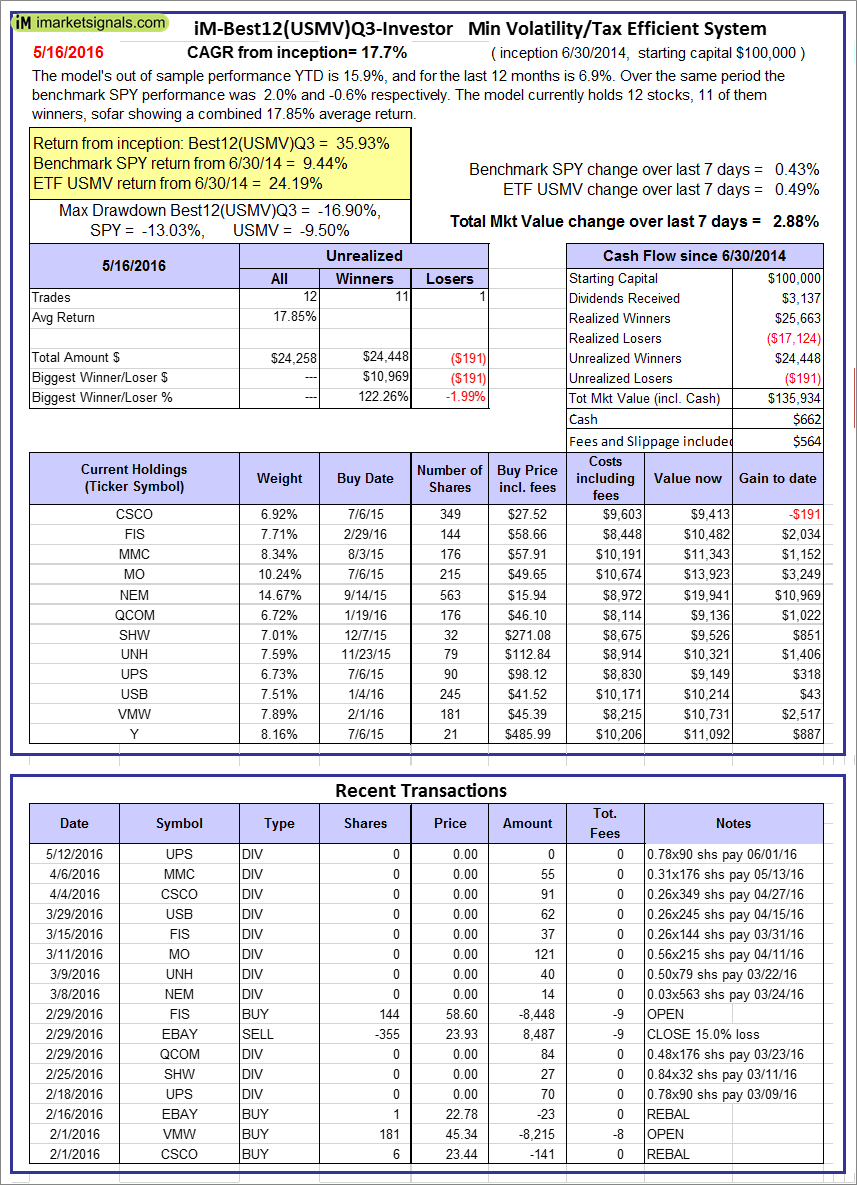 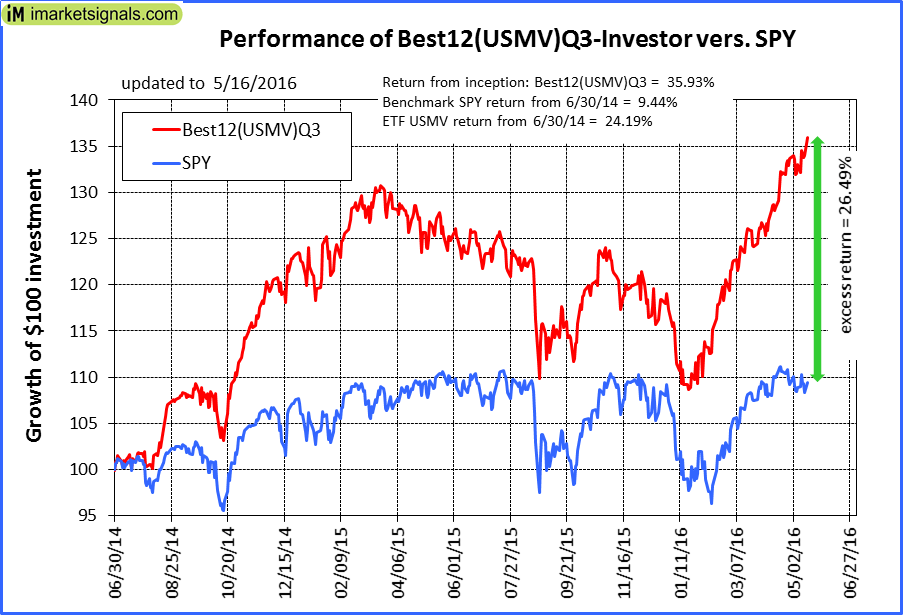 |
iM-Best12(USMV)Q3-Investor: The model’s out of sample performance YTD is 15.9%, and for the last 12 months is 6.9%. Over the same period the benchmark SPY performance was 2.0% and -0.6% respectively. Since inception, on 7/1/2014, the model gained 35.93% while the benchmark SPY gained 9.44% and the ETF USMV gained 24.19% over the same period. Over the previous week the market value of iM-Best12(USMV)Q3 gained 2.88% at a time when SPY gained 0.43%. A starting capital of $100,000 at inception on 7/1/2014 would have grown to $135,934 which includes $662 cash and excludes $564 spent on fees and slippage. |
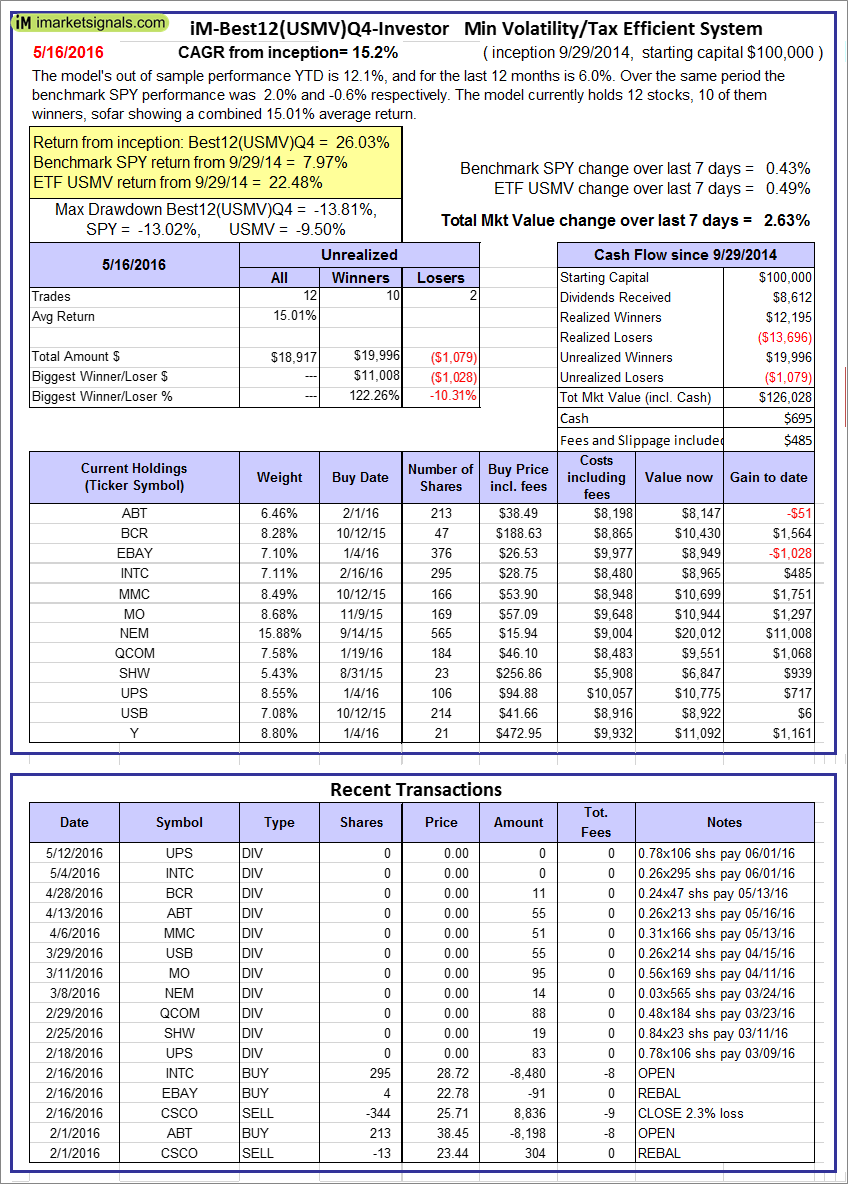 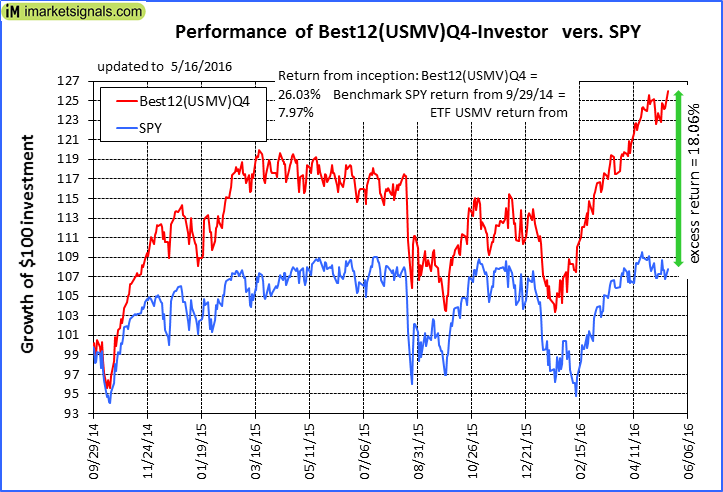 |
iM-Best12(USMV)Q4-Investor: Since inception, on 9/30/2014, the model gained 26.03% while the benchmark SPY gained 7.97% and the ETF USMV gained 22.48% over the same period. Over the previous week the market value of iM-Best12(USMV)Q4 gained 2.63% at a time when SPY gained 0.43%. A starting capital of $100,000 at inception on 9/30/2014 would have grown to $126,028 which includes $695 cash and excludes $485 spent on fees and slippage. |
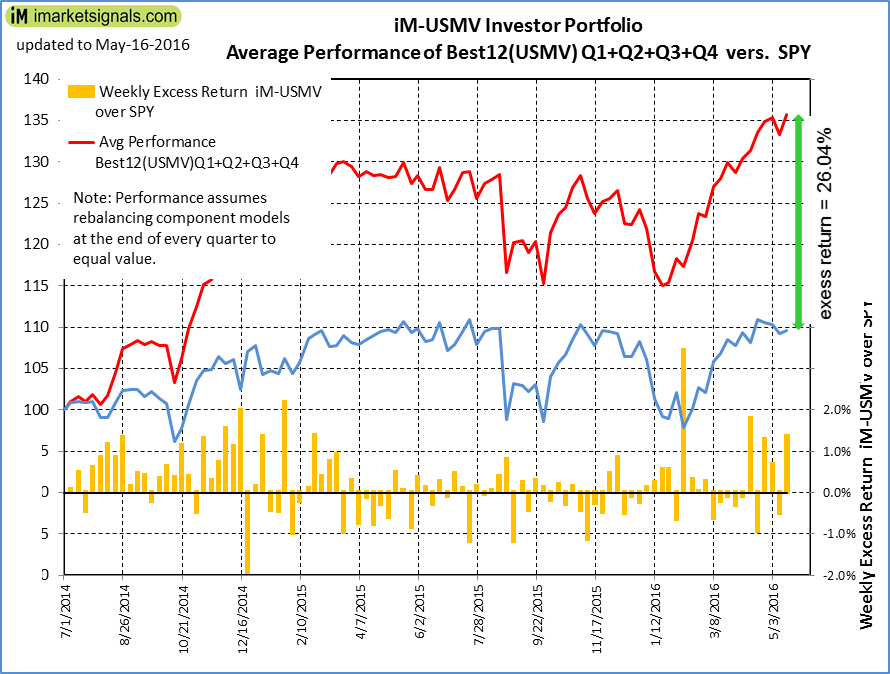 |
Average Performance of iM-Best12(USMV)Q1+Q2+Q3+Q4-Investor resulted in an excess return of 26.04% over SPY. (see iM-USMV Investor Portfolio) |
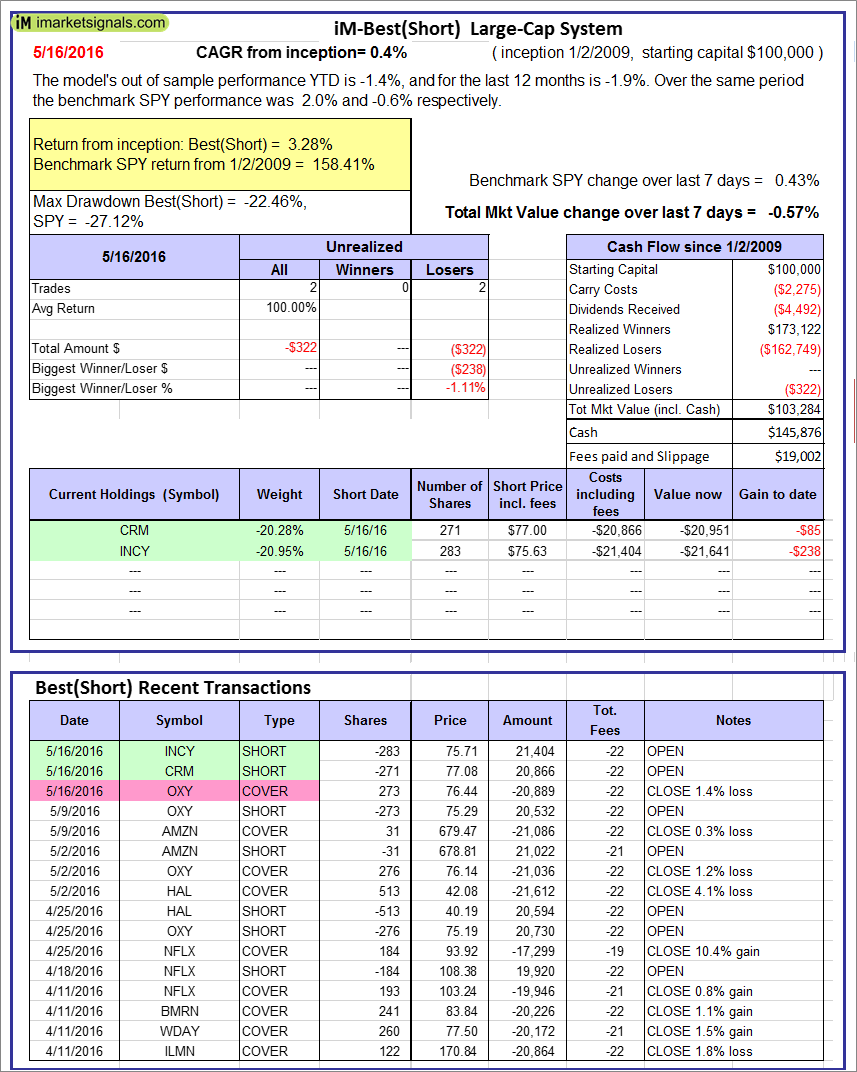 |
iM-Best(Short): The model’s out of sample performance YTD is -1.4%, and for the last 12 months is -1.9%. Over the same period the benchmark SPY performance was 2.0% and -0.6% respectively. Over the previous week the market value of iM-Best(Short) gained -0.57% at a time when SPY gained 0.43%. Over the period 1/2/2009 to 5/16/2016 the starting capital of $100,000 would have grown to $103,284 which includes $145,876 cash and excludes $19,002 spent on fees and slippage. |
iM-Best Reports – 5/16/2016
Posted in pmp SPY-SH
Leave a Reply
You must be logged in to post a comment.