
  |
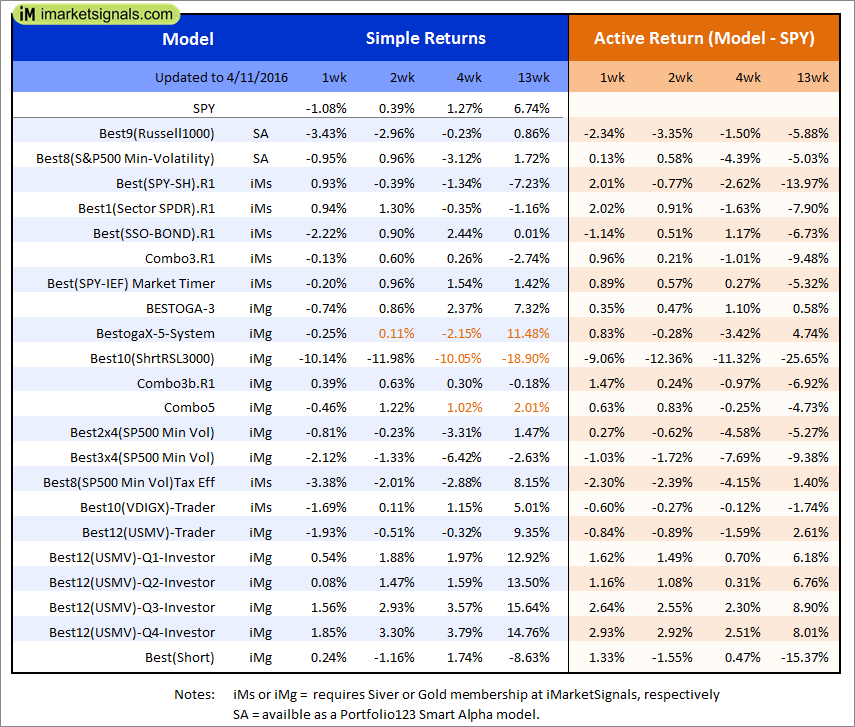
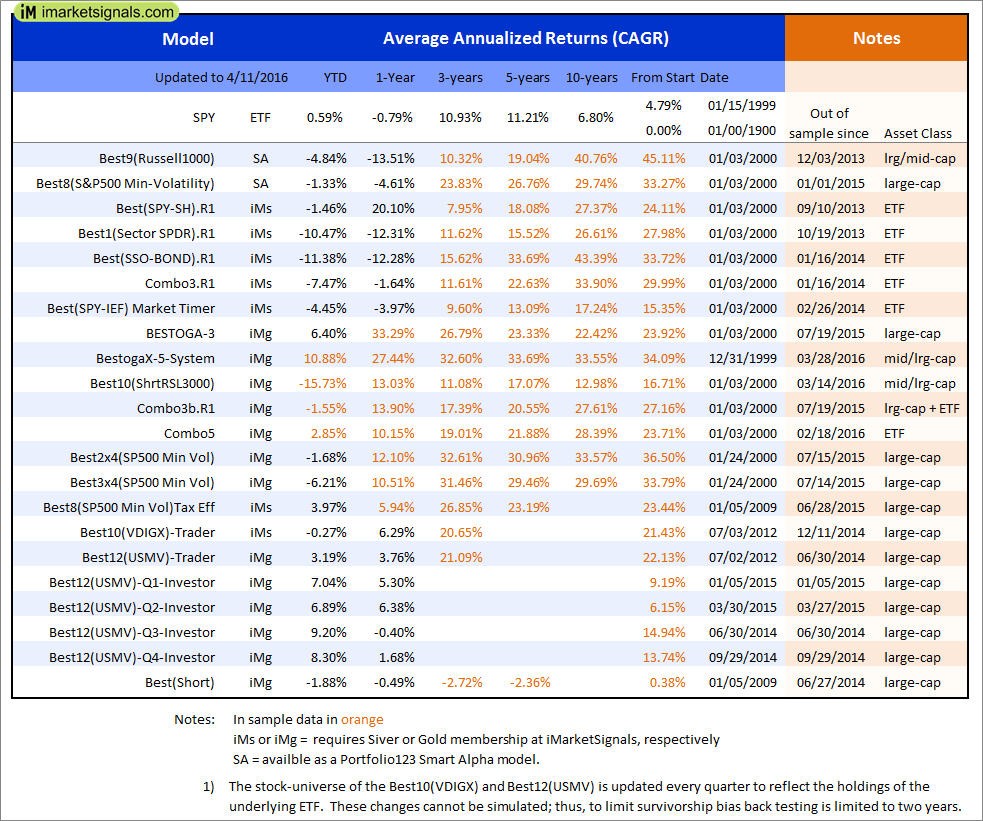
Out of sample performance summary of our models for the past 1, 2, 4 and 13 week periods. The active active return indicates how the models over- or underperformed the benchmark ETF SPY. Also the YTD, and the 1-, 3-, 5- and 10-year annualized returns are shown in the second table |
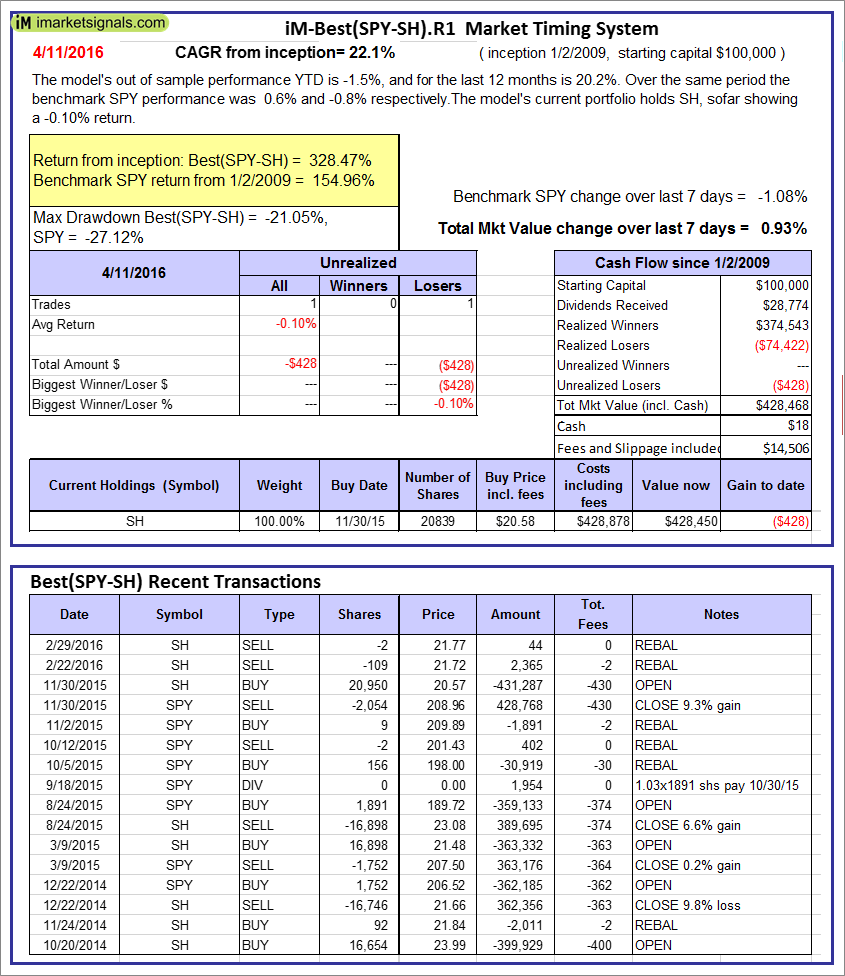 |
iM-Best(SPY-SH).R1: The model’s out of sample performance YTD is -1.5%, and for the last 12 months is 20.2%. Over the same period the benchmark SPY performance was 0.6% and -0.8% respectively. Over the previous week the market value of Best(SPY-SH) gained 0.93% at a time when SPY gained -1.08%. A starting capital of $100,000 at inception on 1/2/2009 would have grown to $428,468 which includes $18 cash and excludes $14,506 spent on fees and slippage. |
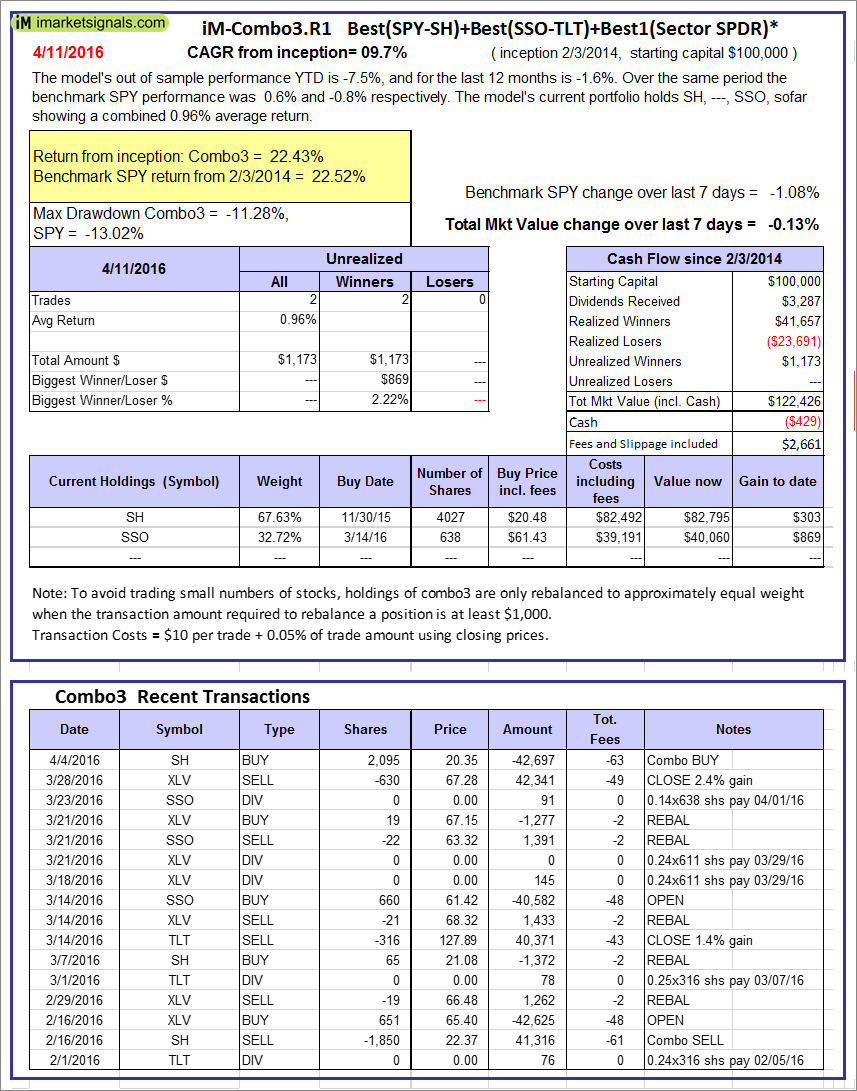 |
iM-Combo3.R1: The model’s out of sample performance YTD is -7.5%, and for the last 12 months is -1.6%. Over the same period the benchmark SPY performance was 0.6% and -0.8% respectively. Over the previous week the market value of iM-Combo3.R1 gained -0.13% at a time when SPY gained -1.08%. A starting capital of $100,000 at inception on 2/3/2014 would have grown to $122,426 which includes -$429 cash and excludes $2,661 spent on fees and slippage. |
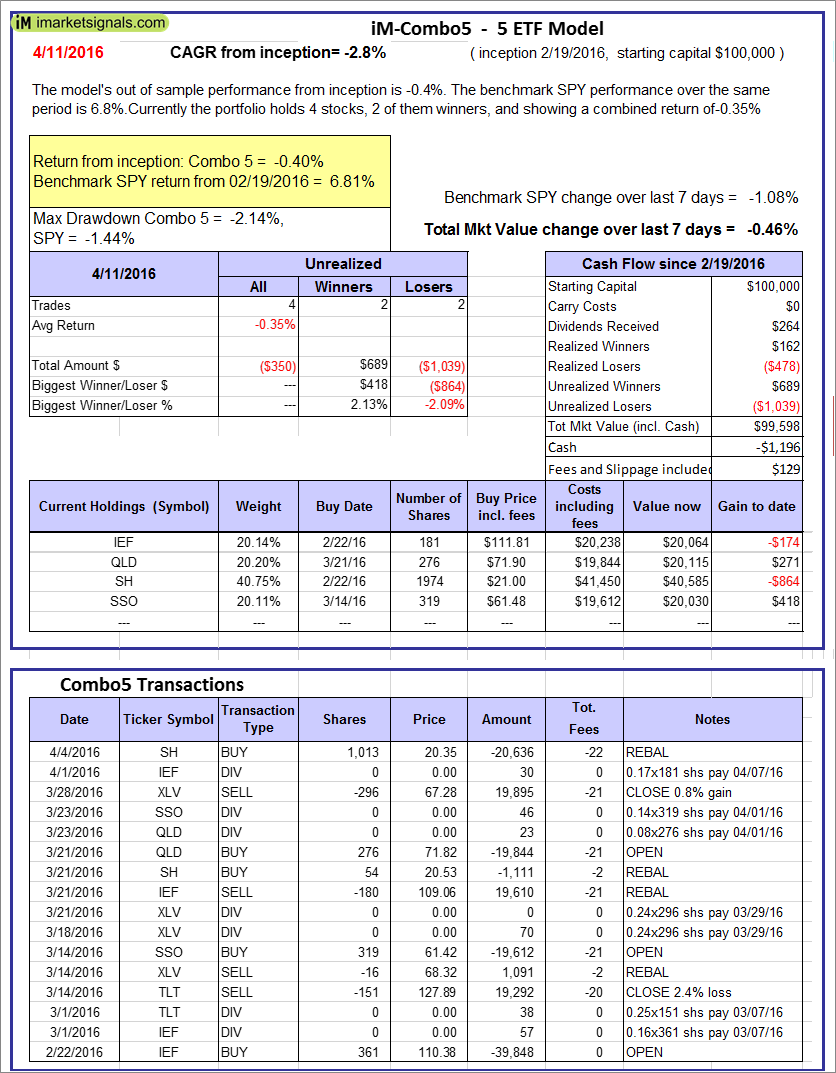 |
iM-Combo5: The model’s out of sample performance from inception is -0.4%. The benchmark SPY performance over the same period is 6.8%. Over the previous week the market value of iM-Combo5 gained -0.46% at a time when SPY gained -1.08%. A starting capital of $100,000 at inception on 2/22/2016 would have grown to $99,598 which includes -$1,196 cash and excludes $129 spent on fees and slippage. |
 |
The iM-Best8(S&P500 Min Vol)Tax-Efficient The model’s out of sample performance YTD is 4.0%, and for the last 12 months is 5.9%. Over the same period the benchmark SPY performance was 0.6% and -0.8% respectively. Over the previous week the market value of iM-Best8(S&P 500)Tax-Eff. gained -3.38% at a time when SPY gained -1.08%. A starting capital of $100,000 at inception on 1/2/2009 would have grown to $463,037 which includes $1,806 cash and excludes $6,294 spent on fees and slippage. |
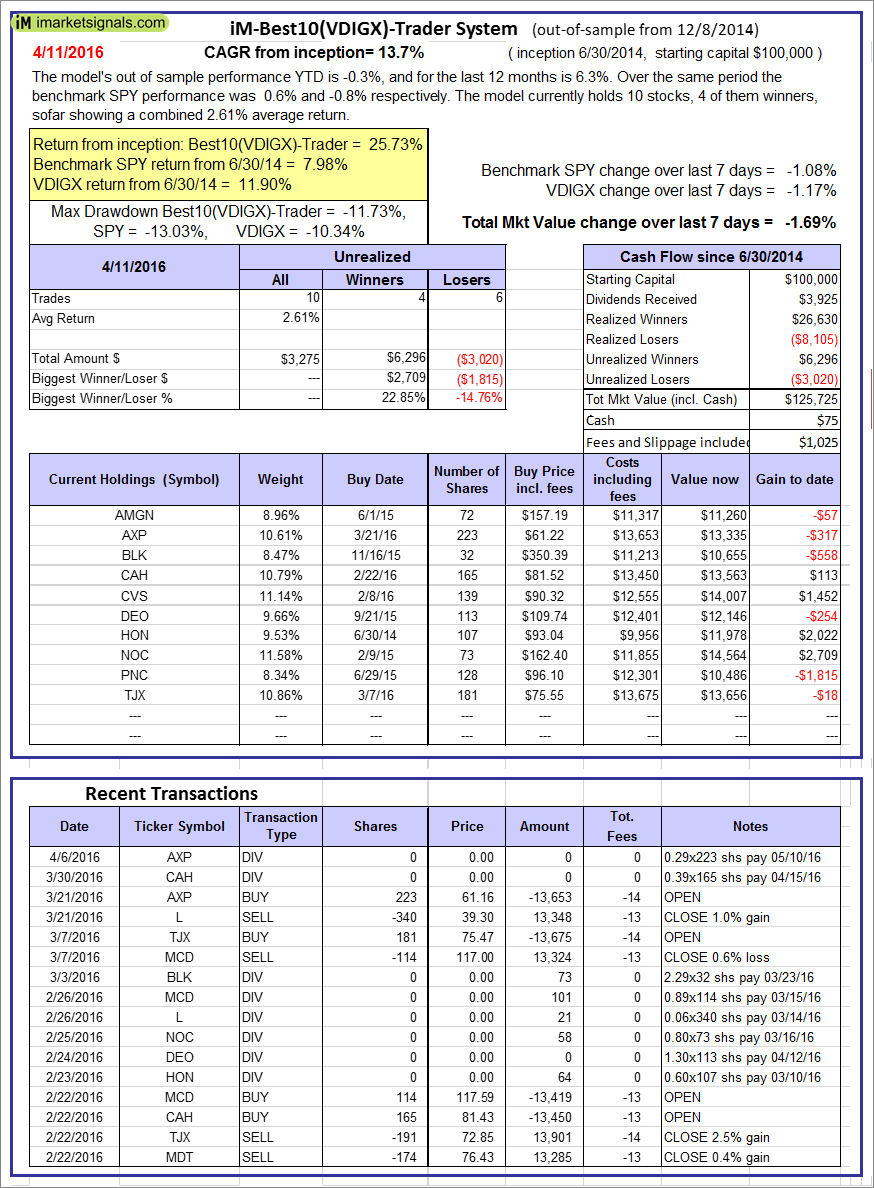  |
iM-Best10(VDIGX)-Trader: The model’s out of sample performance YTD is -0.3%, and for the last 12 months is 6.3%. Over the same period the benchmark SPY performance was 0.6% and -0.8% respectively. Since inception, on 7/1/2014, the model gained 25.73% while the benchmark SPY gained 7.98% and the ETF VDIGX gained 11.90% over the same period. Over the previous week the market value of iM-Best10(VDIGX) gained -1.69% at a time when SPY gained -1.08%. A starting capital of $100,000 at inception on 7/1/2014 would have grown to $125,725 which includes $75 cash and excludes $1,025 spent on fees and slippage. |
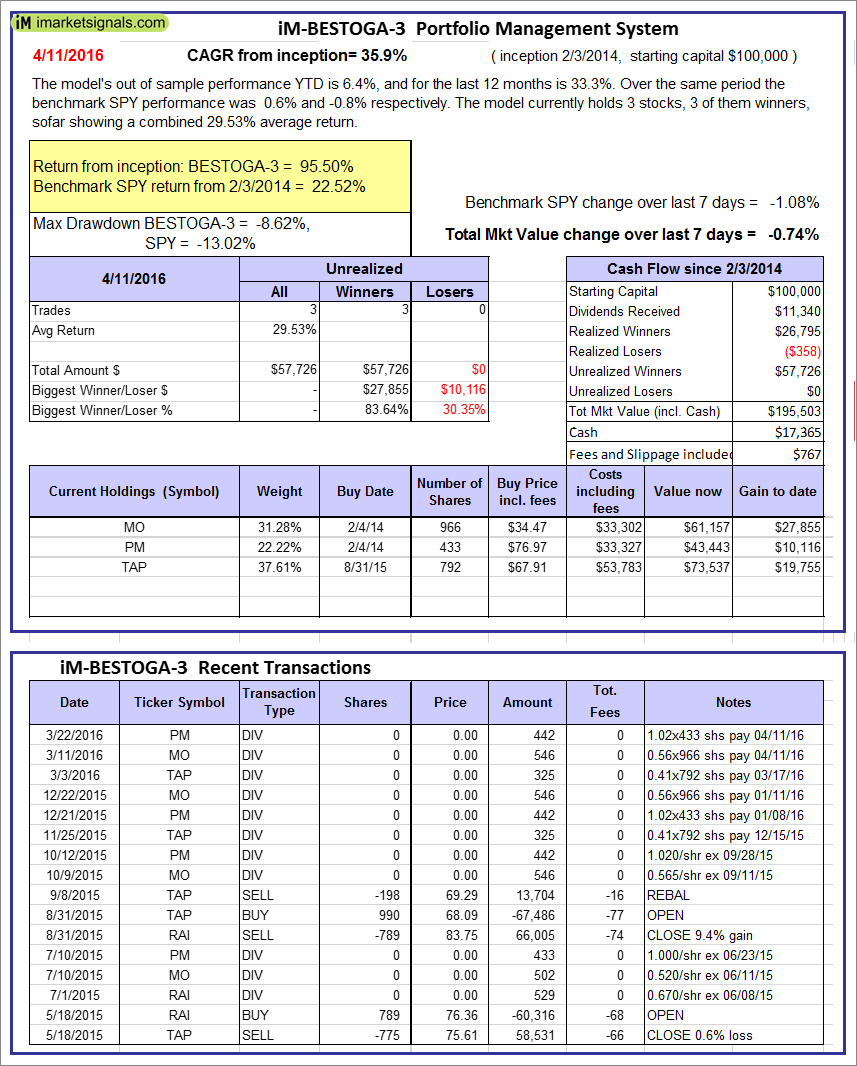 |
iM-BESTOGA-3: The model’s out of sample performance YTD is 6.4%, and for the last 12 months is 33.3%. Over the same period the benchmark SPY performance was 0.6% and -0.8% respectively. Over the previous week the market value of iM-BESTOGA-3 gained -0.74% at a time when SPY gained -1.08%. A starting capital of $100,000 at inception on 2/3/2014 would have grown to $195,503 which includes $17,365 cash and excludes $767 spent on fees and slippage. |
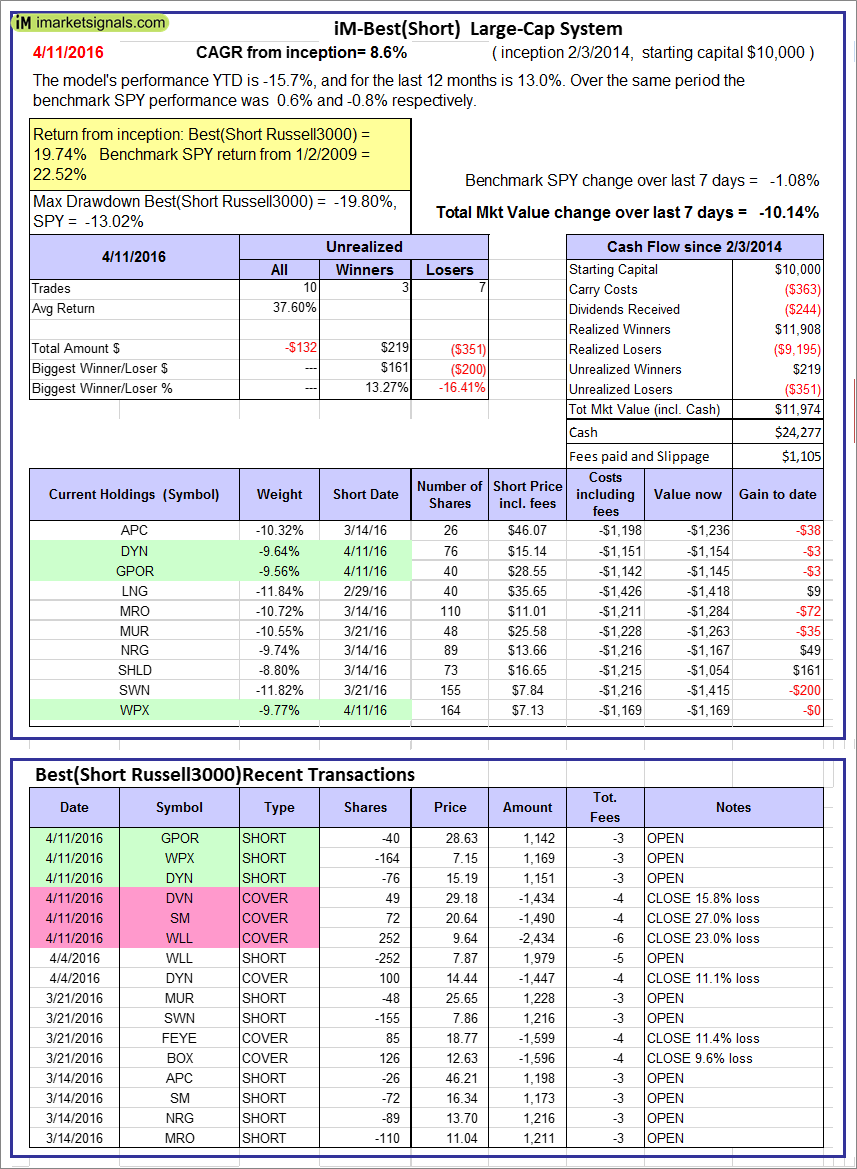 |
iM-Best10(Short Russell3000): The model’s performance YTD is -15.7%, and for the last 12 months is 13.0%. Over the same period the benchmark SPY performance was 0.6% and -0.8% respectively. Over the previous week the market value of iM-Best10(Short Russell3000) gained -10.14% at a time when SPY gained -1.08%. Over the period 2/3/2014 to 4/11/2016 the starting capital of $100,000 would have grown to $11,974 which includes $24,277 cash and excludes $1,105 spent on fees and slippage. |
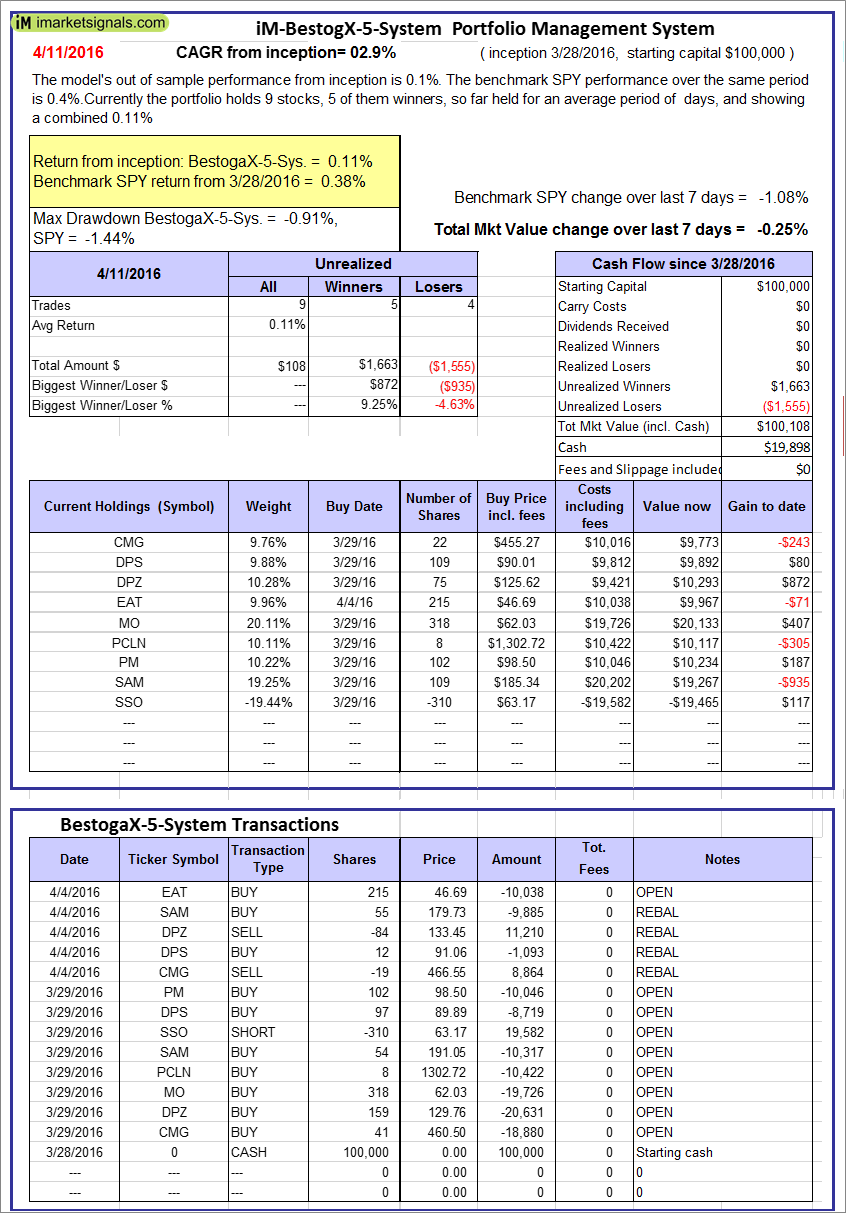 |
iM-BestogaX5-System: The model’s out of sample performance from inception is 0.1%. The benchmark SPY performance over the same period is 0.4%. Over the previous week the market value of iM-Best8(S&P 500)Tax-Eff. gained -0.25% at a time when SPY gained -1.08%. A starting capital of $100,000 at inception on 1/2/2009 would have grown to $100,108 which includes $19,898 cash and excludes $00 spent on fees and slippage. |
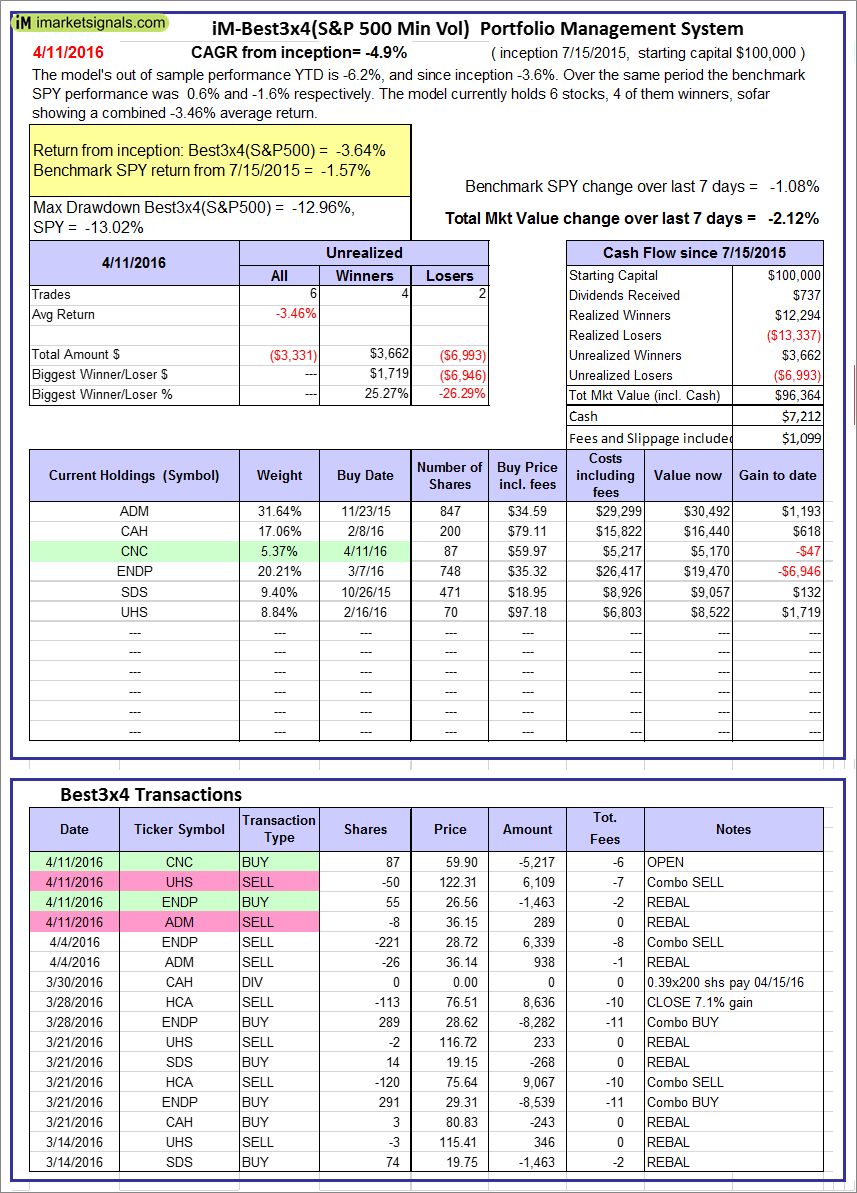 |
iM-Best3x4(S&P 500 Min Vol): The model’s out of sample performance YTD is -6.2%, and since inception -3.6%. Over the same period the benchmark SPY performance was 0.6% and -1.6% respectively. Over the previous week the market value of iM-Best3x4 gained -2.12% at a time when SPY gained -1.08%. A starting capital of $100,000 at inception on 7/15/2015 would have grown to $96,364 which includes $7,212 cash and excludes $1,099 spent on fees and slippage. |
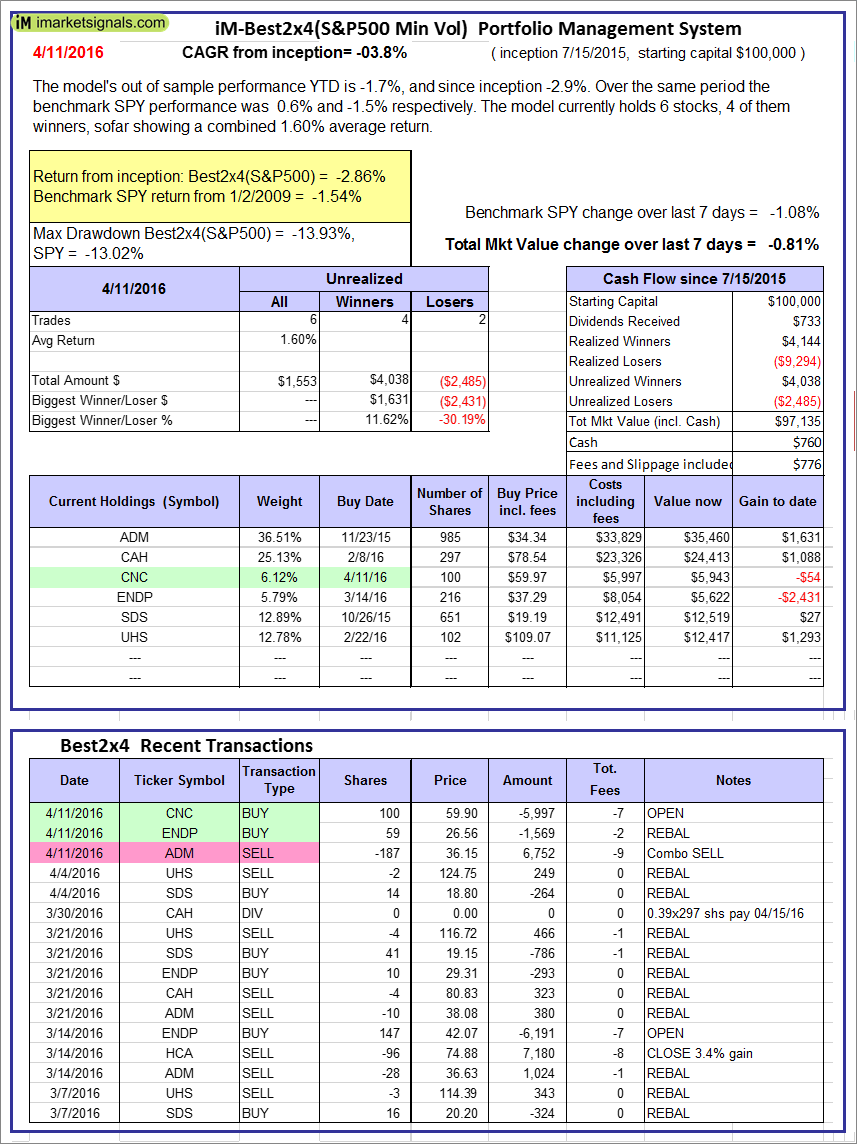 |
iM-Best2x4(S&P 500 Min Vol): The model’s out of sample performance YTD is -1.7%, and since inception -2.9%. Over the same period the benchmark SPY performance was 0.6% and -1.5% respectively. Over the previous week the market value of iM-Best2x4 gained -0.81% at a time when SPY gained -1.08%. A starting capital of $100,000 at inception on 7/16/2015 would have grown to $97,135 which includes $760 cash and excludes $776 spent on fees and slippage. |
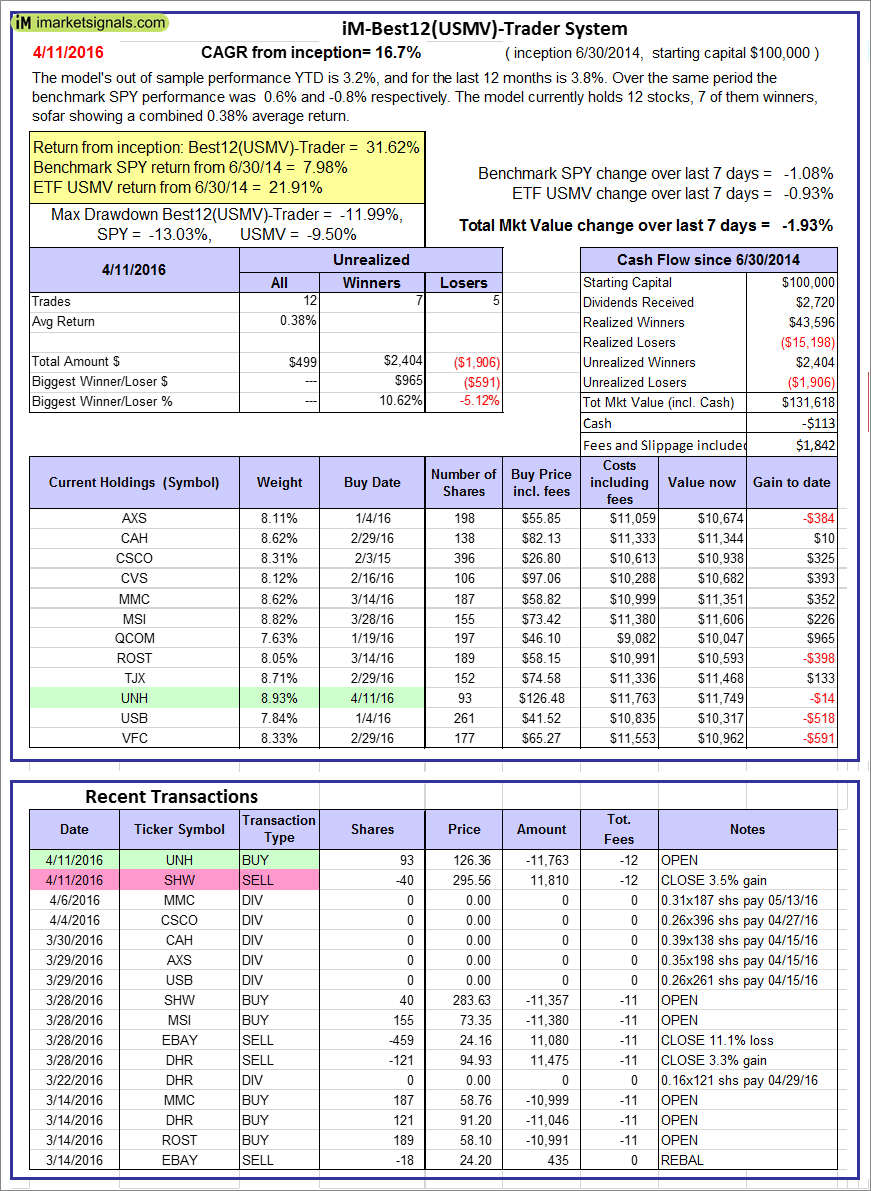 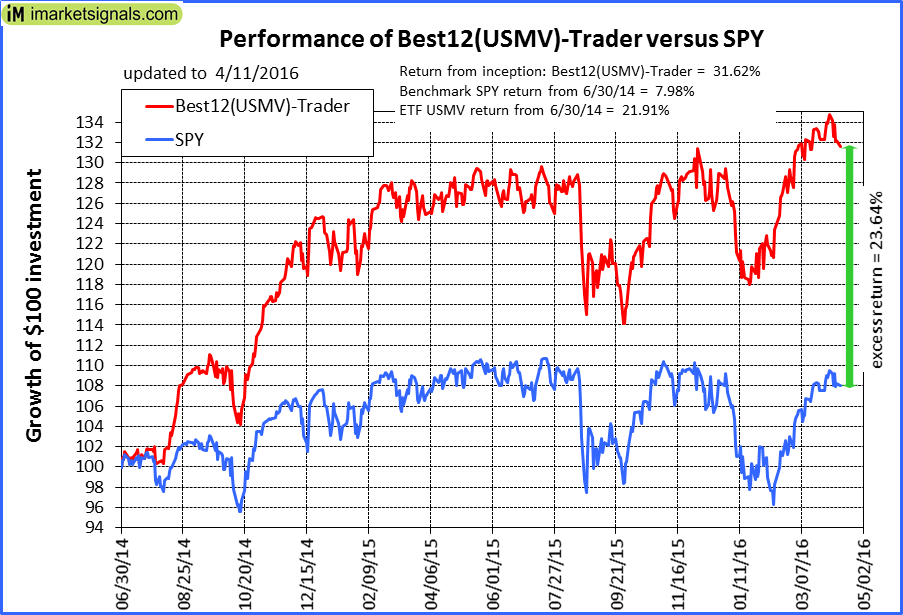 |
iM-Best12(USMV)-Trader: The model’s out of sample performance YTD is 3.2%, and for the last 12 months is 3.8%. Over the same period the benchmark SPY performance was 0.6% and -0.8% respectively. Since inception, on 7/1/2014, the model gained 31.62% while the benchmark SPY gained 7.98% and the ETF USMV gained 21.91% over the same period. Over the previous week the market value of iM-Best12(USMV)-Trader gained -1.93% at a time when SPY gained -1.08%. A starting capital of $100,000 at inception on 7/1/2014 would have grown to $131,618 which includes -$113 cash and excludes $1,842 spent on fees and slippage. |
 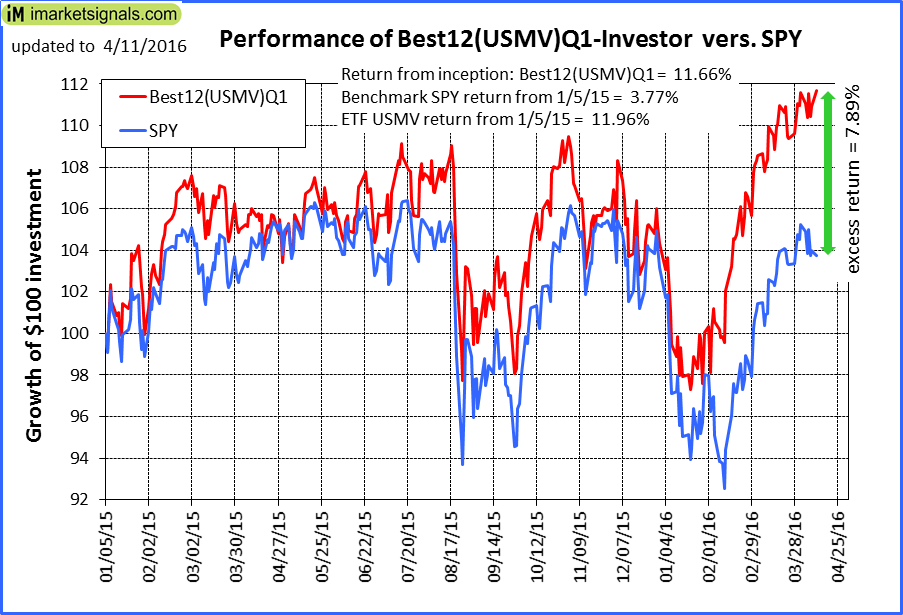 |
iM-Best12(USMV)Q1-Investor: The model’s out of sample performance YTD is 7.0%, and for the last 12 months is 5.3%. Over the same period the benchmark SPY performance was 0.6% and -0.8% respectively. Since inception, on 1/5/2015, the model gained 11.66% while the benchmark SPY gained 3.77% and the ETF USMV gained 11.96% over the same period. Over the previous week the market value of iM-Best12(USMV)Q1 gained 0.54% at a time when SPY gained -1.08%. A starting capital of $100,000 at inception on 1/5/2015 would have grown to $111,658 which includes -$65 cash and excludes $423 spent on fees and slippage. |
 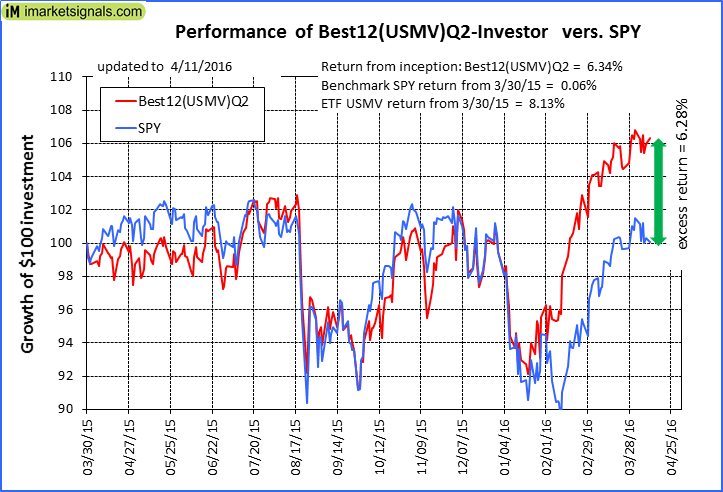 |
iM-Best12(USMV)Q2-Investor: The model’s out of sample performance YTD is 6.9%, and for the last 12 months is 6.4%. Over the same period the benchmark SPY performance was 0.6% and -0.8% respectively. Since inception, on 3/31/2015, the model gained 6.34% while the benchmark SPY gained 0.06% and the ETF USMV gained 8.13% over the same period. Over the previous week the market value of iM-Best12(USMV)Q2 gained 0.07% at a time when SPY gained -1.08%. A starting capital of $100,000 at inception on 3/31/2015 would have grown to $106,336 which includes $35 cash and excludes $316 spent on fees and slippage. |
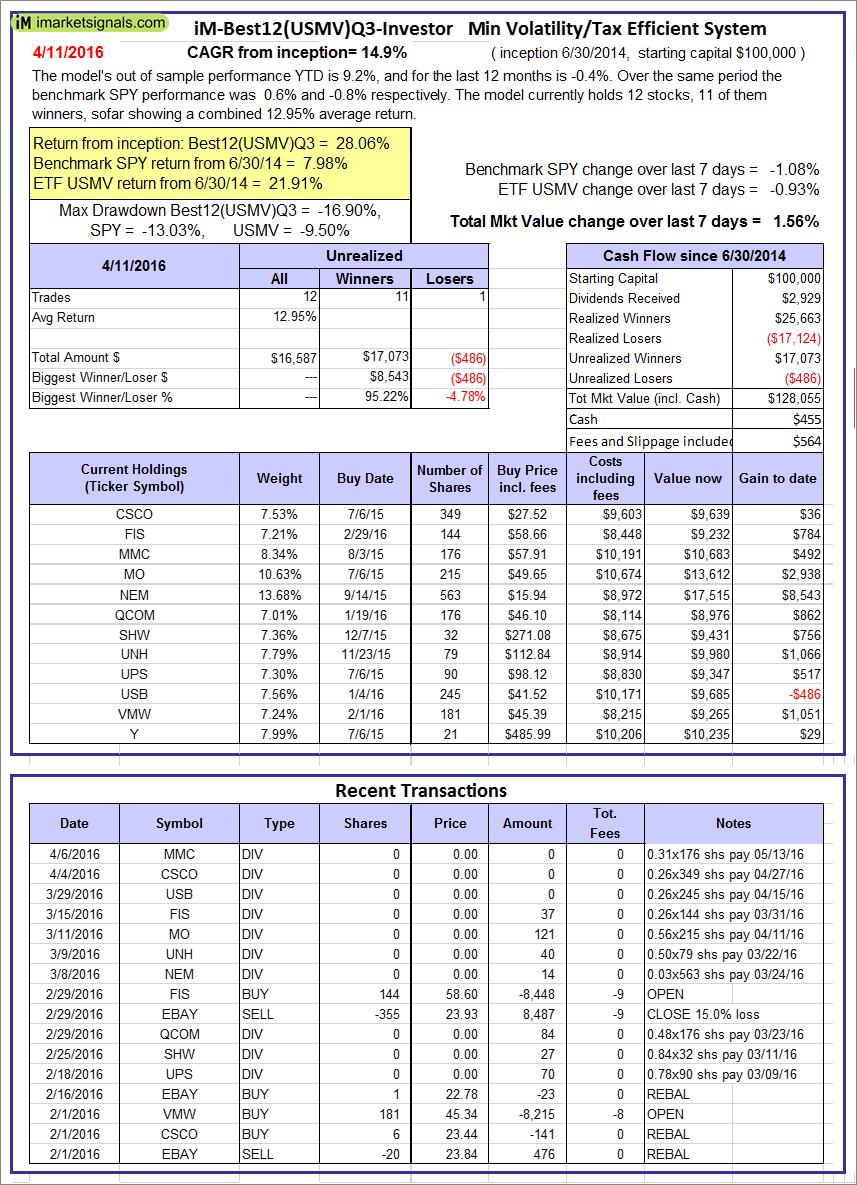 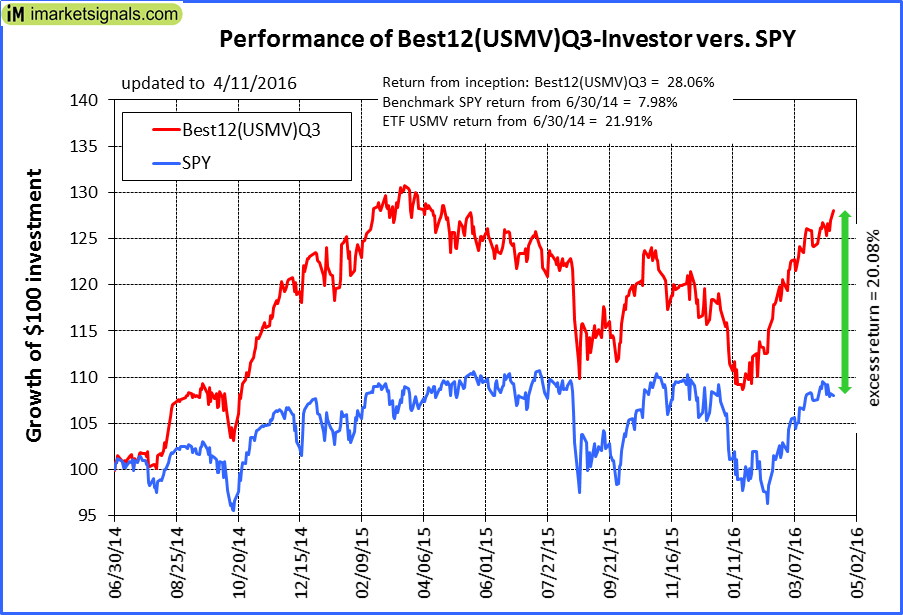 |
iM-Best12(USMV)Q3-Investor: The model’s out of sample performance YTD is 9.2%, and for the last 12 months is -0.4%. Over the same period the benchmark SPY performance was 0.6% and -0.8% respectively. Since inception, on 7/1/2014, the model gained 28.06% while the benchmark SPY gained 7.98% and the ETF USMV gained 21.91% over the same period. Over the previous week the market value of iM-Best12(USMV)Q3 gained 1.56% at a time when SPY gained -1.08%. A starting capital of $100,000 at inception on 7/1/2014 would have grown to $128,055 which includes $455 cash and excludes $564 spent on fees and slippage. |
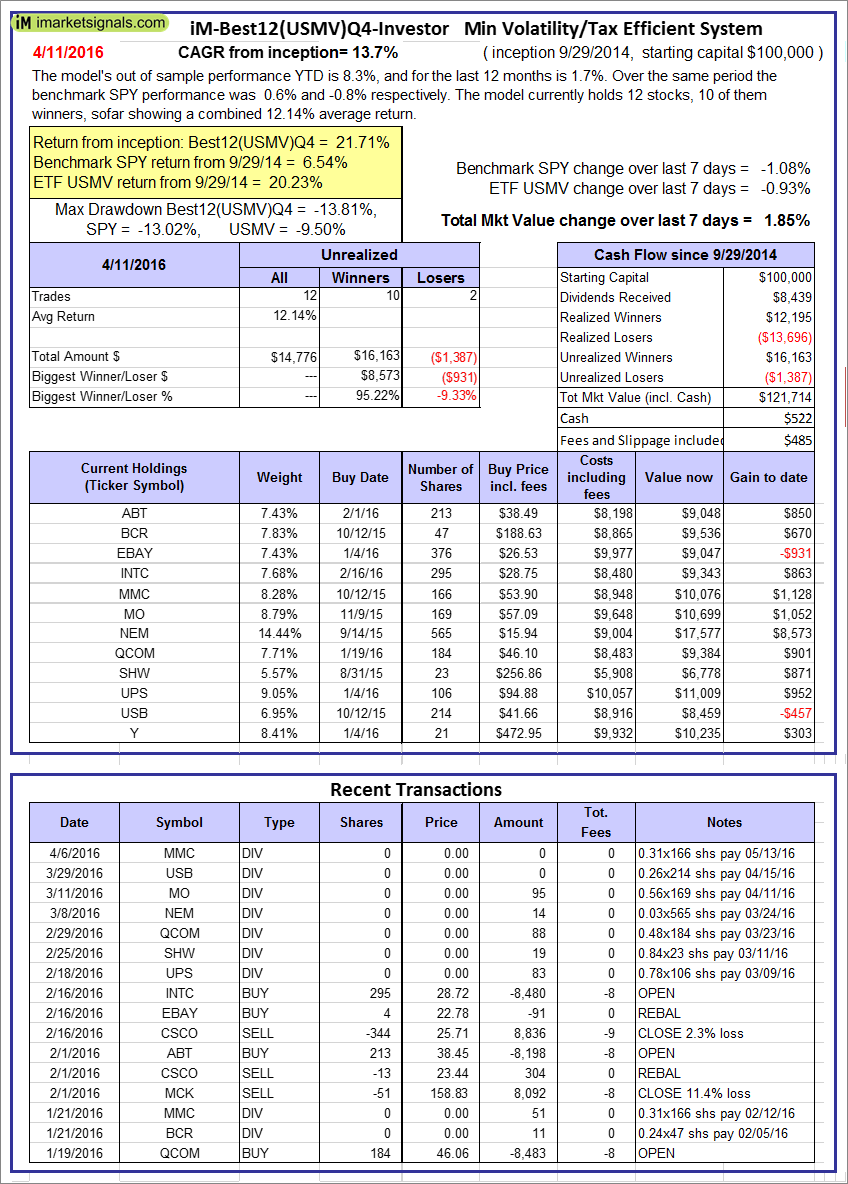  |
iM-Best12(USMV)Q4-Investor: Since inception, on 9/30/2014, the model gained 21.71% while the benchmark SPY gained 6.54% and the ETF USMV gained 20.23% over the same period. Over the previous week the market value of iM-Best12(USMV)Q4 gained 1.85% at a time when SPY gained -1.08%. A starting capital of $100,000 at inception on 9/30/2014 would have grown to $121,714 which includes $522 cash and excludes $485 spent on fees and slippage. |
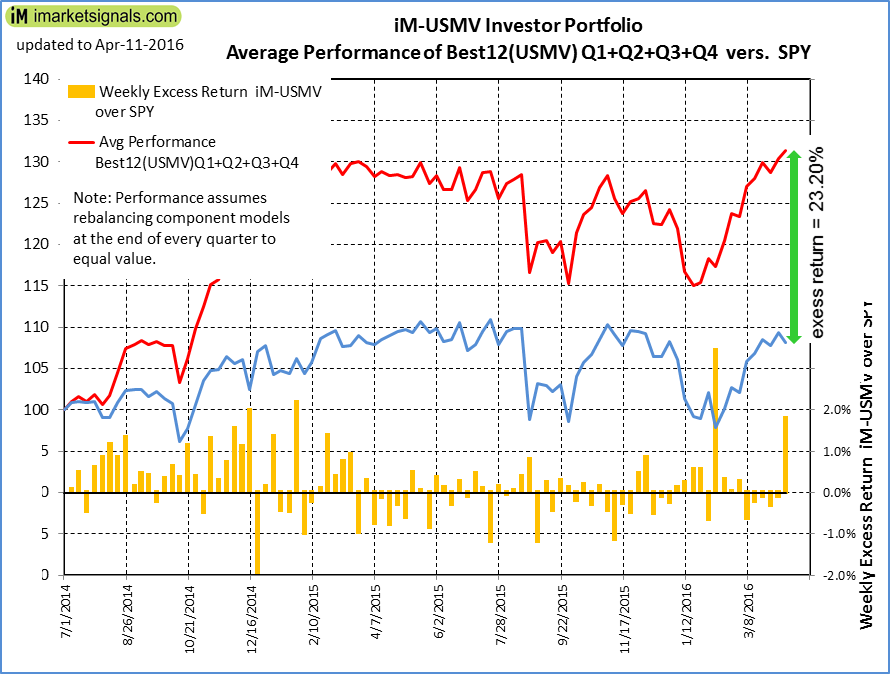 |
Average Performance of iM-Best12(USMV)Q1+Q2+Q3+Q4-Investor resulted in an excess return of 23.20% over SPY. (see iM-USMV Investor Portfolio) |
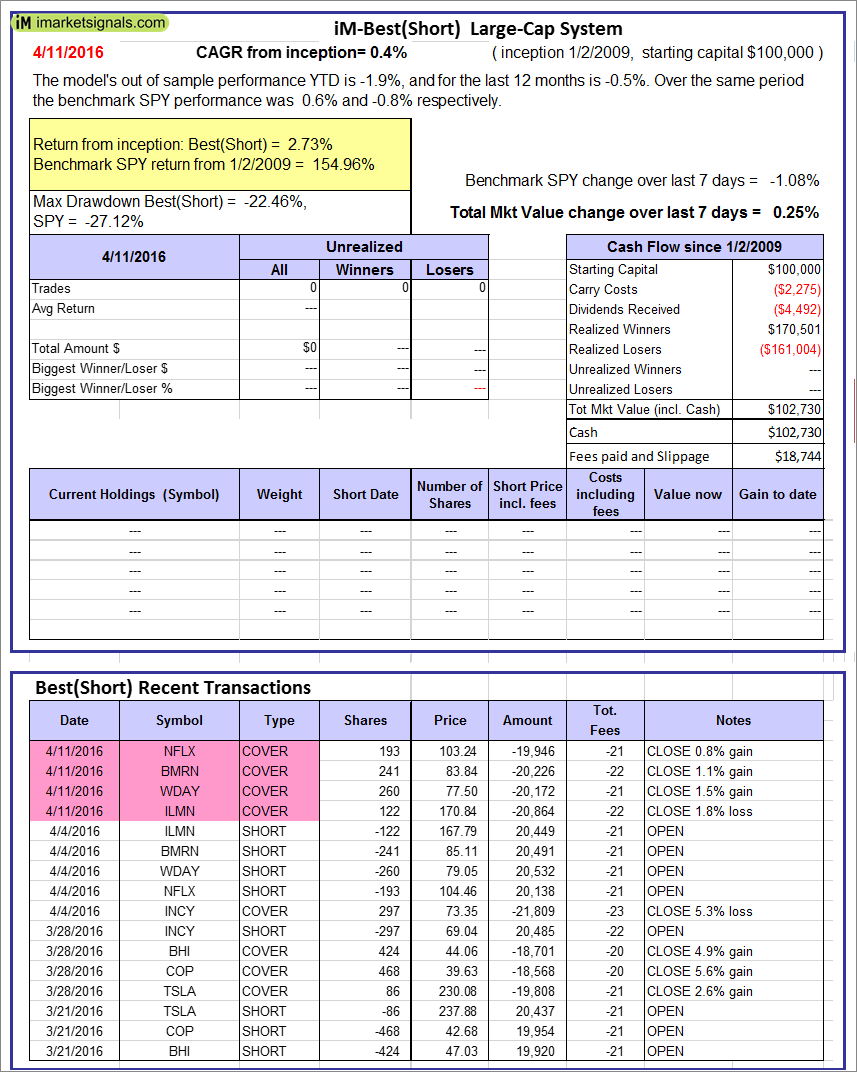 |
iM-Best(Short): The model’s out of sample performance YTD is -1.9%, and for the last 12 months is -0.5%. Over the same period the benchmark SPY performance was 0.6% and -0.8% respectively. Over the previous week the market value of iM-Best(Short) gained 0.25% at a time when SPY gained -1.08%. Over the period 1/2/2009 to 4/11/2016 the starting capital of $100,000 would have grown to $102,730 which includes $102,730 cash and excludes $18,744 spent on fees and slippage. |
iM-Best Reports – 4/12/2016
Posted in pmp SPY-SH
Leave a Reply
You must be logged in to post a comment.