
  |
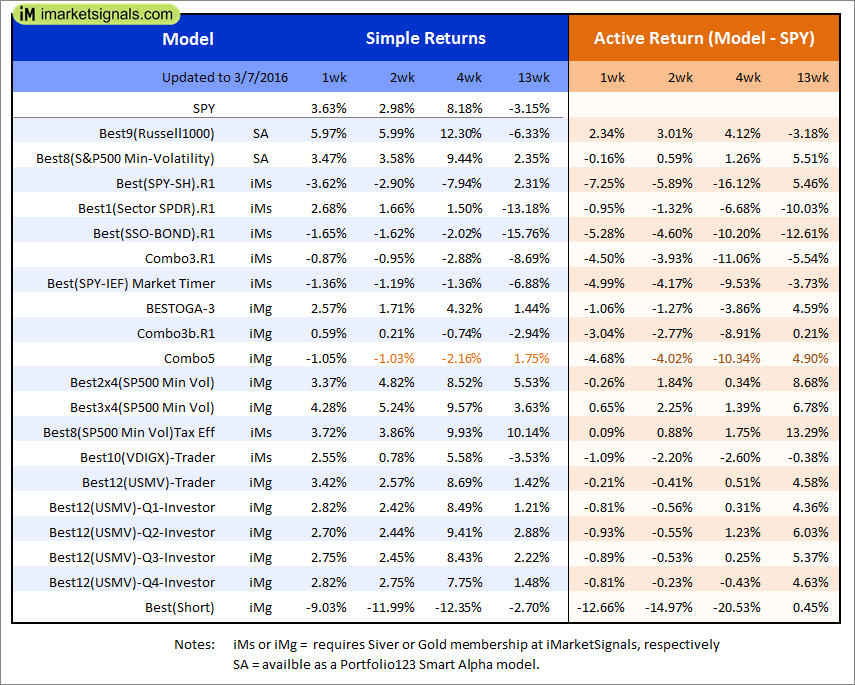
Out of sample performance summary of our models for the past 1, 2, 4 and 13 week periods. The active active return indicates how the models over- or underperformed the benchmark ETF SPY. Also the YTD, and the 1-, 3-, 5- and 10-year annualized returns are shown in the second table |
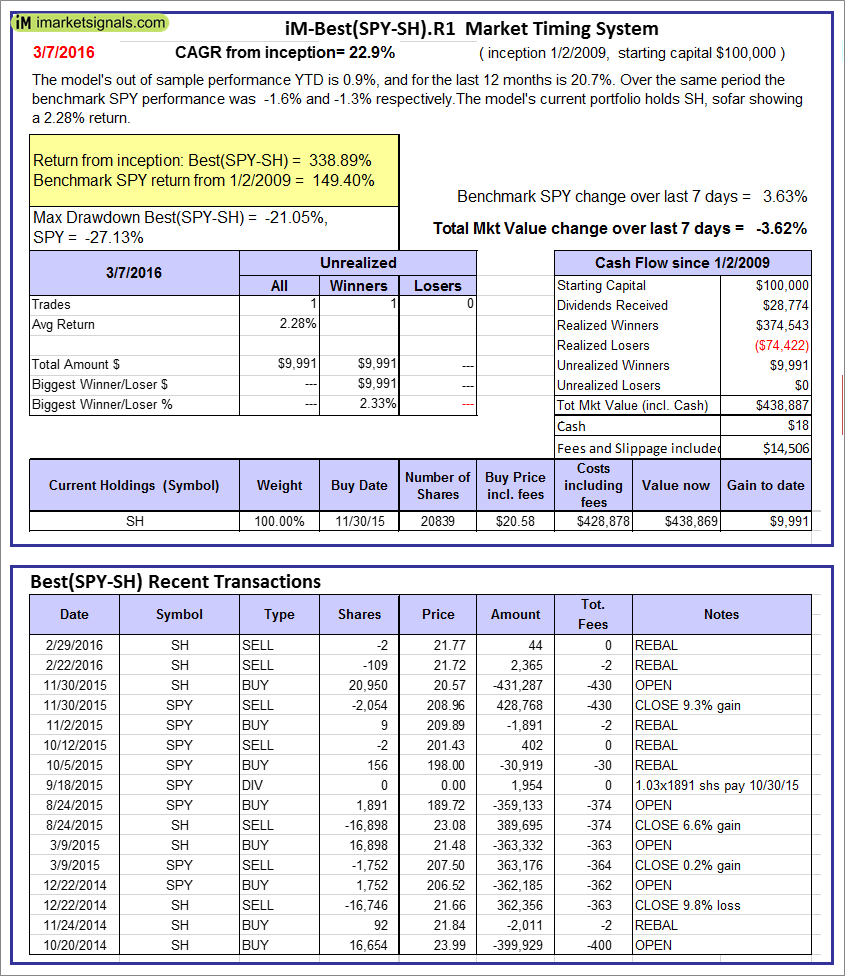 |
iM-Best(SPY-SH).R1: The model’s out of sample performance YTD is 0.9%, and for the last 12 months is 20.7%. Over the same period the benchmark SPY performance was -1.6% and -1.3% respectively. Over the previous week the market value of Best(SPY-SH) gained -3.62% at a time when SPY gained 3.63%. A starting capital of $100,000 at inception on 1/2/2009 would have grown to $438,887 which includes $18 cash and excludes $14,506 spent on fees and slippage. |
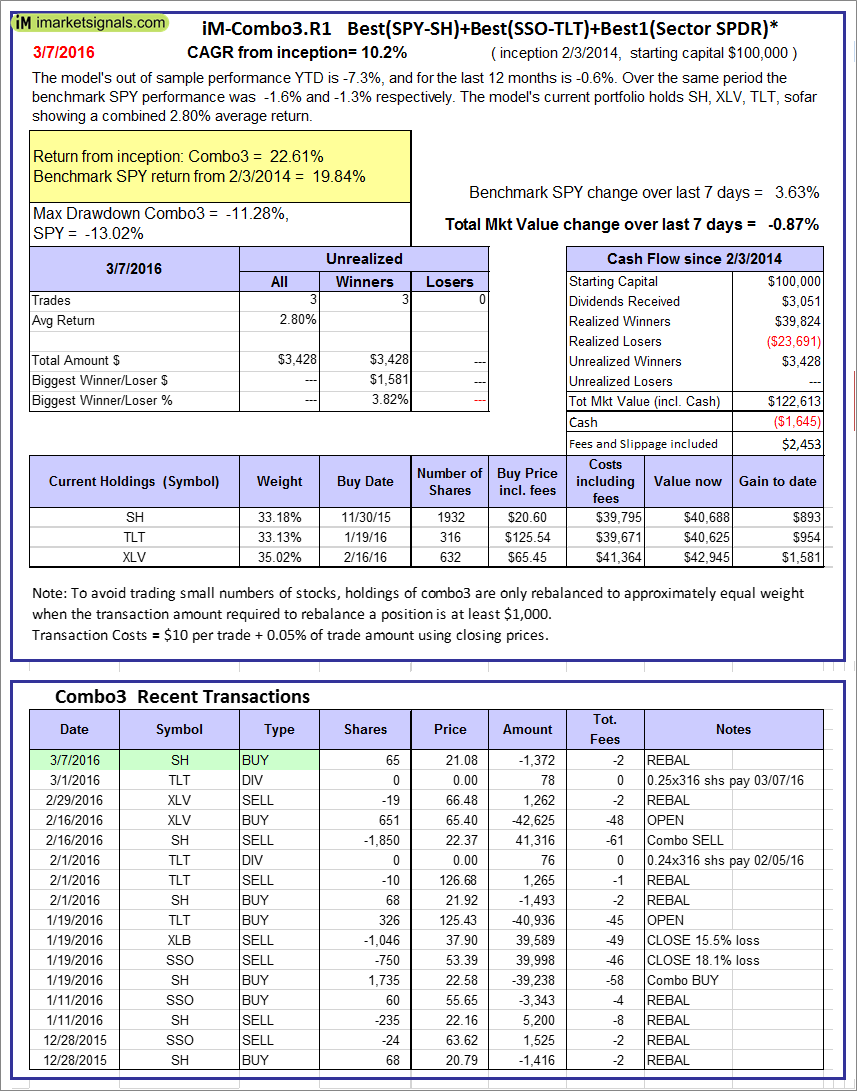 |
iM-Combo3.R1: The model’s out of sample performance YTD is -7.3%, and for the last 12 months is -0.6%. Over the same period the benchmark SPY performance was -1.6% and -1.3% respectively. Over the previous week the market value of iM-Combo-3 gained -0.87% at a time when SPY gained 3.63%[/iM]. A starting capital of $100,000 at inception on 2/3/2014 would have grown to $122,613 which includes -$1,645 cash and excludes $2,453 spent on fees and slippage. |
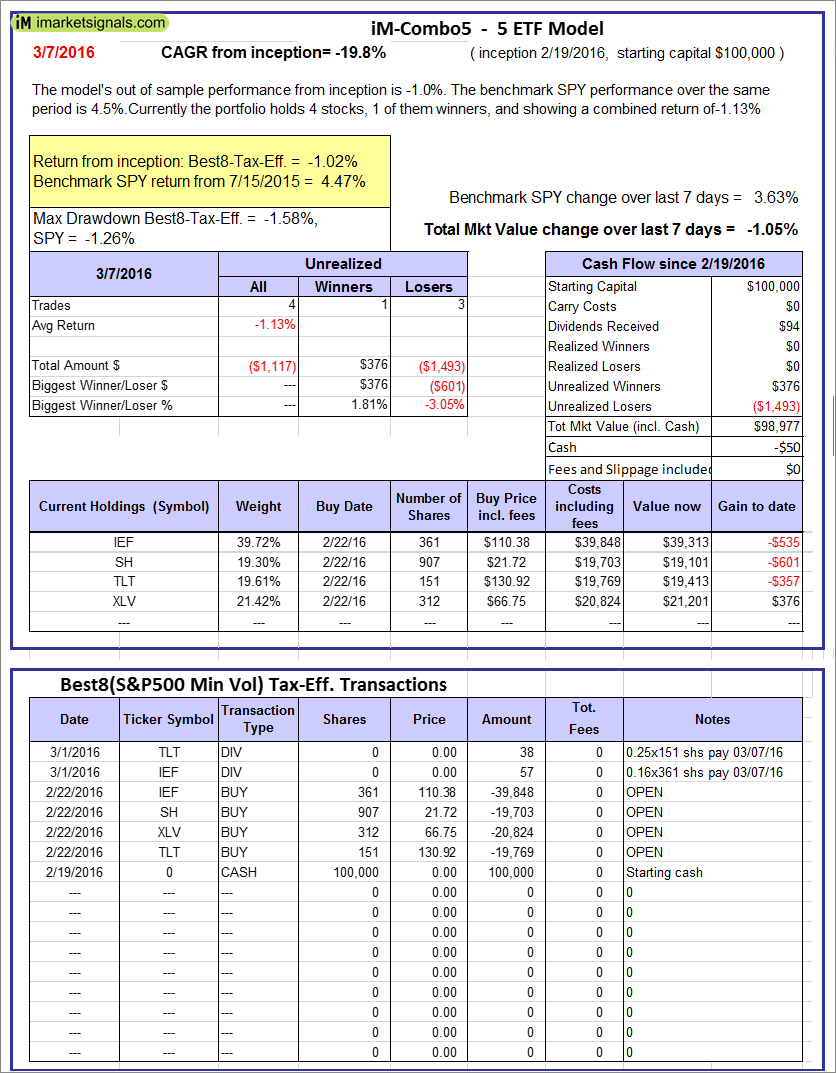 |
iM-Combo5: The model’s out of sample performance from inception is -1.0%. The benchmark SPY performance over the same period is 4.5%. Over the previous week the market value of iM-Combo-3 gained -1.05% at a time when SPY gained 3.63%. A starting capital of $100,000 at inception on 2/22/2016 would have grown to $98,977 which includes -$50 cash and excludes $0 spent on fees and slippage. |
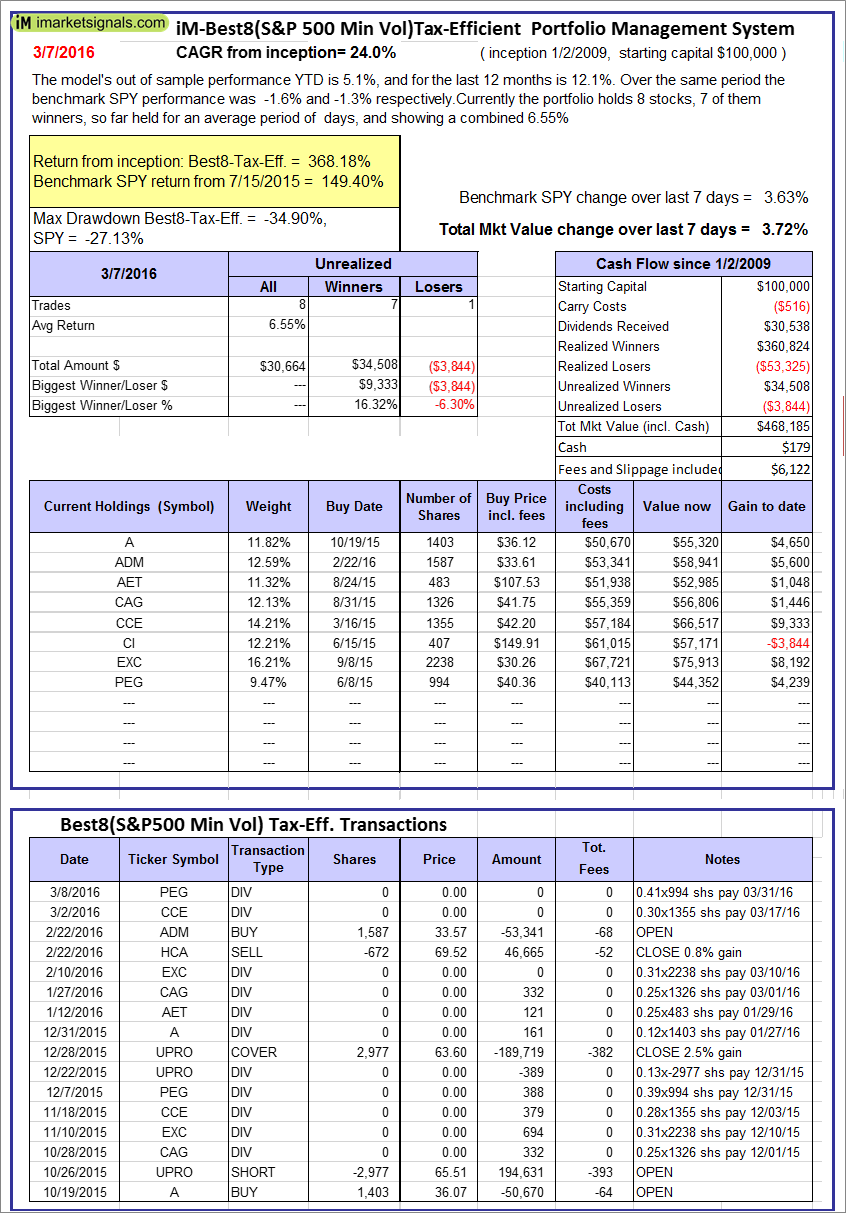 |
The iM-Best8(S&P500 Min Vol)Tax-Efficient The model’s out of sample performance YTD is 5.1%, and for the last 12 months is 12.1%. Over the same period the benchmark SPY performance was -1.6% and -1.3% respectively. Over the previous week the market value of iM-Best8(S&P 500)Tax-Eff. gained 3.72% at a time when SPY gained 3.63%. A starting capital of $100,000 at inception on 1/2/2009 would have grown to $468,185 which includes $179 cash and excludes $6,122 spent on fees and slippage. |
  |
iM-Best10(VDIGX)-Trader: The model’s out of sample performance YTD is -2.3%, and for the last 12 months is 7.2%. Over the same period the benchmark SPY performance was -1.6% and -1.3% respectively. Since inception, on 7/1/2014, the model gained 23.17% while the benchmark SPY gained 5.62% and the ETF VDIGX gained 9.16% over the same period. Over the previous week the market value of iM-Best10(VDIGX) gained 2.55% at a time when SPY gained 3.63%. A starting capital of $100,000 at inception on 7/1/2014 would have grown to $123,168 which includes -$11 cash and excludes $998 spent on fees and slippage. |
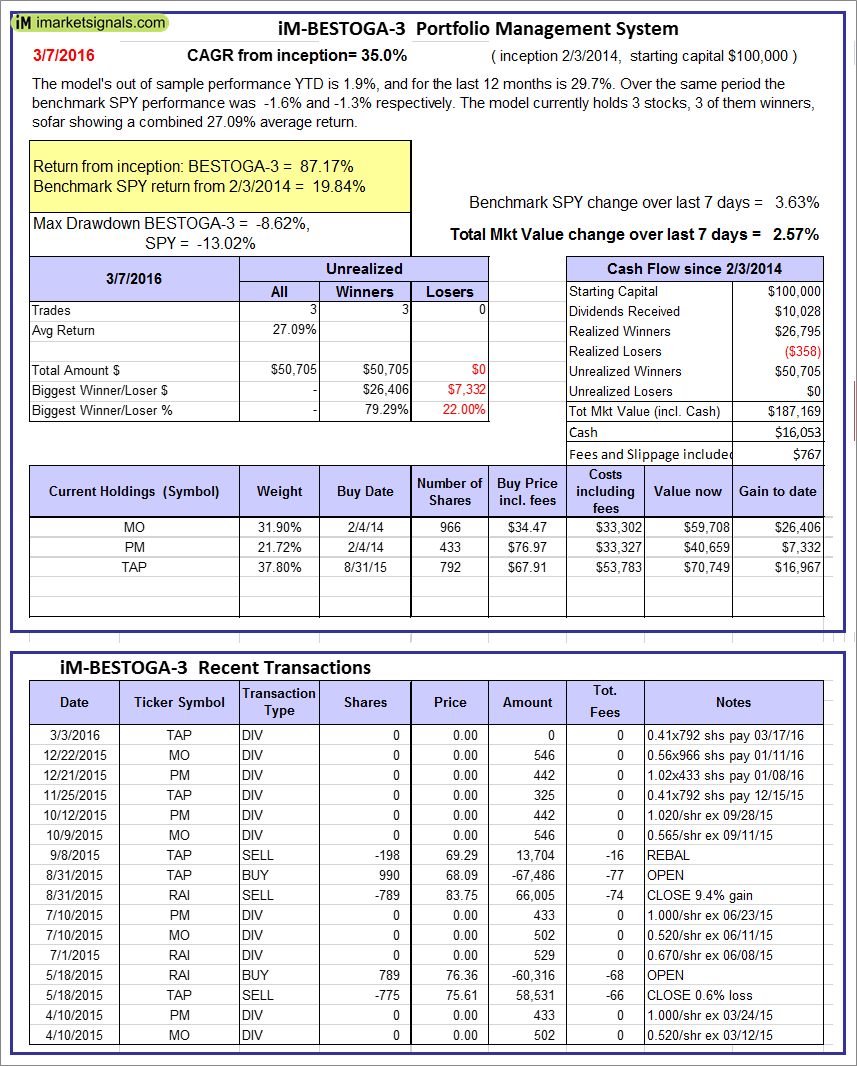 |
iM-BESTOGA-3: The model’s out of sample performance YTD is 1.9%, and for the last 12 months is 29.7%. Over the same period the benchmark SPY performance was -1.6% and -1.3% respectively. Over the previous week the market value of iM-BESTOGA-3 gained 2.57% at a time when SPY gained 3.63%. A starting capital of $100,000 at inception on 2/3/2014 would have grown to $187,169 which includes $16,053 cash and excludes $767 spent on fees and slippage. |
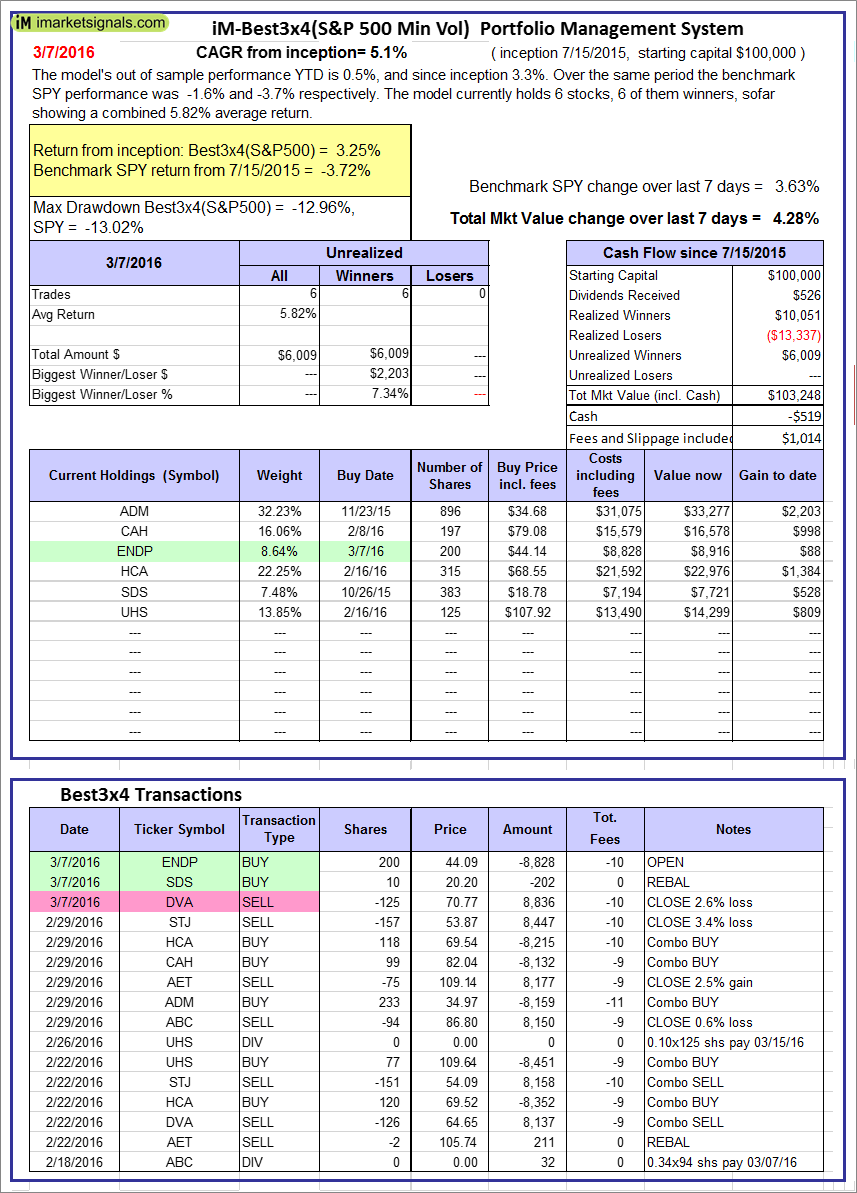 |
iM-Best3x4(S&P 500 Min Vol): The model’s out of sample performance YTD is 0.5%, and since inception 3.3%. Over the same period the benchmark SPY performance was -1.6% and -3.7% respectively. Over the previous week the market value of iM-Best3x4 gained 4.28% at a time when SPY gained 3.63%. A starting capital of $100,000 at inception on 7/15/2015 would have grown to $103,248 which includes -$519 cash and excludes $1,014 spent on fees and slippage. |
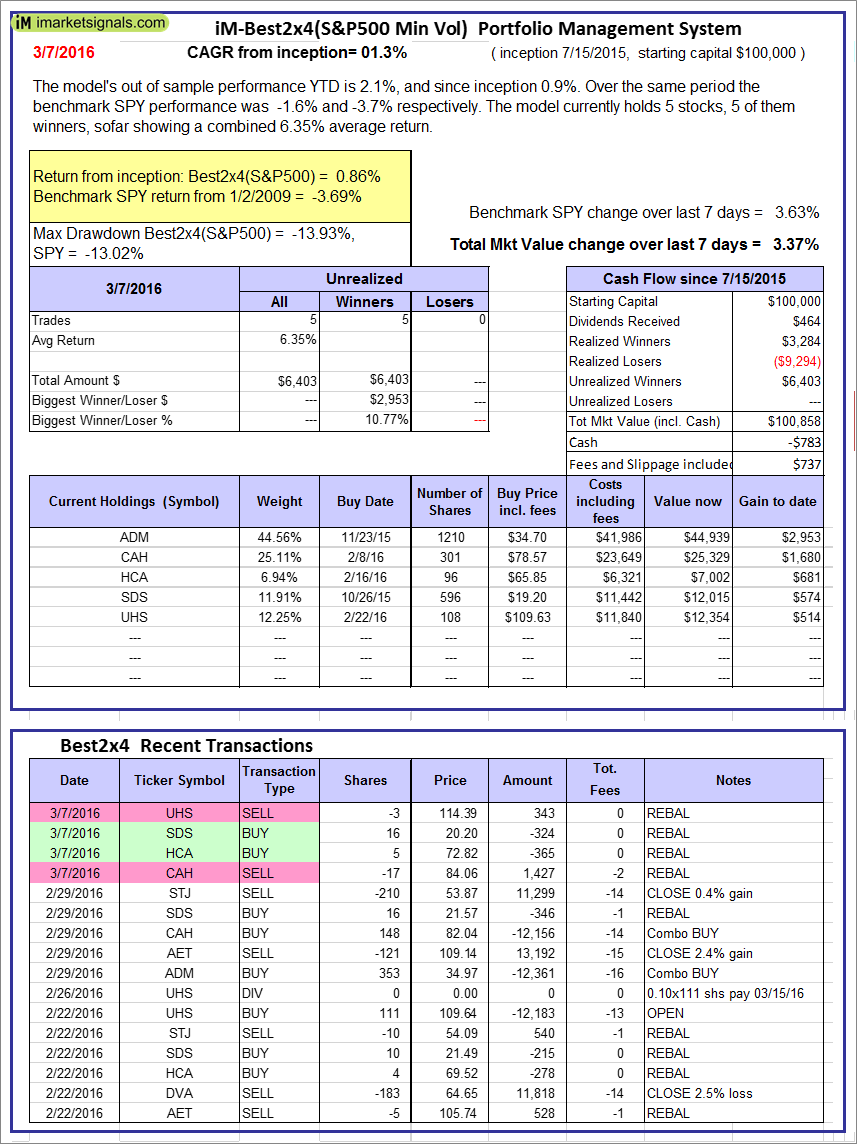 |
iM-Best2x4(S&P 500 Min Vol): The model’s out of sample performance YTD is 2.1%, and since inception 0.9%. Over the same period the benchmark SPY performance was -1.6% and -3.7% respectively. Over the previous week the market value of iM-Best2x4 gained 3.37% at a time when SPY gained 3.63%. A starting capital of $100,000 at inception on 7/16/2015 would have grown to $100,858 which includes -$783 cash and excludes $737 spent on fees and slippage. |
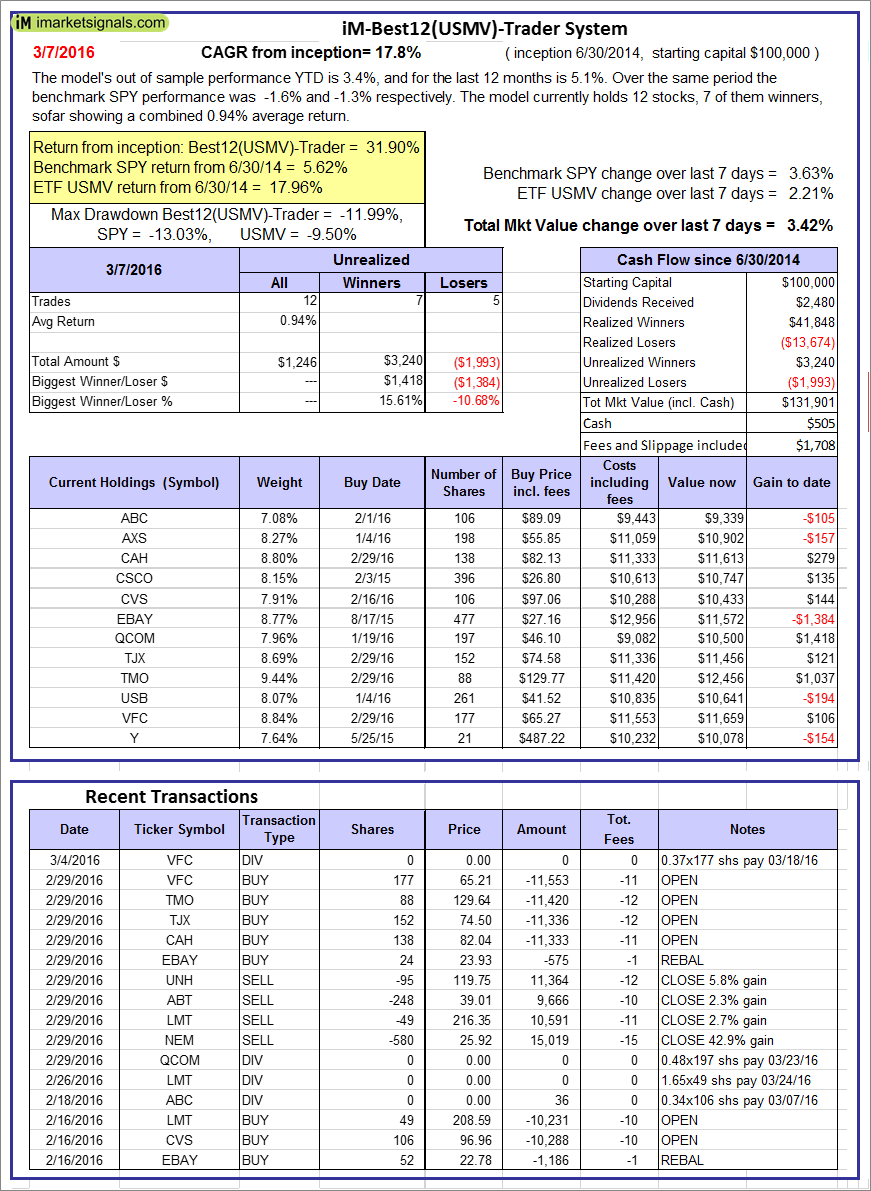 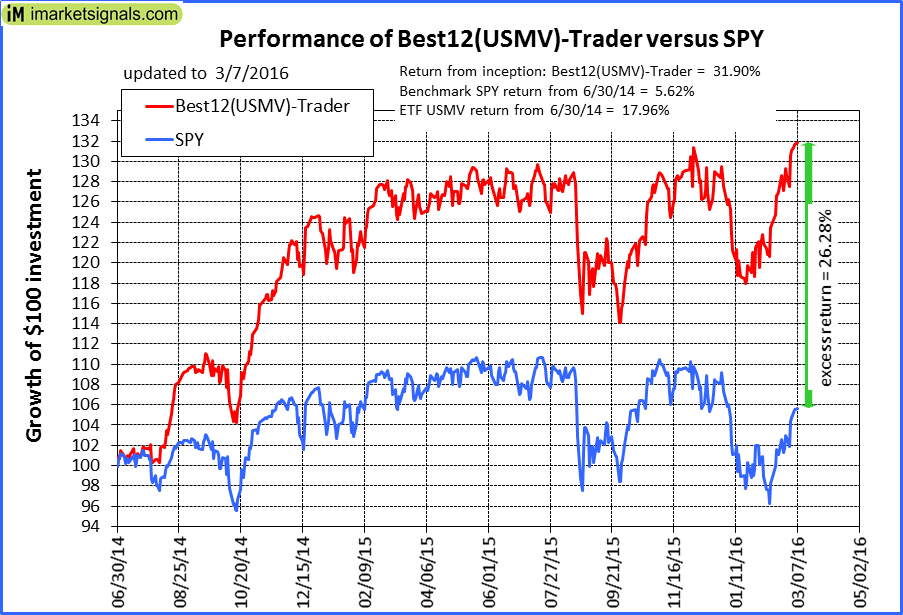 |
iM-Best12(USMV)-Trader: The model’s out of sample performance YTD is 3.4%, and for the last 12 months is 5.1%. Over the same period the benchmark SPY performance was -1.6% and -1.3% respectively. Since inception, on 7/1/2014, the model gained 31.90% while the benchmark SPY gained 5.62% and the ETF USMV gained 17.96% over the same period. Over the previous week the market value of iM-Best12(USMV)-Trader gained 3.42% at a time when SPY gained 3.63%. A starting capital of $100,000 at inception on 7/1/2014 would have grown to $131,901 which includes $505 cash and excludes $1,708 spent on fees and slippage. |
 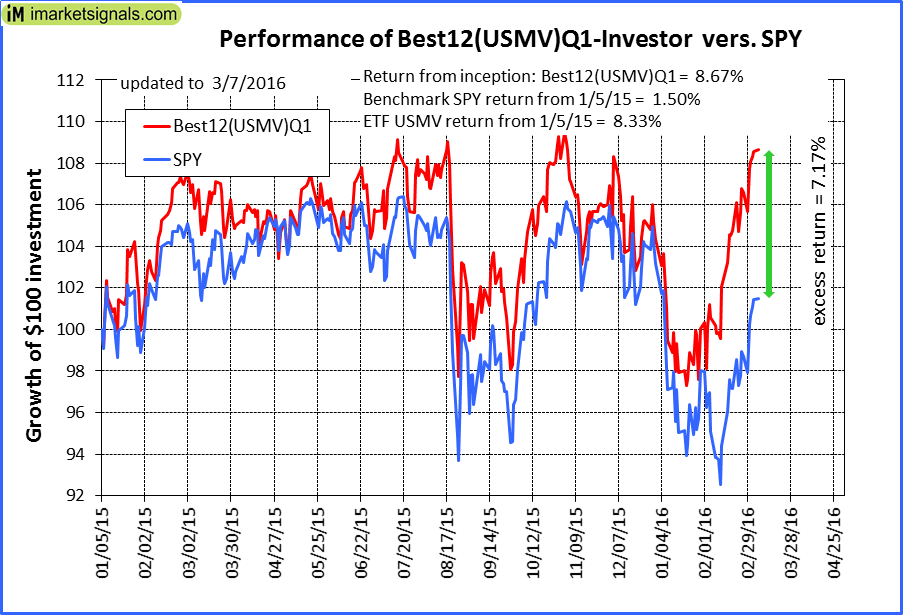 |
iM-Best12(USMV)Q1-Investor: The model’s out of sample performance YTD is 4.2%, and for the last 12 months is 2.7%. Over the same period the benchmark SPY performance was -1.6% and -1.3% respectively. Since inception, on 1/5/2015, the model gained 8.67% while the benchmark SPY gained 1.50% and the ETF USMV gained 8.33% over the same period. Over the previous week the market value of iM-Best12(USMV)Q1 gained 2.82% at a time when SPY gained 3.63%. A starting capital of $100,000 at inception on 1/5/2015 would have grown to $108,674 which includes $48 cash and excludes $405 spent on fees and slippage. |
  |
iM-Best12(USMV)Q2-Investor: The model’s out of sample performance YTD is 4.8%, and since inception 4.3%. Over the same period the benchmark SPY performance was -1.6% and -0.9% respectively. Since inception, on 3/31/2015, the model gained 4.29% while the benchmark SPY gained -2.12% and the ETF USMV gained 4.63% over the same period. Over the previous week the market value of iM-Best12(USMV)Q2 gained 2.70% at a time when SPY gained 3.63%. A starting capital of $100,000 at inception on 3/31/2015 would have grown to $104,293 which includes $45 cash and excludes $211 spent on fees and slippage. |
 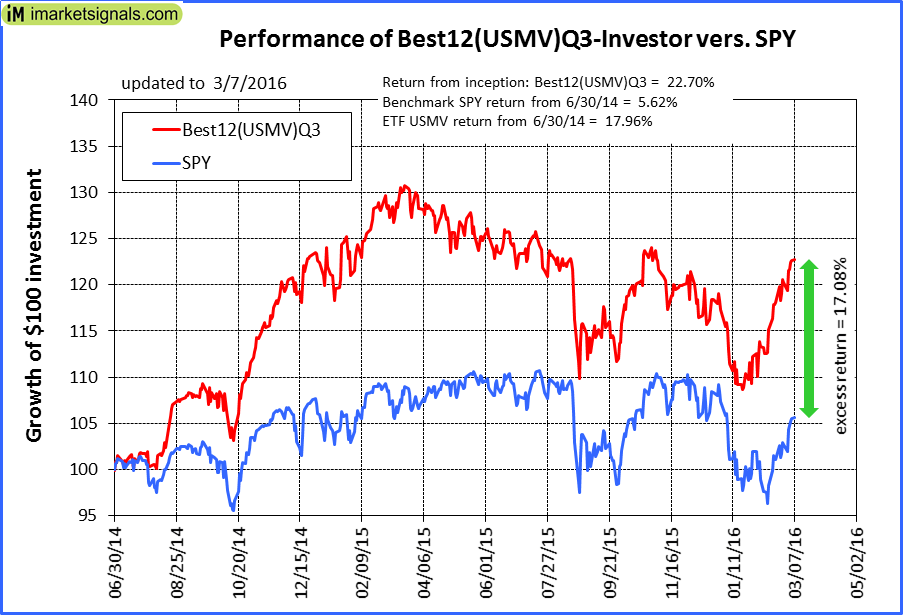 |
iM-Best12(USMV)Q3-Investor: The model’s out of sample performance YTD is 4.6%, and for the last 12 months is -3.6%. Over the same period the benchmark SPY performance was -1.6% and -1.3% respectively. Since inception, on 7/1/2014, the model gained 22.70% while the benchmark SPY gained 5.62% and the ETF USMV gained 17.96% over the same period. Over the previous week the market value of iM-Best12(USMV)Q3 gained 2.74% at a time when SPY gained 3.63%. A starting capital of $100,000 at inception on 7/1/2014 would have grown to $122,697 which includes $61 cash and excludes $564 spent on fees and slippage. |
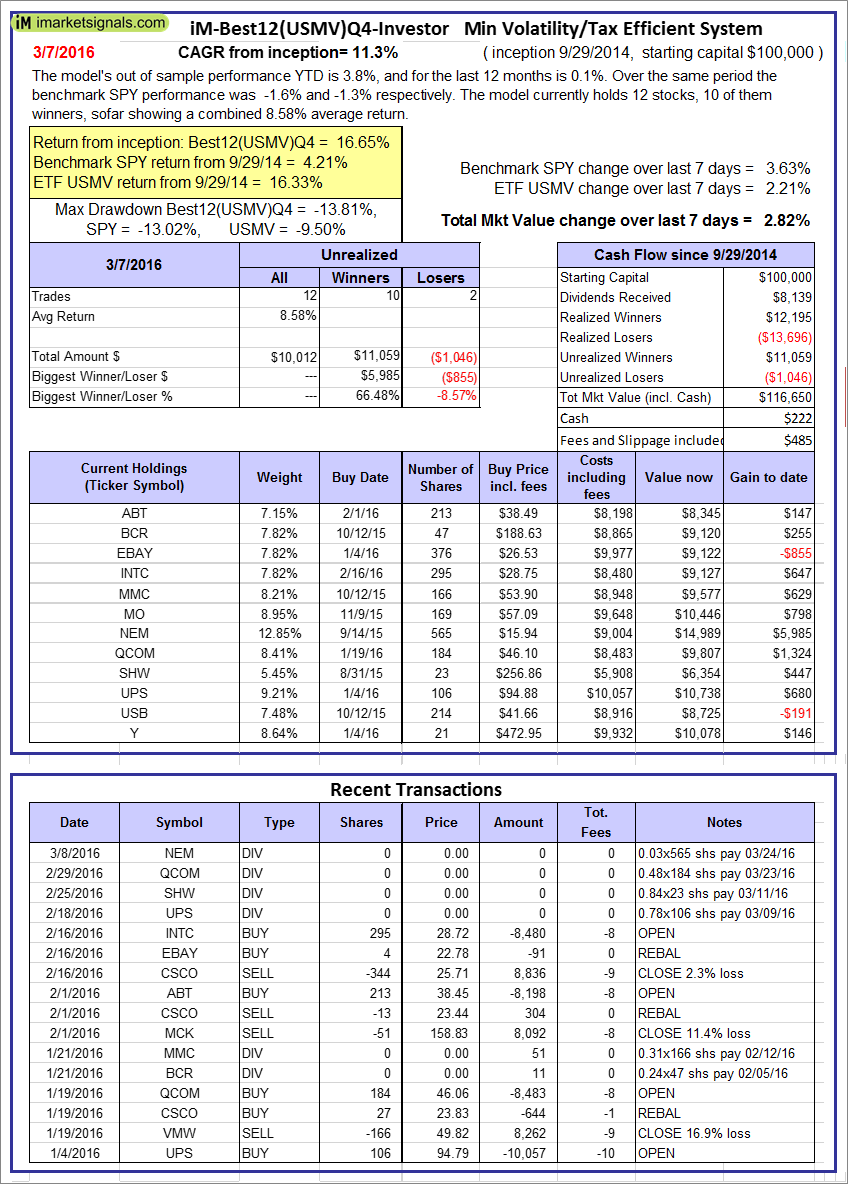 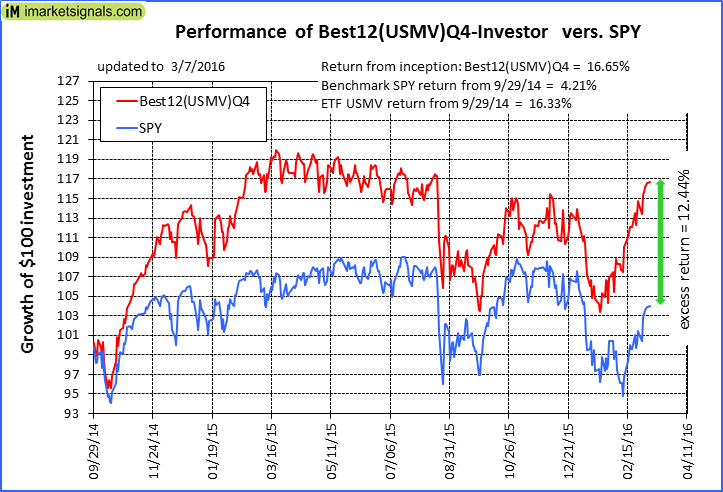 |
iM-Best12(USMV)Q4-Investor: Since inception, on 9/30/2014, the model gained 16.65% while the benchmark SPY gained 4.21% and the ETF USMV gained 16.33% over the same period. Over the previous week the market value of iM-Best12(USMV)Q4 gained 2.82% at a time when SPY gained 3.63%. A starting capital of $100,000 at inception on 9/30/2014 would have grown to $116,650 which includes $222 cash and excludes $485 spent on fees and slippage. |
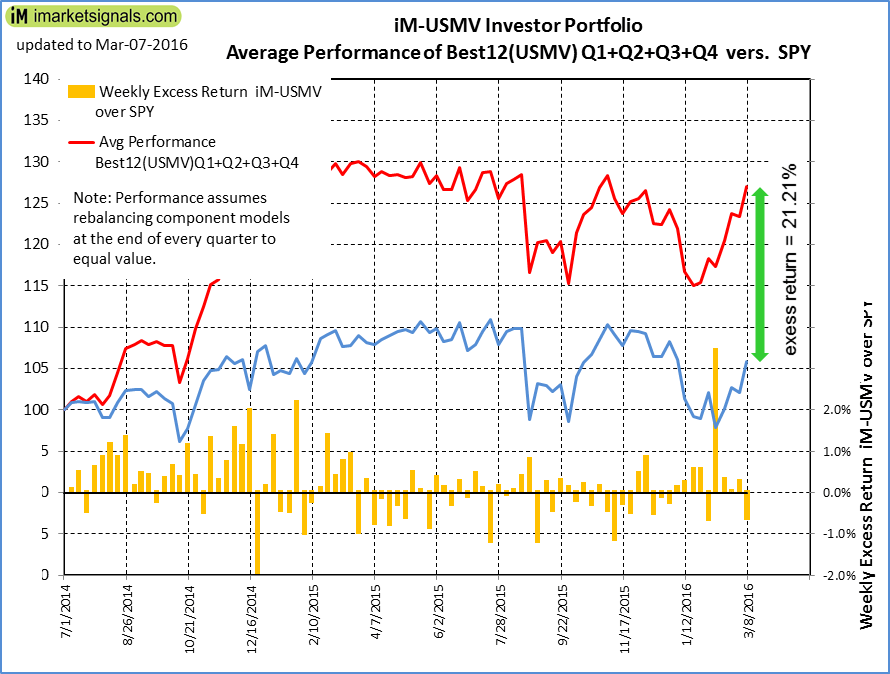 |
Average Performance of iM-Best12(USMV)Q1+Q2+Q3+Q4-Investor resulted in an excess return of 21.21% over SPY. (see iM-USMV Investor Portfolio) |
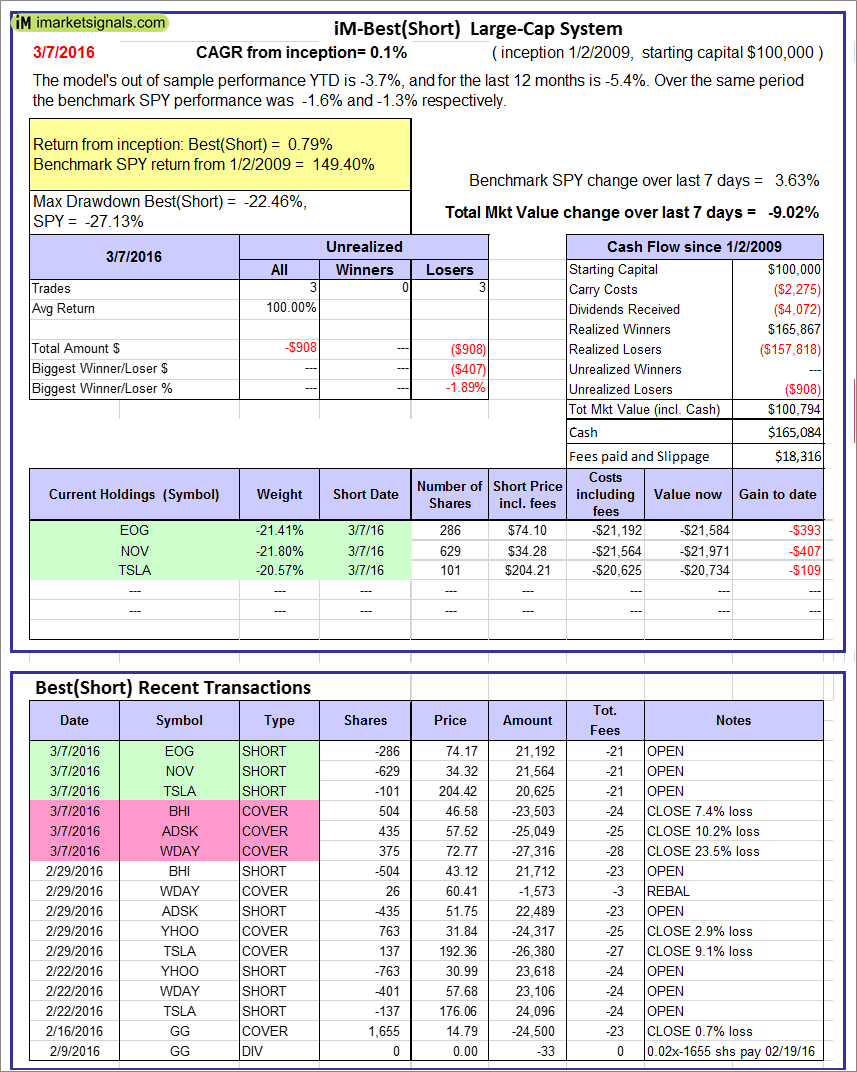 |
iM-Best(Short): The model’s out of sample performance YTD is -3.7%, and for the last 12 months is -5.4%. Over the same period the benchmark SPY performance was -1.6% and -1.3% respectively. Over the previous week the market value of iM-Best(Short) gained -9.02% at a time when SPY gained 3.63%. Over the period 1/2/2009 to 3/7/2016 the starting capital of $100,000 would have grown to $100,794 which includes $165,084 cash and excludes $18,316 spent on fees and slippage. |
iM-Best Reports – 3/7/2016
Posted in pmp SPY-SH
Leave a Reply
You must be logged in to post a comment.