  |
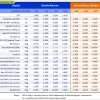
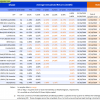
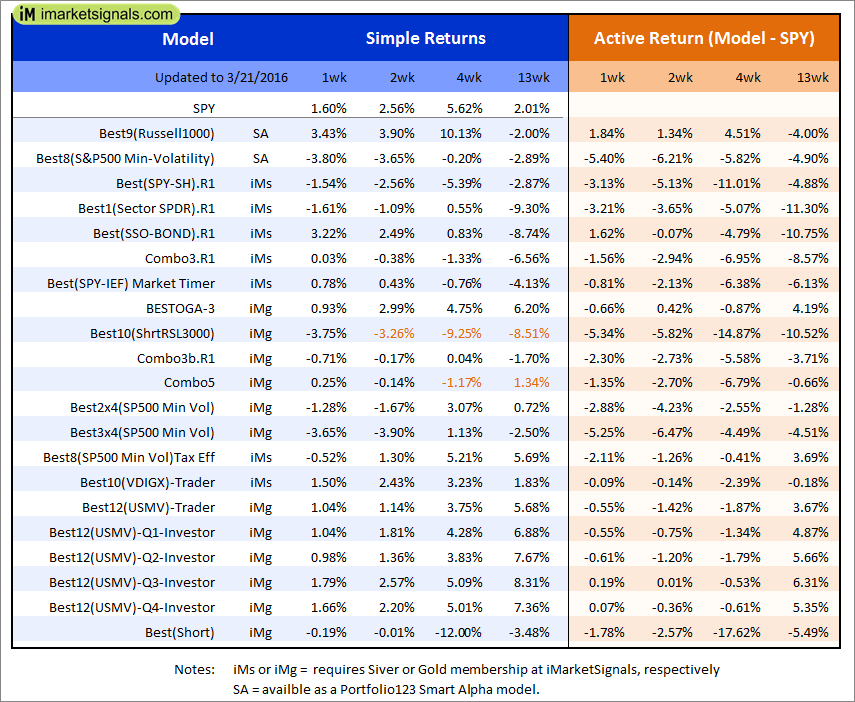
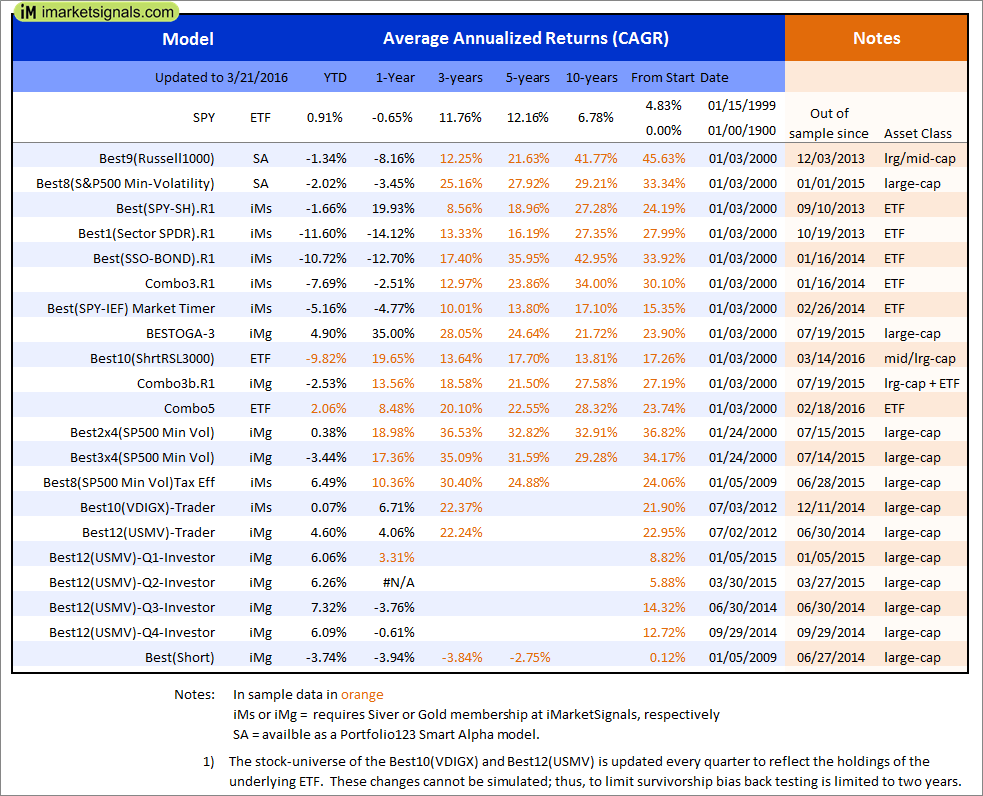
Out of sample performance summary of our models for the past 1, 2, 4 and 13 week periods. The active active return indicates how the models over- or underperformed the benchmark ETF SPY. Also the YTD, and the 1-, 3-, 5- and 10-year annualized returns are shown in the second table |
|
|
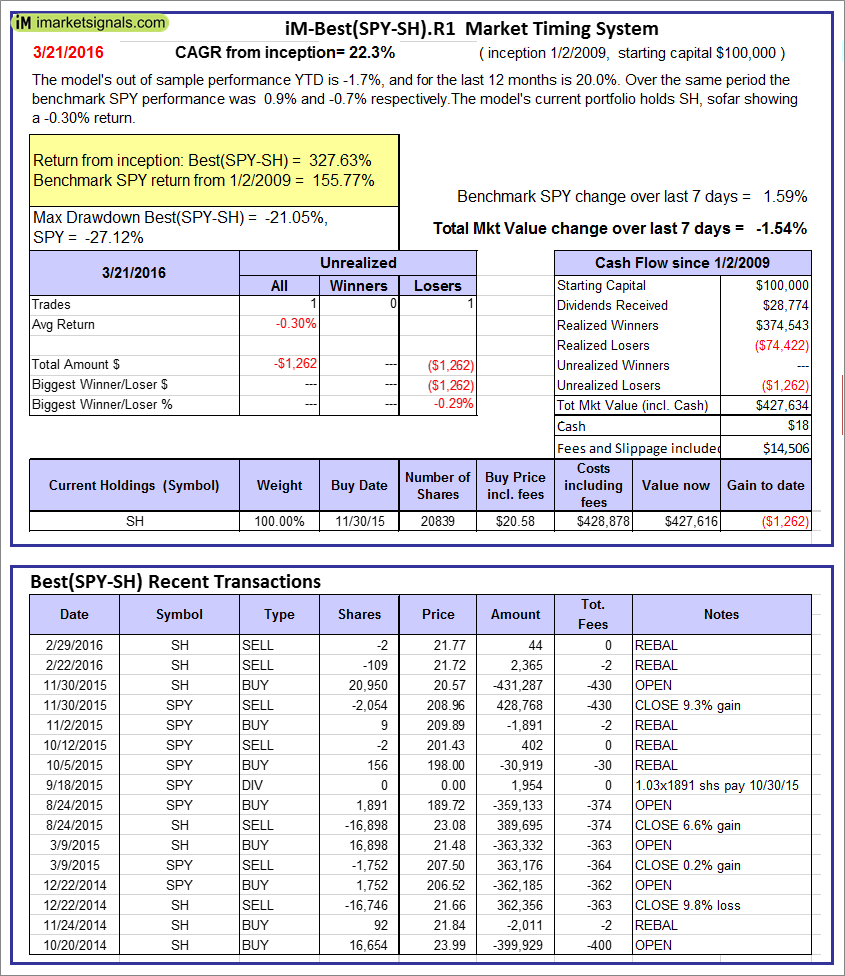
iM-Best(SPY-SH).R1: The model’s out of sample performance YTD is -1.7%, and for the last 12 months is 20.0%. Over the same period the benchmark SPY performance was 0.9% and -0.7% respectively. Over the previous week the market value of Best(SPY-SH) gained -1.54% at a time when SPY gained 1.59%. A starting capital of $100,000 at inception on 1/2/2009 would have grown to $427,634 which includes $18 cash and excludes $14,506 spent on fees and slippage. |
|
|
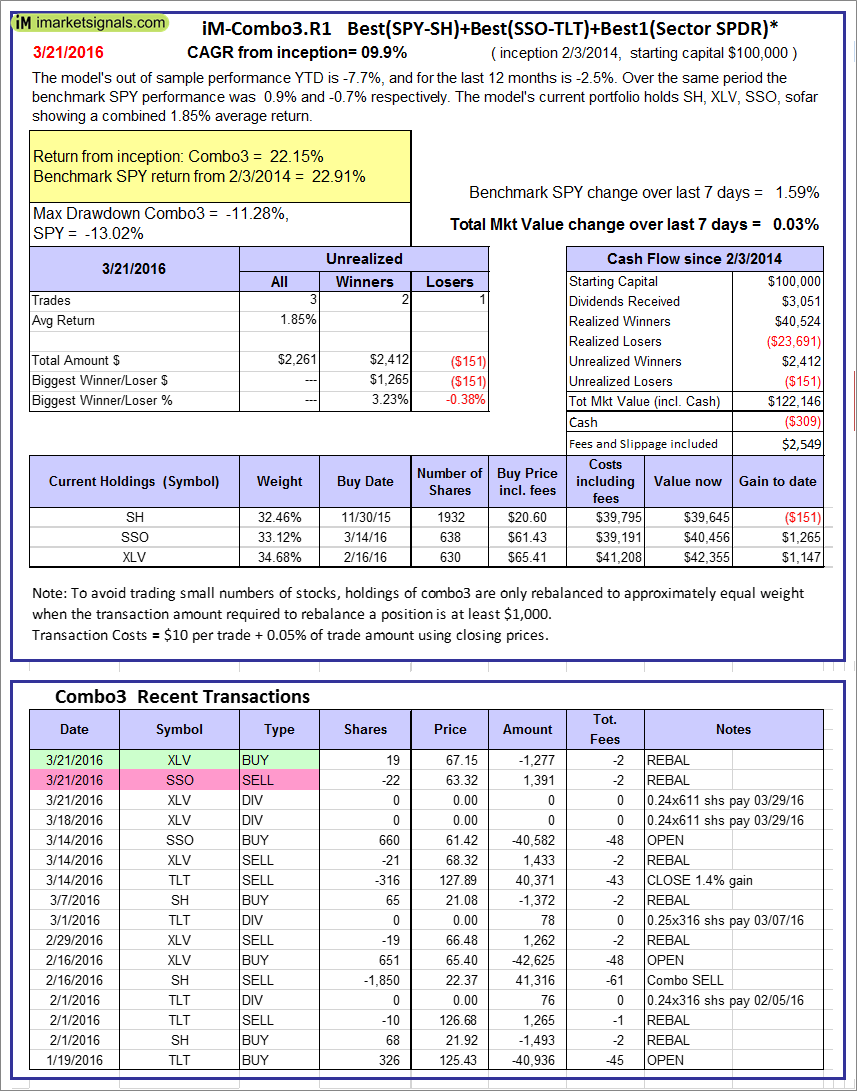
iM-Combo3.R1: The model’s out of sample performance YTD is -7.7%, and for the last 12 months is -2.5%. Over the same period the benchmark SPY performance was 0.9% and -0.7% respectively. Over the previous week the market value of iM-Combo-3 gained 0.03% at a time when SPY gained 1.59%[/iM]. A starting capital of $100,000 at inception on 2/3/2014 would have grown to $122,146 which includes -$309 cash and excludes $2,549 spent on fees and slippage. |
|
|
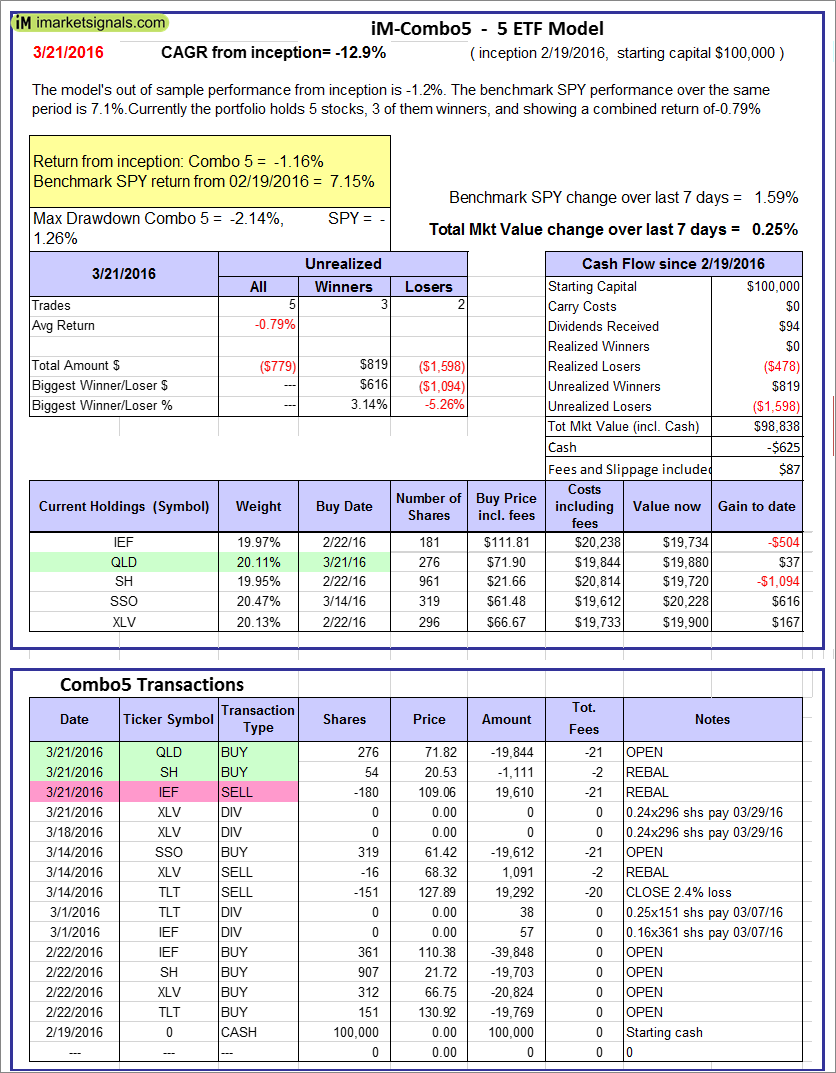
iM-Combo5: The model’s out of sample performance from inception is -1.2%. The benchmark SPY performance over the same period is 7.1%. Over the previous week the market value of iM-Combo-3 gained 0.25% at a time when SPY gained 1.59%. A starting capital of $100,000 at inception on 2/22/2016 would have grown to $98,838 which includes -$625 cash and excludes $87 spent on fees and slippage. |
|
|
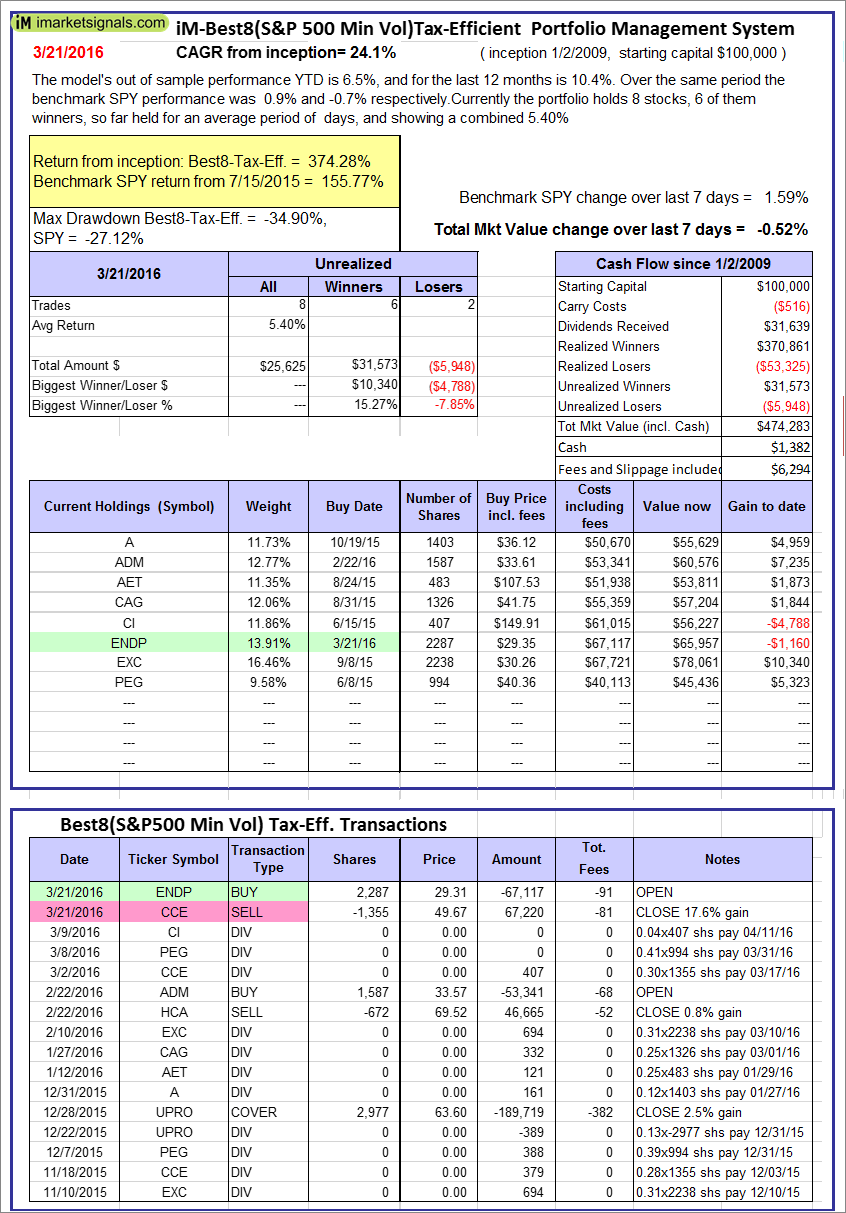
The iM-Best8(S&P500 Min Vol)Tax-Efficient The model’s out of sample performance YTD is 6.5%, and for the last 12 months is 10.4%. Over the same period the benchmark SPY performance was 0.9% and -0.7% respectively. Over the previous week the market value of iM-Best8(S&P 500)Tax-Eff. gained -0.52% at a time when SPY gained 1.59%. A starting capital of $100,000 at inception on 1/2/2009 would have grown to $474,283 which includes $1,382 cash and excludes $6,294 spent on fees and slippage. |
|
|
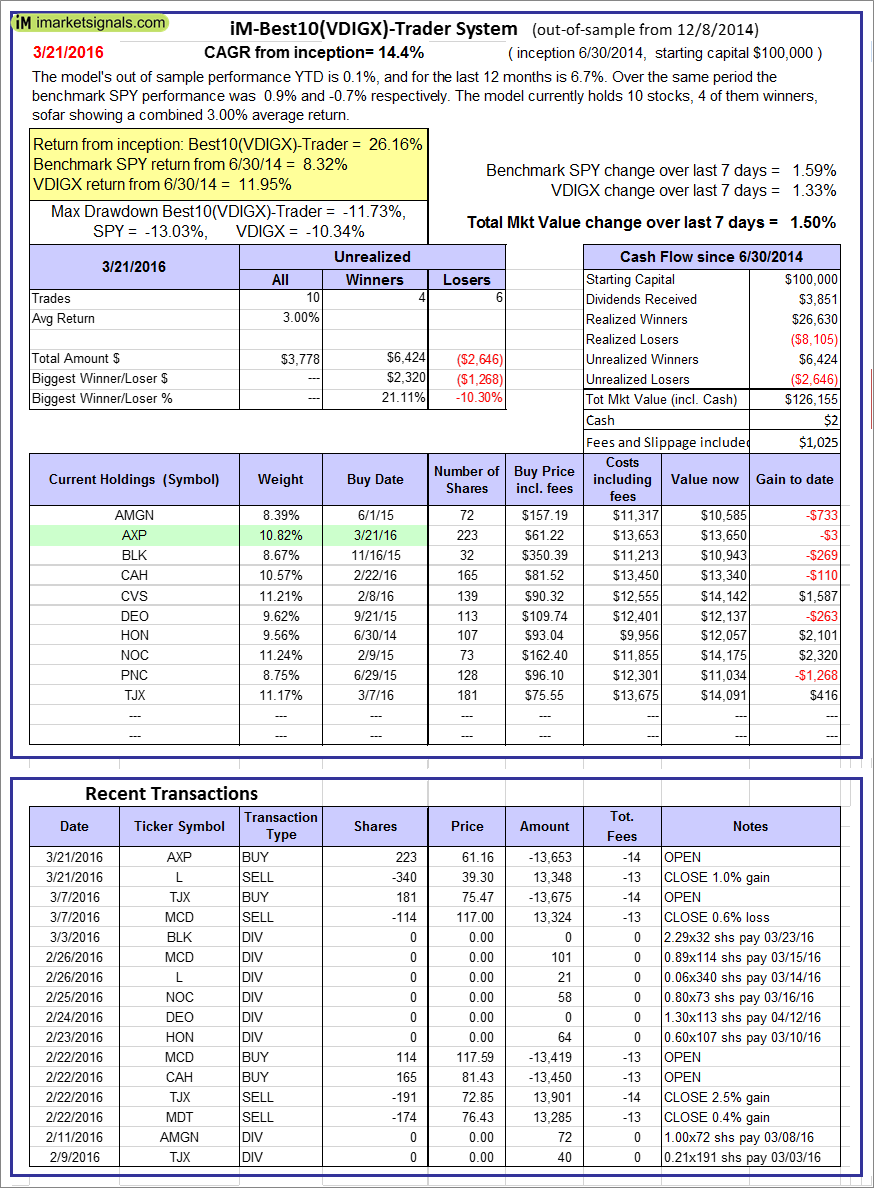
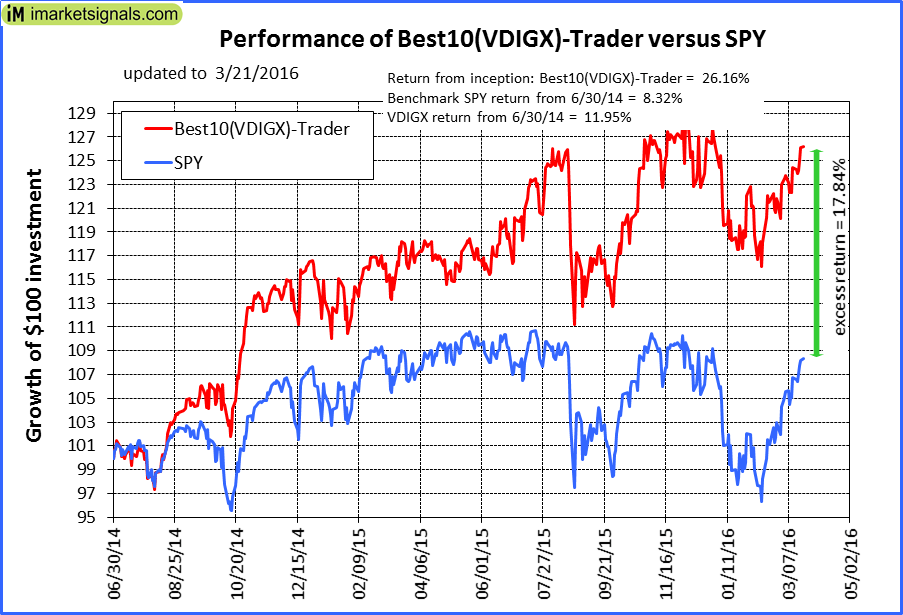
iM-Best10(VDIGX)-Trader: The model’s out of sample performance YTD is 0.1%, and for the last 12 months is 6.7%. Over the same period the benchmark SPY performance was 0.9% and -0.7% respectively. Since inception, on 7/1/2014, the model gained 26.16% while the benchmark SPY gained 8.32% and the ETF VDIGX gained 11.95% over the same period. Over the previous week the market value of iM-Best10(VDIGX) gained 1.50% at a time when SPY gained 1.59%. A starting capital of $100,000 at inception on 7/1/2014 would have grown to $126,155 which includes $2 cash and excludes $1,025 spent on fees and slippage. |
|
|
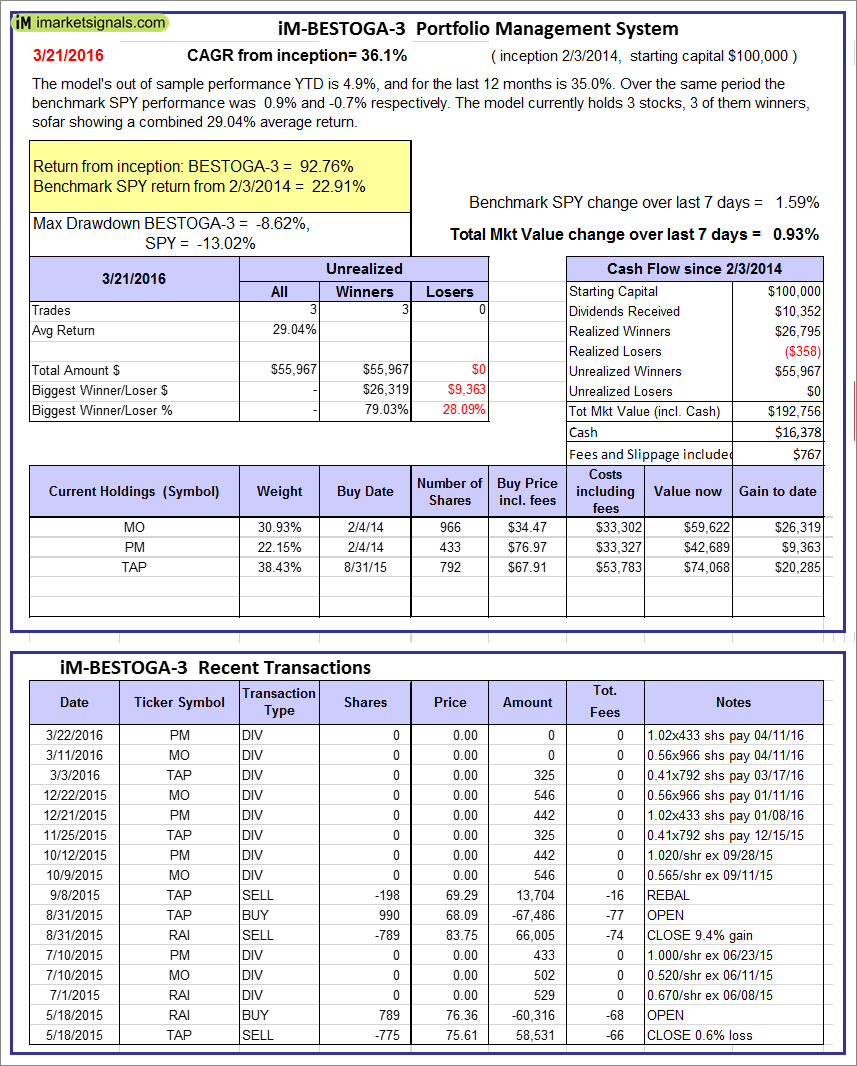
iM-BESTOGA-3: The model’s out of sample performance YTD is 4.9%, and for the last 12 months is 35.0%. Over the same period the benchmark SPY performance was 0.9% and -0.7% respectively. Over the previous week the market value of iM-BESTOGA-3 gained 0.93% at a time when SPY gained 1.59%. A starting capital of $100,000 at inception on 2/3/2014 would have grown to $192,756 which includes $16,378 cash and excludes $767 spent on fees and slippage. |
|
|
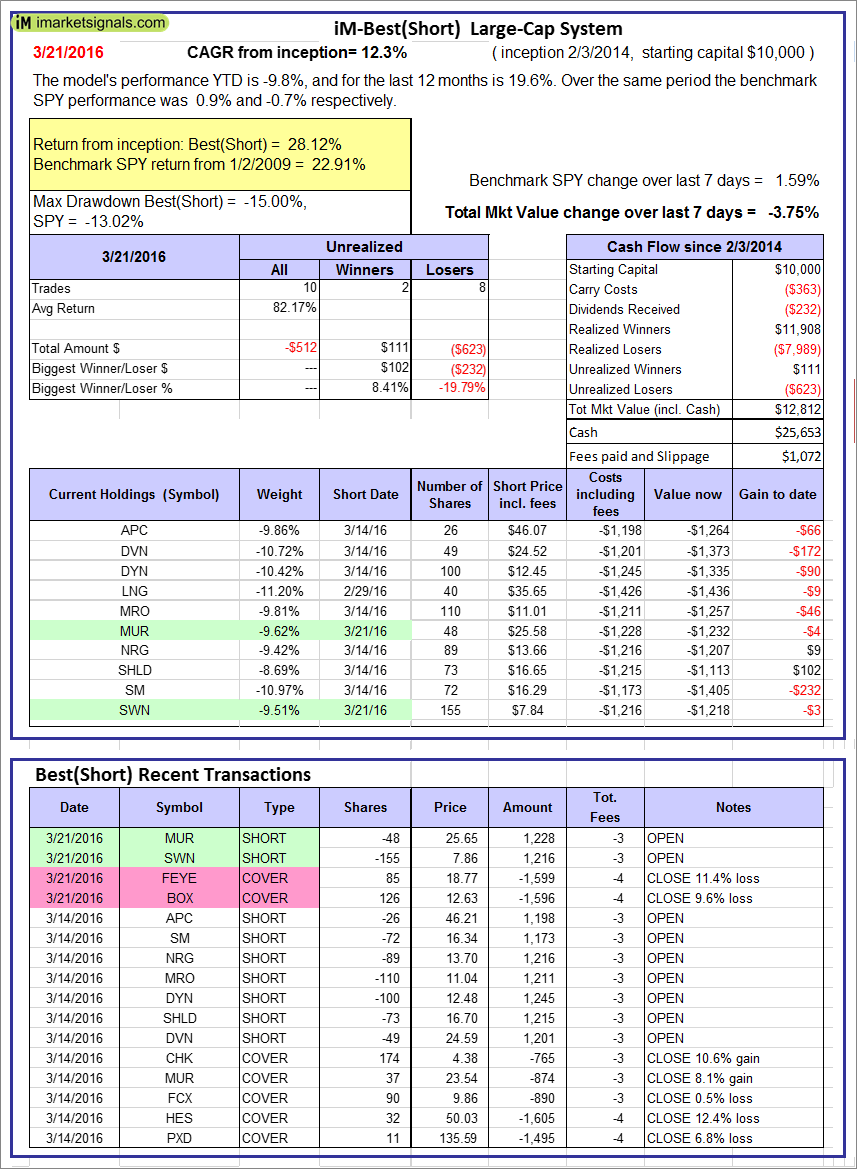
iM-Best10(Short Russell3000): The model’s performance YTD is -9.8%, and for the last 12 months is 19.6%. Over the same period the benchmark SPY performance was 0.9% and -0.7% respectively. Over the previous week the market value of iM-Best10(Short Russell3000) gained -3.75% at a time when SPY gained 1.59%. Over the period 2/3/2014 to 3/21/2016 the starting capital of $100,000 would have grown to $12,812 which includes $25,653 cash and excludes $1,072 spent on fees and slippage. |
|
|
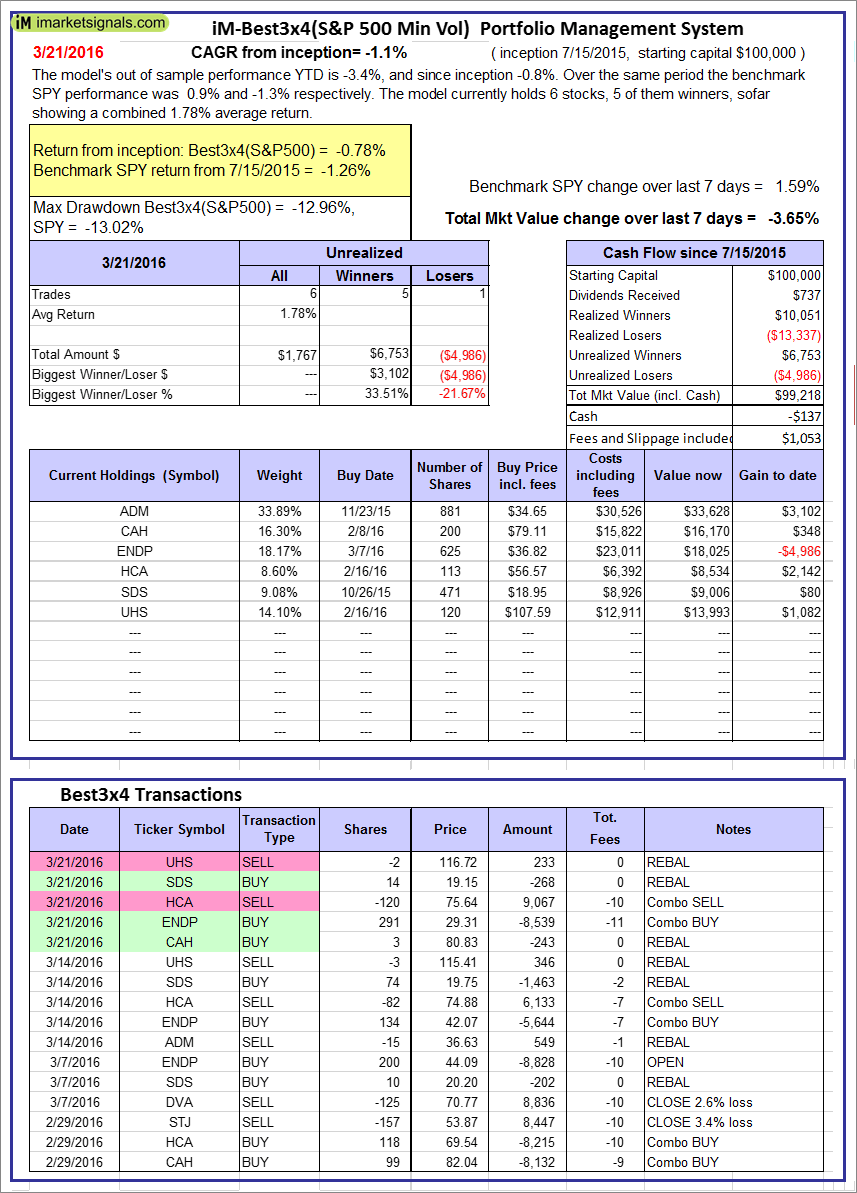
iM-Best3x4(S&P 500 Min Vol): The model’s out of sample performance YTD is -3.4%, and since inception -0.8%. Over the same period the benchmark SPY performance was 0.9% and -1.3% respectively. Over the previous week the market value of iM-Best3x4 gained -3.65% at a time when SPY gained 1.59%. A starting capital of $100,000 at inception on 7/15/2015 would have grown to $99,218 which includes -$137 cash and excludes $1,053 spent on fees and slippage. |
|
|
iM-Best2x4(S&P 500 Min Vol): The model’s out of sample performance YTD is 0.4%, and since inception -0.8%. Over the same period the benchmark SPY performance was 0.9% and -1.2% respectively. Over the previous week the market value of iM-Best2x4 gained -1.28% at a time when SPY gained 1.59%. A starting capital of $100,000 at inception on 7/16/2015 would have grown to $99,171 which includes $1,589 cash and excludes $757 spent on fees and slippage. |
|
|
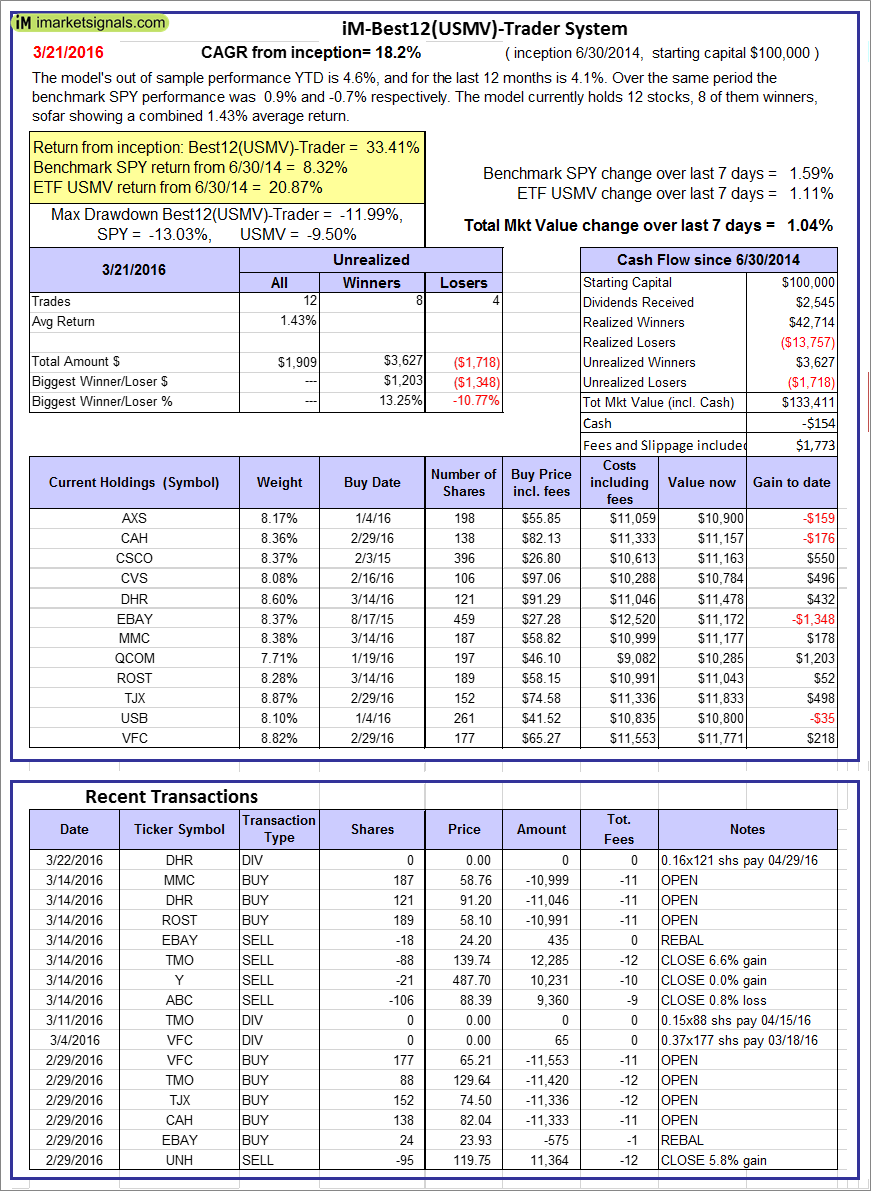
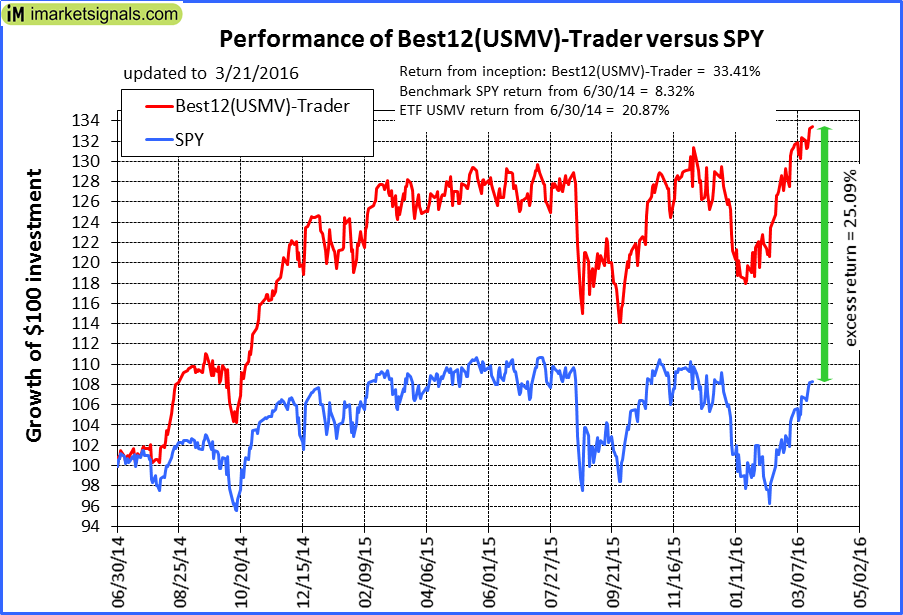
iM-Best12(USMV)-Trader: The model’s out of sample performance YTD is 4.6%, and for the last 12 months is 4.1%. Over the same period the benchmark SPY performance was 0.9% and -0.7% respectively. Since inception, on 7/1/2014, the model gained 33.41% while the benchmark SPY gained 8.32% and the ETF USMV gained 20.87% over the same period. Over the previous week the market value of iM-Best12(USMV)-Trader gained 1.04% at a time when SPY gained 1.59%. A starting capital of $100,000 at inception on 7/1/2014 would have grown to $133,411 which includes -$154 cash and excludes $1,773 spent on fees and slippage. |
|
|
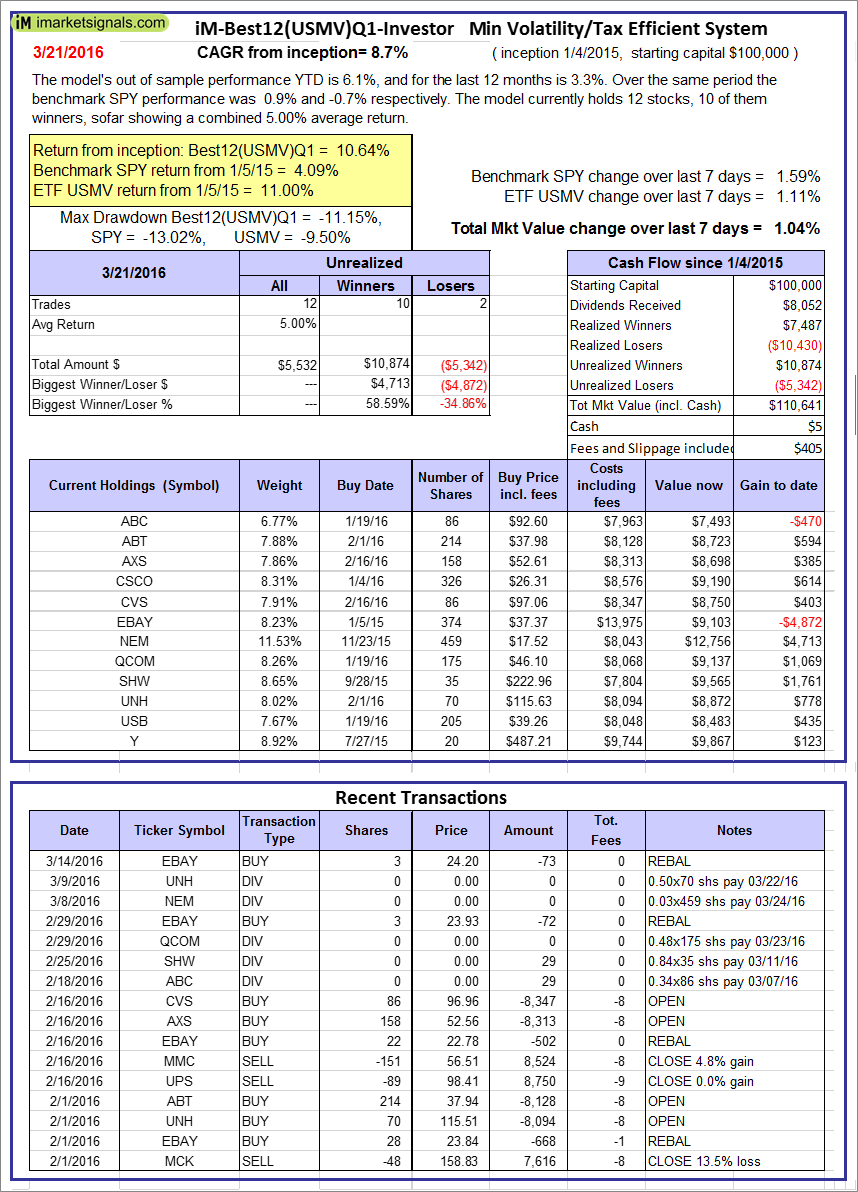
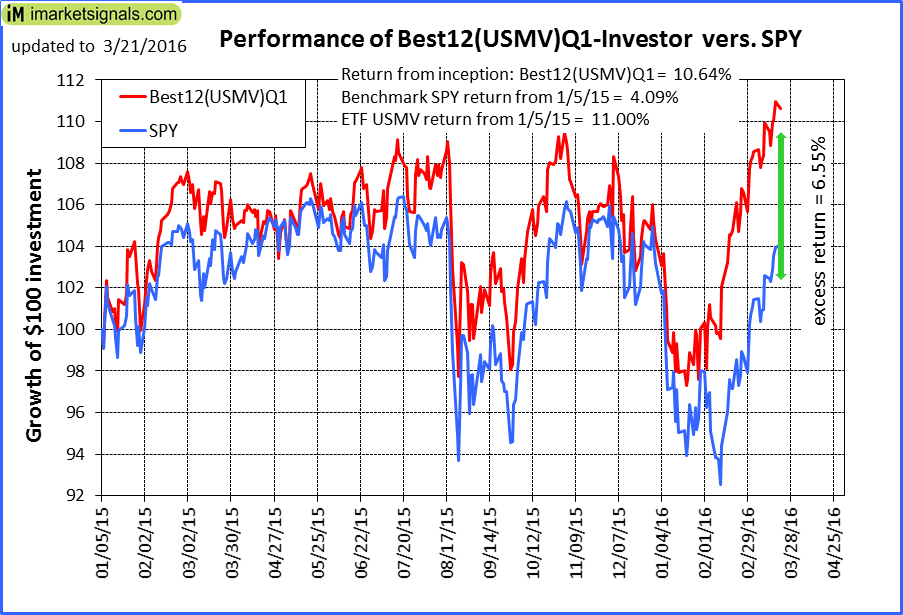
iM-Best12(USMV)Q1-Investor: The model’s out of sample performance YTD is 6.1%, and for the last 12 months is 3.3%. Over the same period the benchmark SPY performance was 0.9% and -0.7% respectively. Since inception, on 1/5/2015, the model gained 10.64% while the benchmark SPY gained 4.09% and the ETF USMV gained 11.00% over the same period. Over the previous week the market value of iM-Best12(USMV)Q1 gained 1.04% at a time when SPY gained 1.59%. A starting capital of $100,000 at inception on 1/5/2015 would have grown to $110,641 which includes $5 cash and excludes $405 spent on fees and slippage. |
|
|
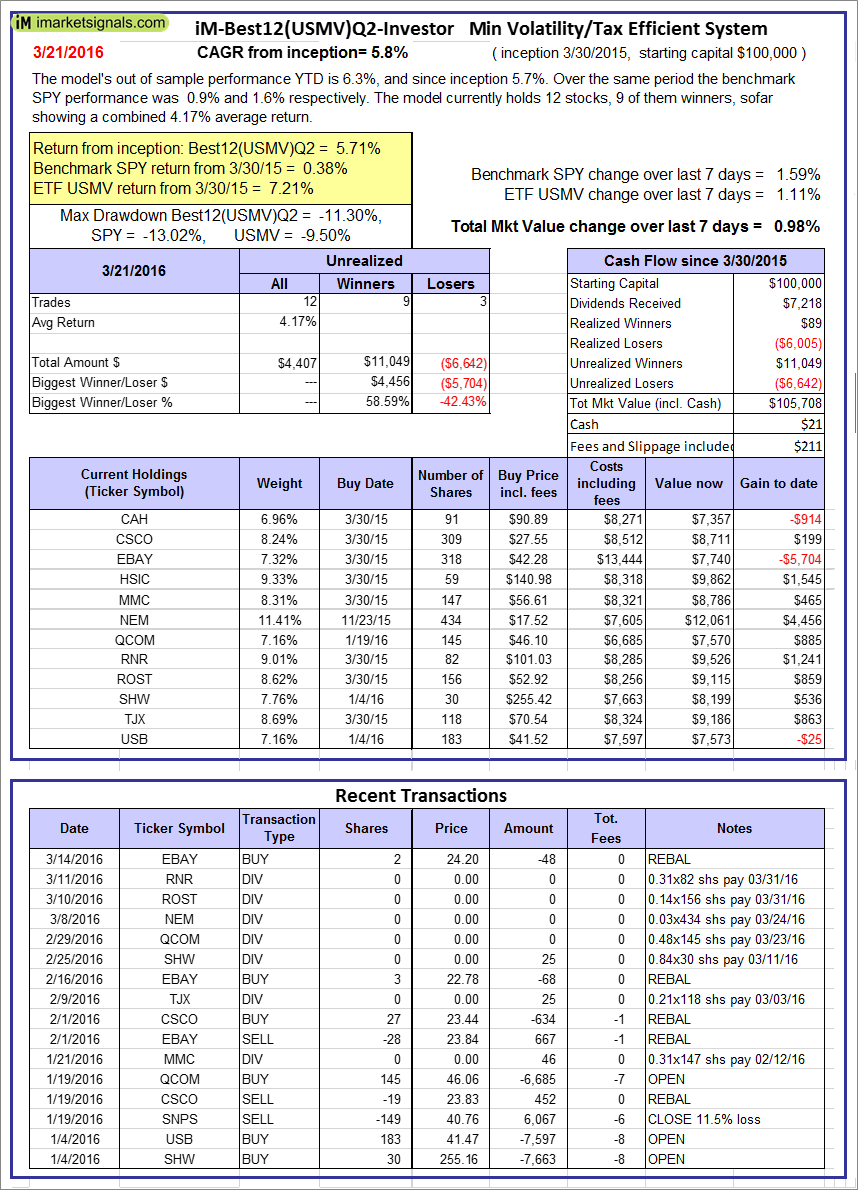
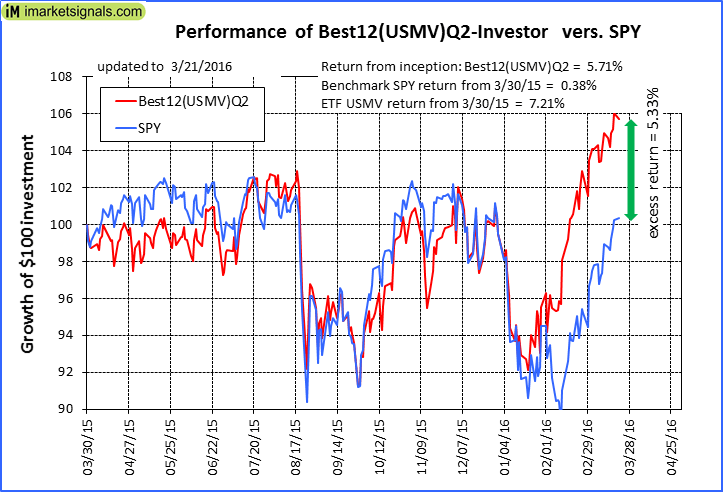
iM-Best12(USMV)Q2-Investor: The model’s out of sample performance YTD is 6.3%, and since inception 5.7%. Over the same period the benchmark SPY performance was 0.9% and 1.6% respectively. Since inception, on 3/31/2015, the model gained 5.71% while the benchmark SPY gained 0.38% and the ETF USMV gained 7.21% over the same period. Over the previous week the market value of iM-Best12(USMV)Q2 gained 0.98% at a time when SPY gained 1.59%. A starting capital of $100,000 at inception on 3/31/2015 would have grown to $105,708 which includes $21 cash and excludes $211 spent on fees and slippage. |
|
|
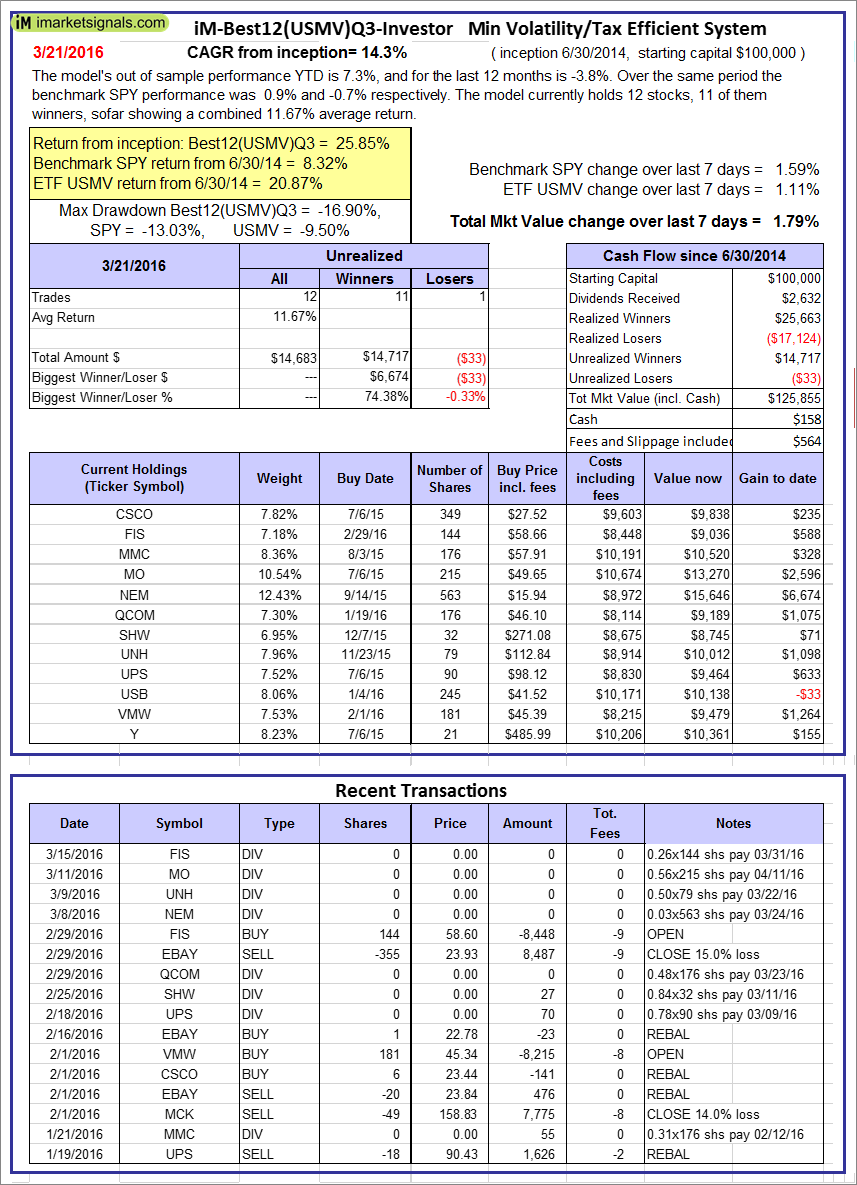
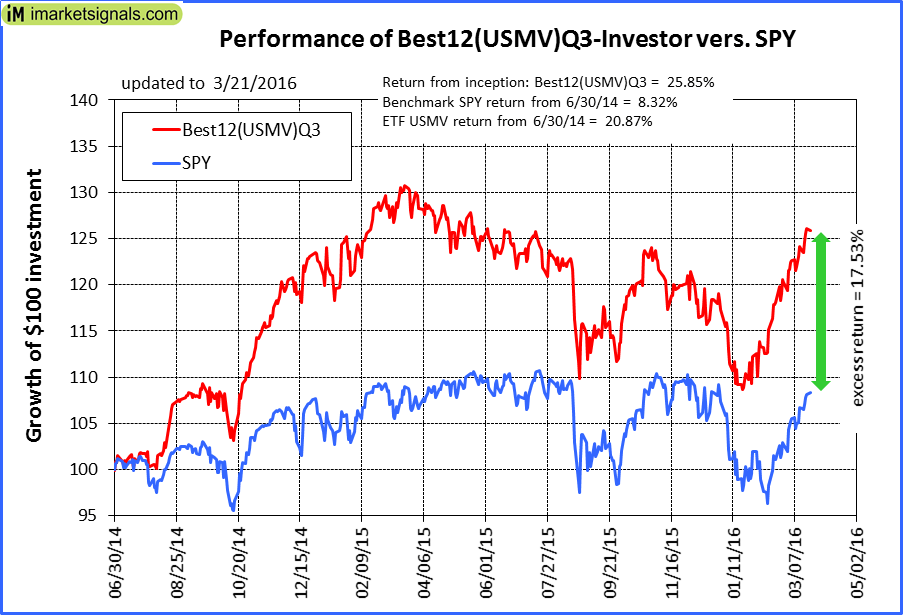
iM-Best12(USMV)Q3-Investor: The model’s out of sample performance YTD is 7.3%, and for the last 12 months is -3.8%. Over the same period the benchmark SPY performance was 0.9% and -0.7% respectively. Since inception, on 7/1/2014, the model gained 25.85% while the benchmark SPY gained 8.32% and the ETF USMV gained 20.87% over the same period. Over the previous week the market value of iM-Best12(USMV)Q3 gained 1.79% at a time when SPY gained 1.59%. A starting capital of $100,000 at inception on 7/1/2014 would have grown to $125,855 which includes $158 cash and excludes $564 spent on fees and slippage. |
|
|
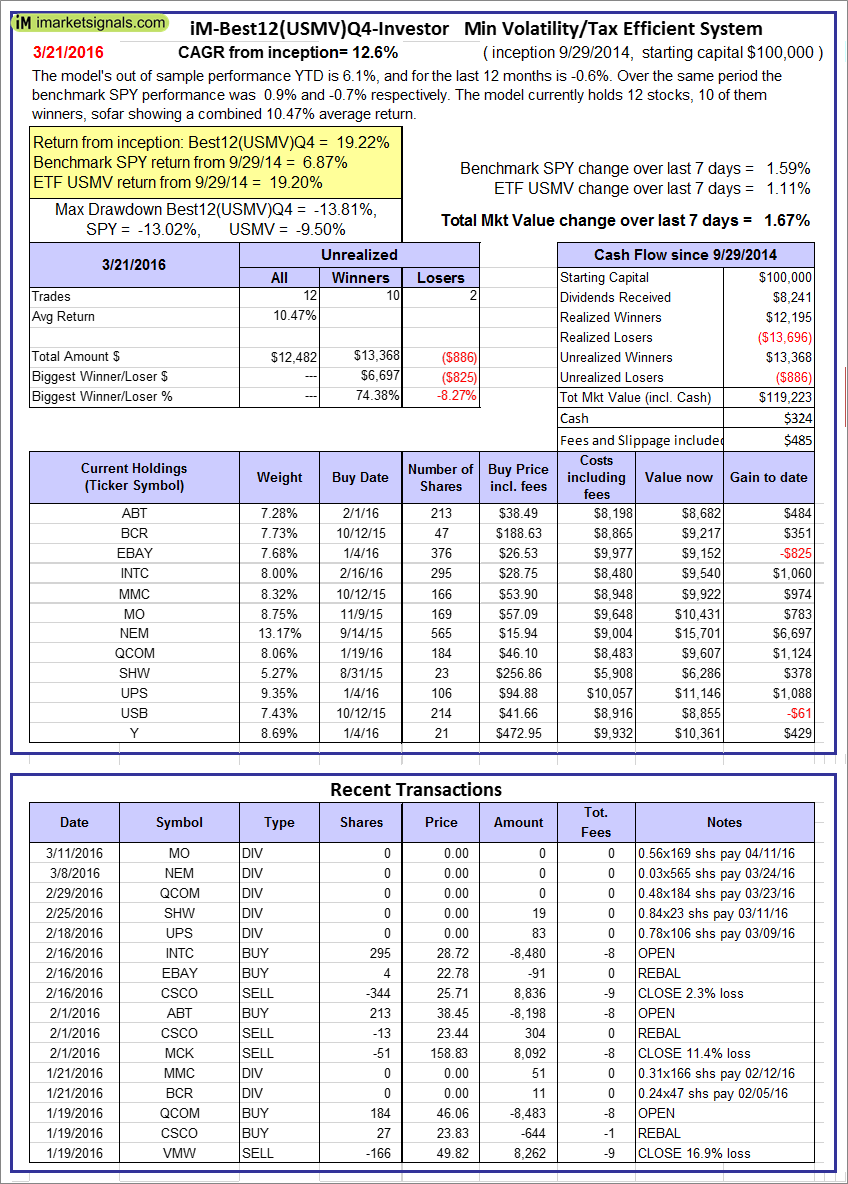
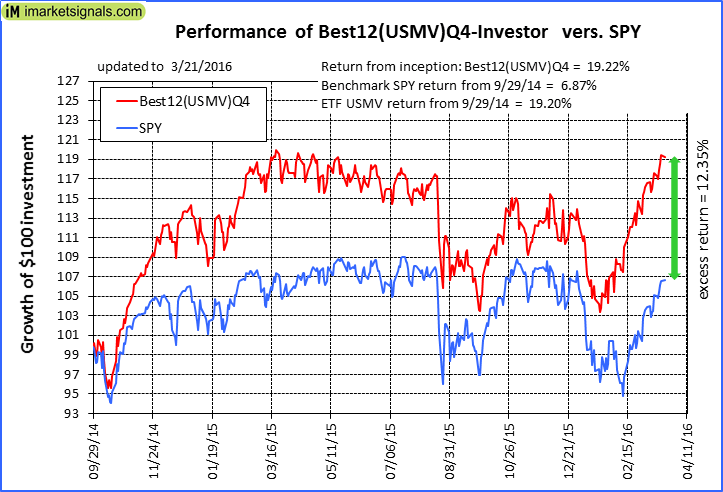
iM-Best12(USMV)Q4-Investor: Since inception, on 9/30/2014, the model gained 19.22% while the benchmark SPY gained 6.87% and the ETF USMV gained 19.20% over the same period. Over the previous week the market value of iM-Best12(USMV)Q4 gained 1.67% at a time when SPY gained 1.59%. A starting capital of $100,000 at inception on 9/30/2014 would have grown to $119,223 which includes $324 cash and excludes $485 spent on fees and slippage. |
|
|
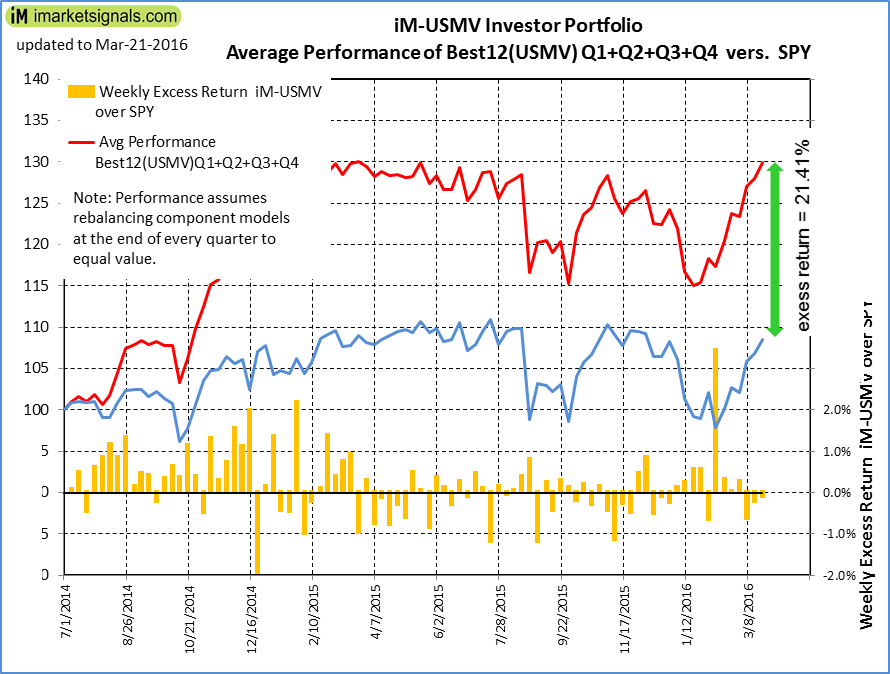
Average Performance of iM-Best12(USMV)Q1+Q2+Q3+Q4-Investor resulted in an excess return of 21.41% over SPY. (see iM-USMV Investor Portfolio) |
|
|
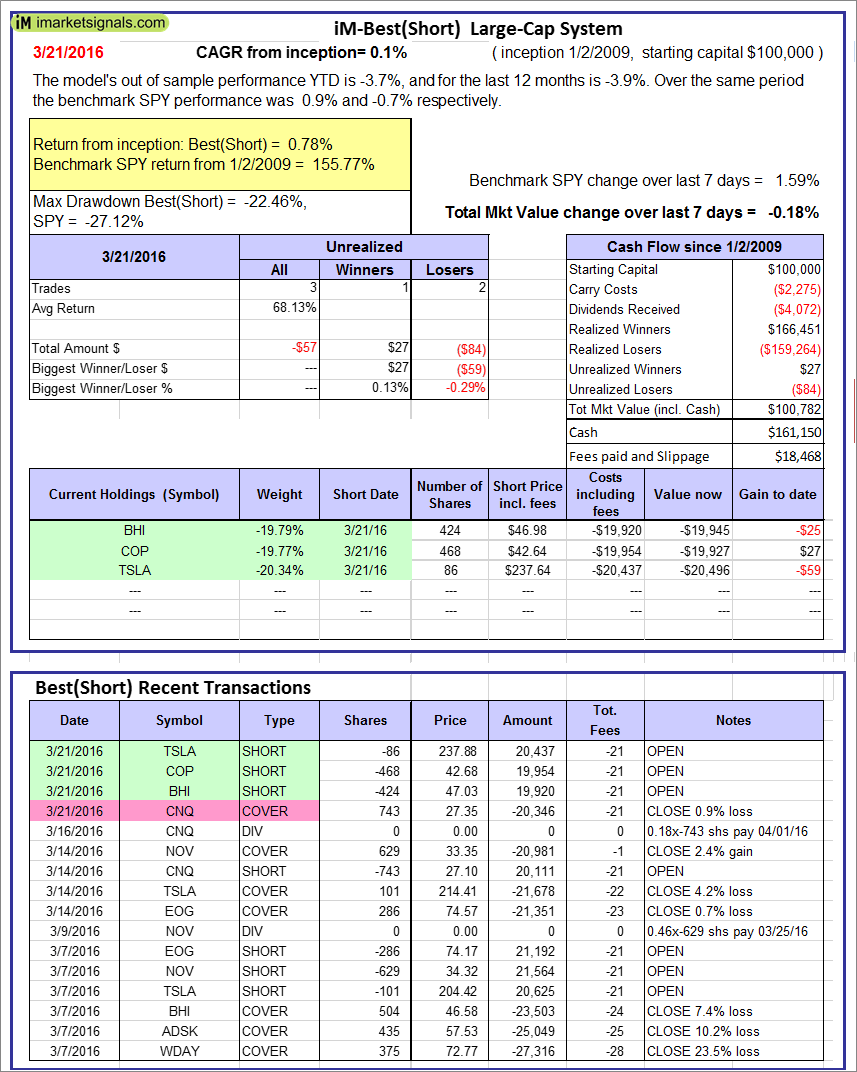
iM-Best(Short): The model’s out of sample performance YTD is -3.7%, and for the last 12 months is -3.9%. Over the same period the benchmark SPY performance was 0.9% and -0.7% respectively. Over the previous week the market value of iM-Best(Short) gained -0.18% at a time when SPY gained 1.59%. Over the period 1/2/2009 to 3/21/2016 the starting capital of $100,000 would have grown to $100,782 which includes $161,150 cash and excludes $18,468 spent on fees and slippage. |


Leave a Reply
You must be logged in to post a comment.