
  |
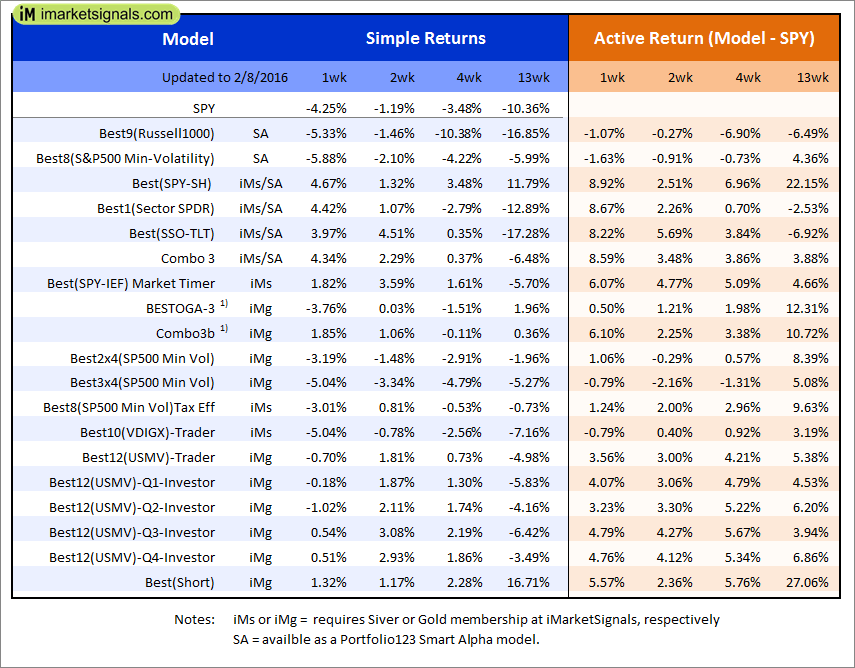
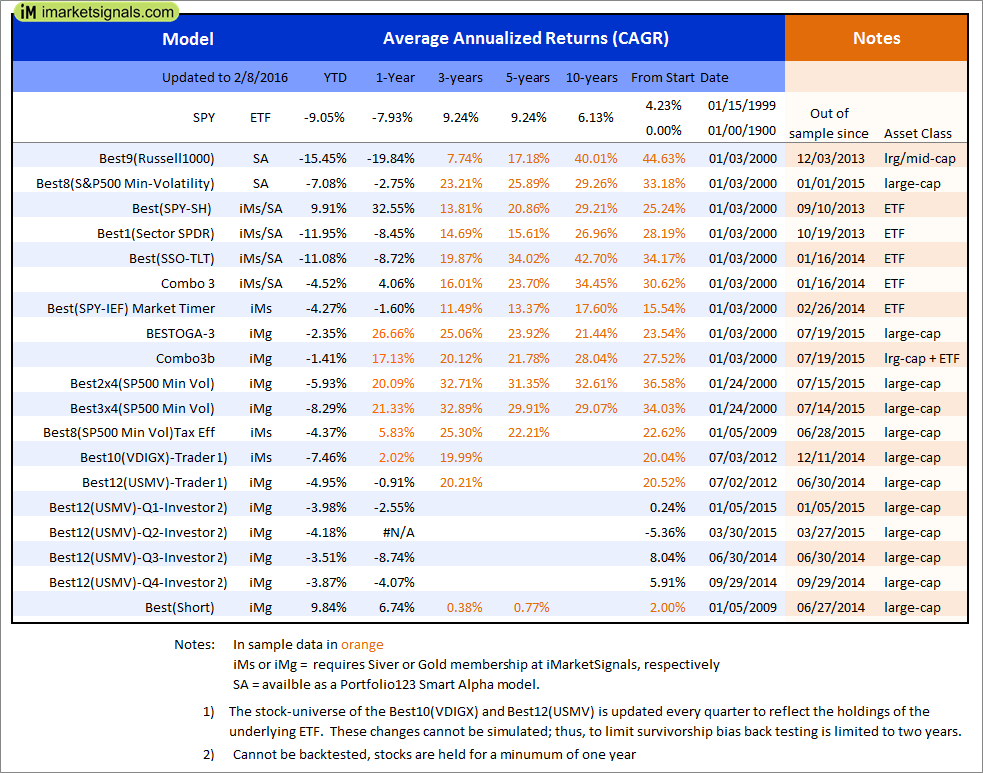
Out of sample performance summary of our models for the past 1, 2, 4 and 13 week periods. The active active return indicates how the models over- or underperformed the benchmark ETF SPY. Also the YTD, and the 1-, 3-, 5- and 10-year annualized returns are shown in the second table |
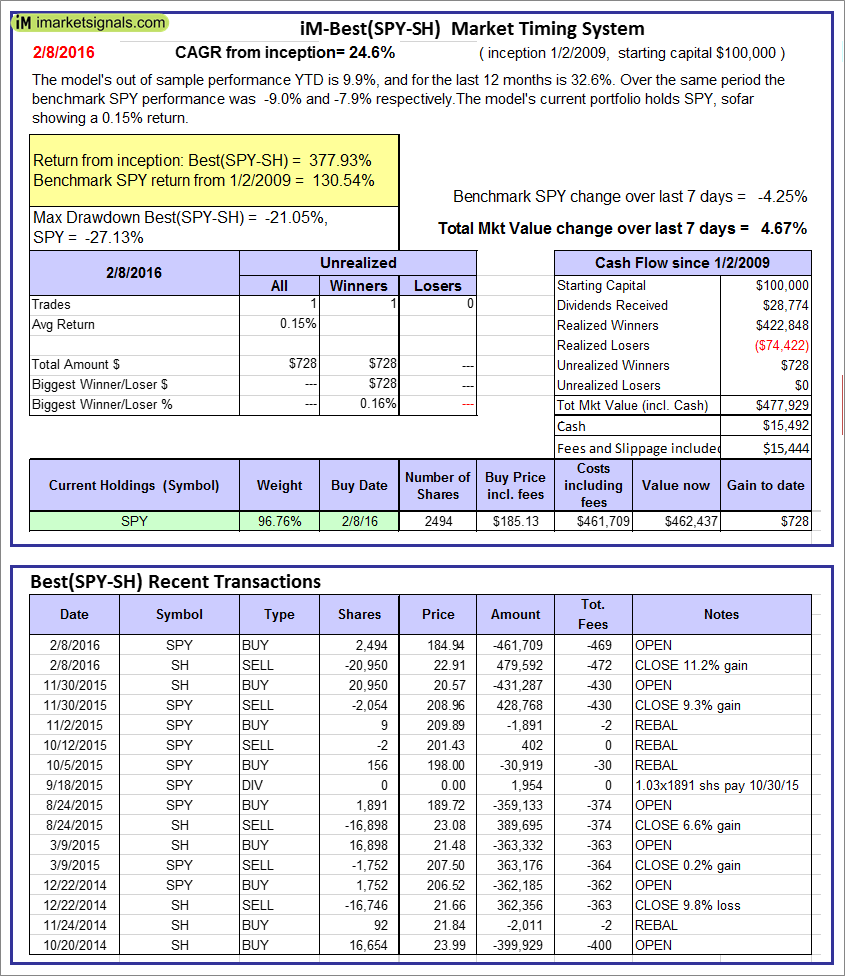 |
iM-Best(SPY-SH): The model’s out of sample performance YTD is 9.9%, and for the last 12 months is 32.6%. Over the same period the benchmark SPY performance was -9.0% and -7.9% respectively. Over the previous week the market value of Best(SPY-SH) gained 4.67% at a time when SPY gained -4.25%. A starting capital of $100,000 at inception on 1/2/2009 would have grown to $477,929 which includes $15,492 cash and excludes $15,444 spent on fees and slippage. |
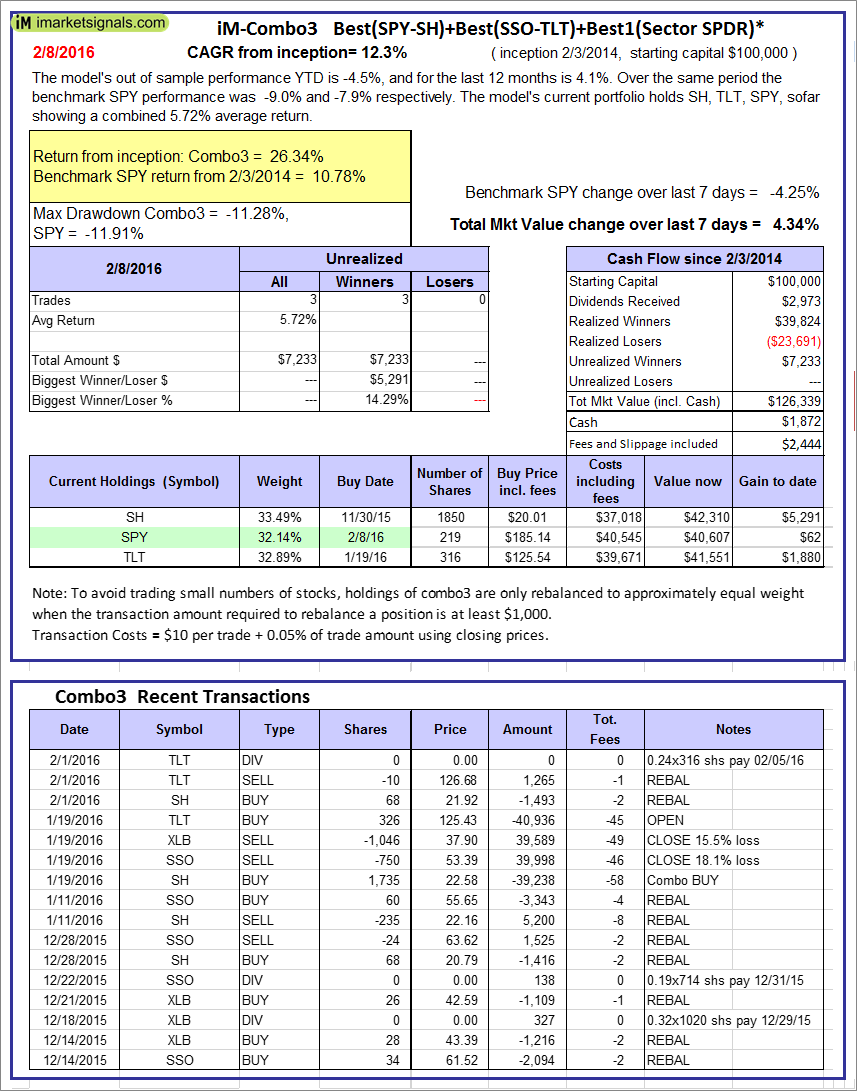 |
iM-Combo3: The model’s out of sample performance YTD is -4.5%, and for the last 12 months is 4.1%. Over the same period the benchmark SPY performance was -9.0% and -7.9% respectively. Over the previous week the market value of iM-Combo-3 gained 4.34% at a time when SPY gained -4.25%[/iM]. A starting capital of $100,000 at inception on 2/3/2014 would have grown to $126,339 which includes $1,872 cash and excludes $2,444 spent on fees and slippage. |
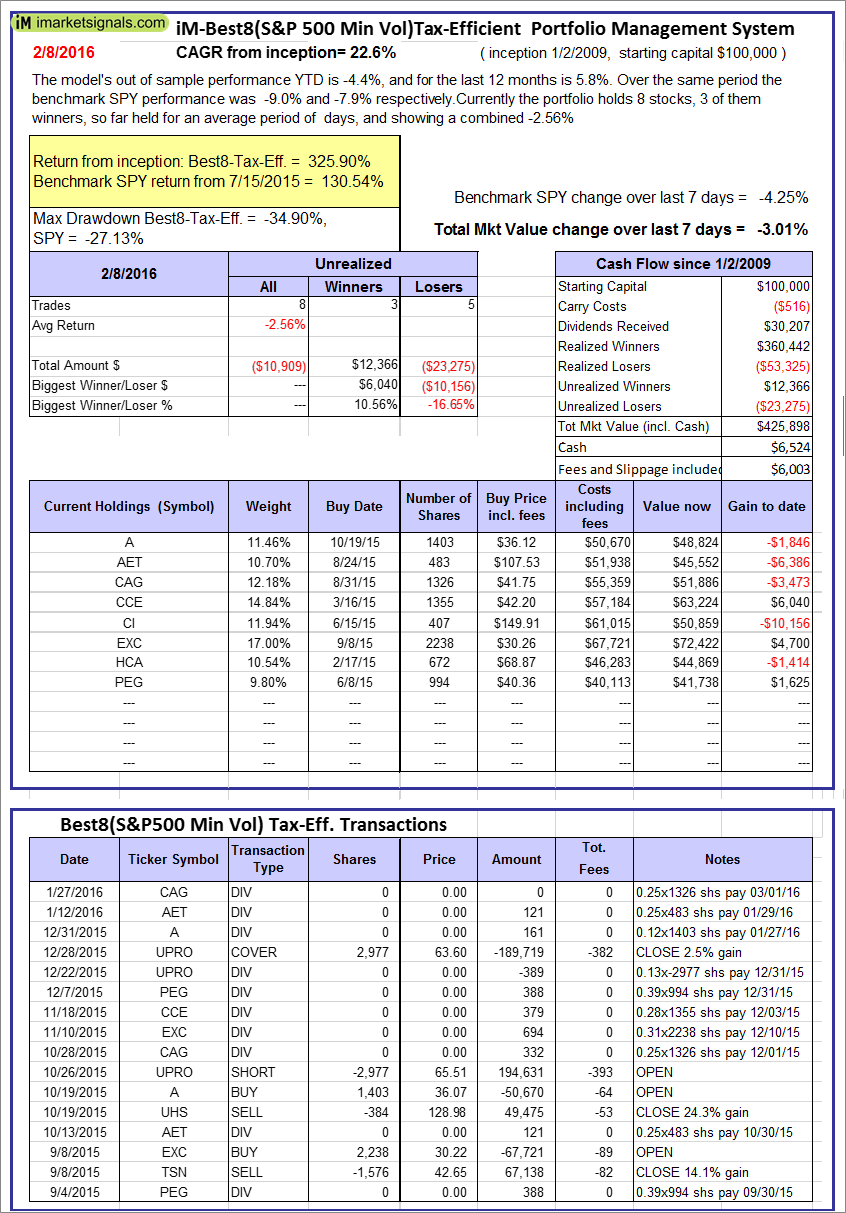 |
The iM-Best8(S&P500 Min Vol)Tax-Efficient The model’s out of sample performance YTD is -4.4%, and for the last 12 months is 5.8%. Over the same period the benchmark SPY performance was -9.0% and -7.9% respectively. Over the previous week the market value of iM-Best8(S&P 500)Tax-Eff. gained -3.01% at a time when SPY gained -4.25%. A starting capital of $100,000 at inception on 1/2/2009 would have grown to $425,898 which includes $6,524 cash and excludes $6,003 spent on fees and slippage. |
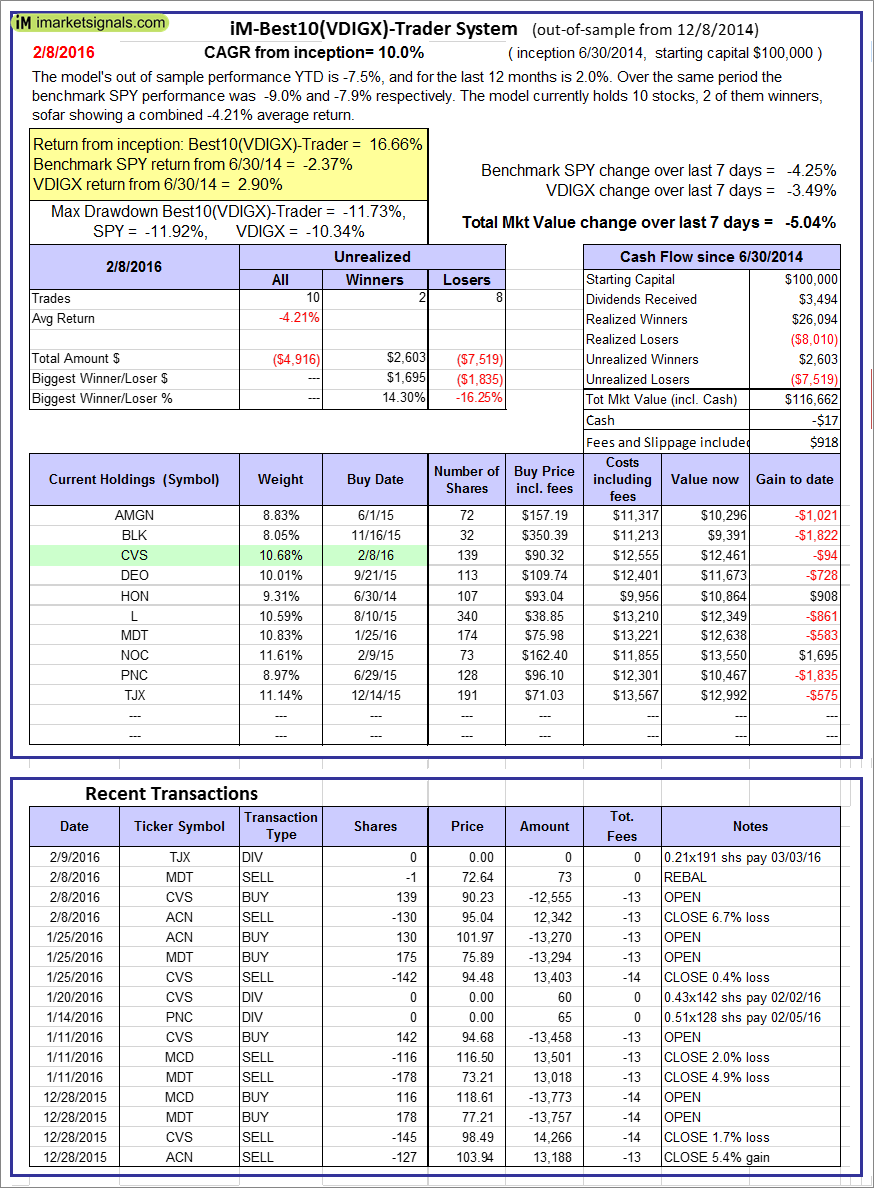 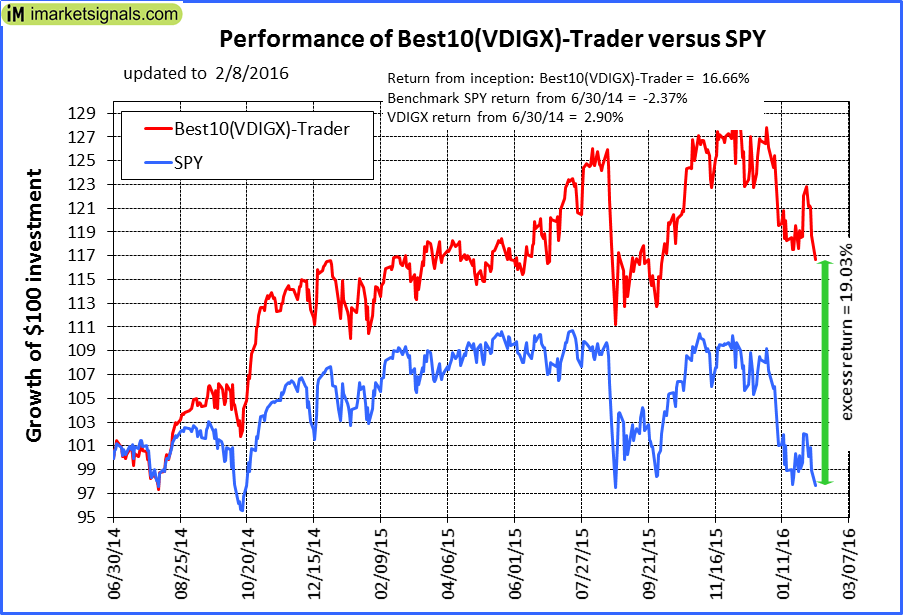 |
iM-Best10(VDIGX)-Trader: The model’s out of sample performance YTD is -7.5%, and for the last 12 months is 2.0%. Over the same period the benchmark SPY performance was -9.0% and -7.9% respectively. Since inception, on 7/1/2014, the model gained 16.66% while the benchmark SPY gained -2.37% and the ETF VDIGX gained 2.90% over the same period. Over the previous week the market value of iM-Best10(VDIGX) gained -5.04% at a time when SPY gained -4.25%. A starting capital of $100,000 at inception on 7/1/2014 would have grown to $116,662 which includes -$17 cash and excludes $918 spent on fees and slippage. |
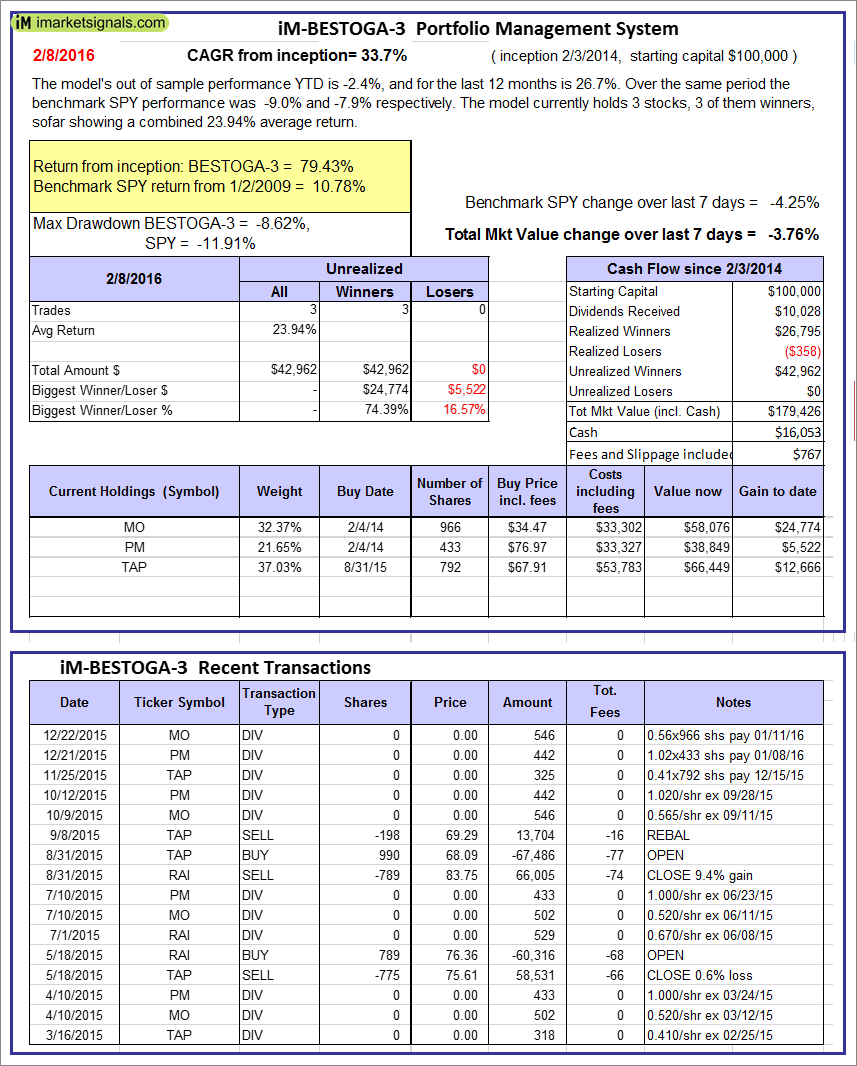 |
iM-BESTOGA-3: The model’s out of sample performance YTD is -2.4%, and for the last 12 months is 26.7%. Over the same period the benchmark SPY performance was -9.0% and -7.9% respectively. Over the previous week the market value of iM-BESTOGA-3 gained -3.76% at a time when SPY gained -4.25%. A starting capital of $100,000 at inception on 2/3/2014 would have grown to $179,426 which includes $16,053 cash and excludes $767 spent on fees and slippage. |
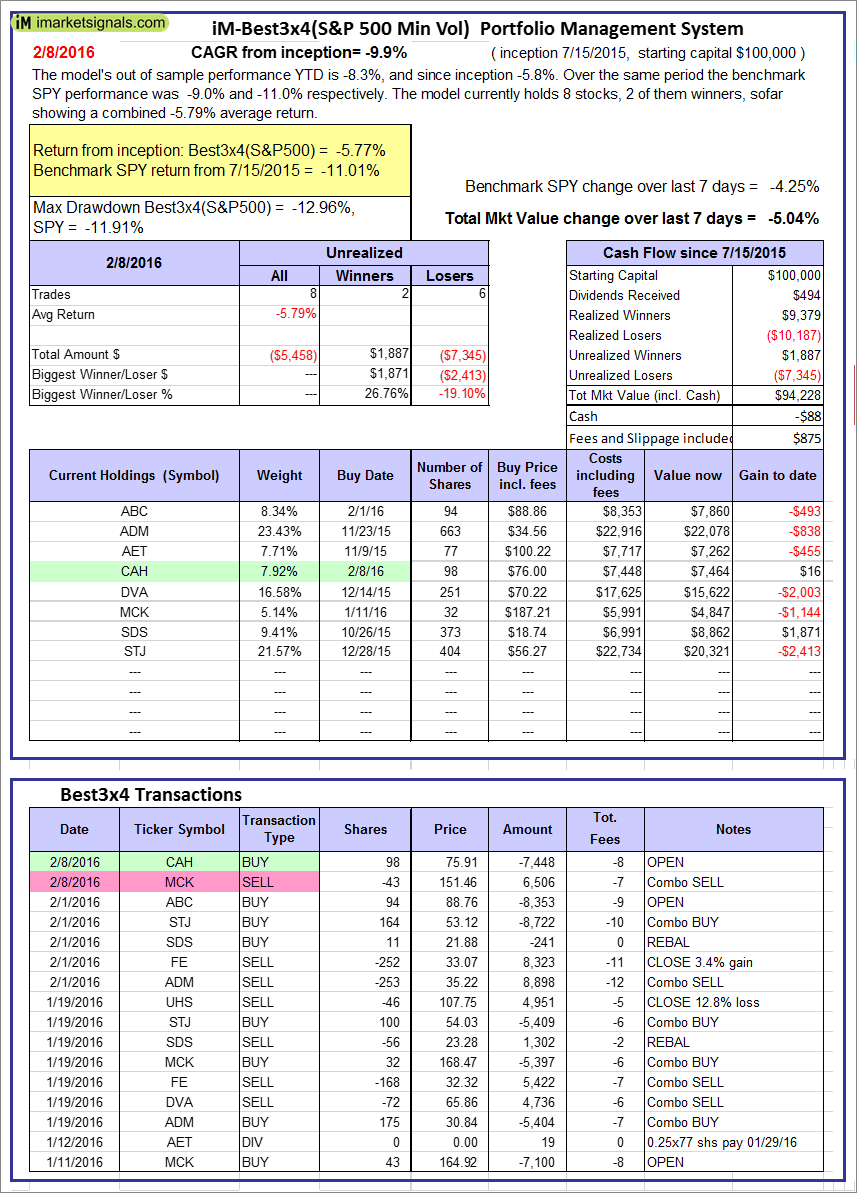 |
iM-Best3x4(S&P 500 Min Vol): The model’s out of sample performance YTD is -8.3%, and since inception -5.8%. Over the same period the benchmark SPY performance was -9.0% and -11.0% respectively. Over the previous week the market value of iM-Best3x4 gained -5.04% at a time when SPY gained -4.25%. A starting capital of $100,000 at inception on 7/15/2015 would have grown to $94,228 which includes -$88 cash and excludes $875 spent on fees and slippage. |
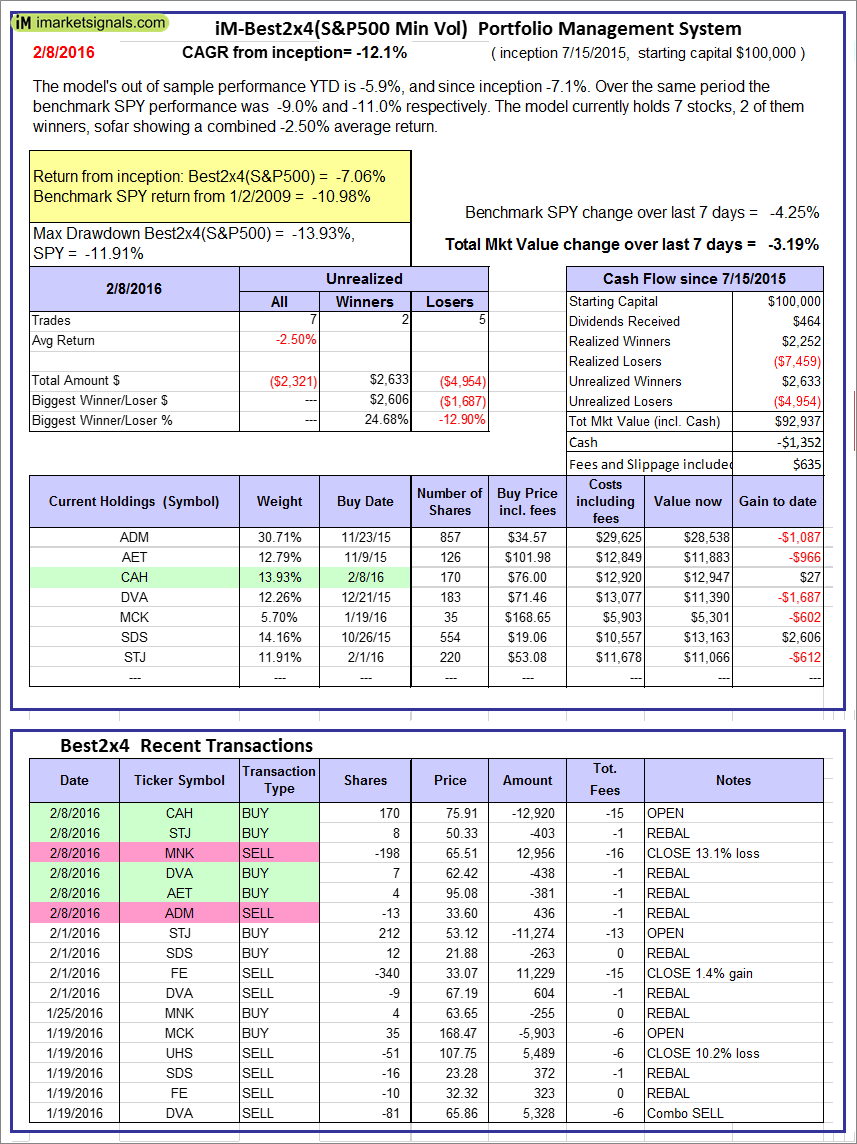 |
iM-Best2x4(S&P 500 Min Vol): The model’s out of sample performance YTD is -5.9%, and since inception -7.1%. Over the same period the benchmark SPY performance was -9.0% and -11.0% respectively. Over the previous week the market value of iM-Best2x4 gained -3.19% at a time when SPY gained -4.25%. A starting capital of $100,000 at inception on 7/16/2015 would have grown to $92,937 which includes -$1,352 cash and excludes $635 spent on fees and slippage. |
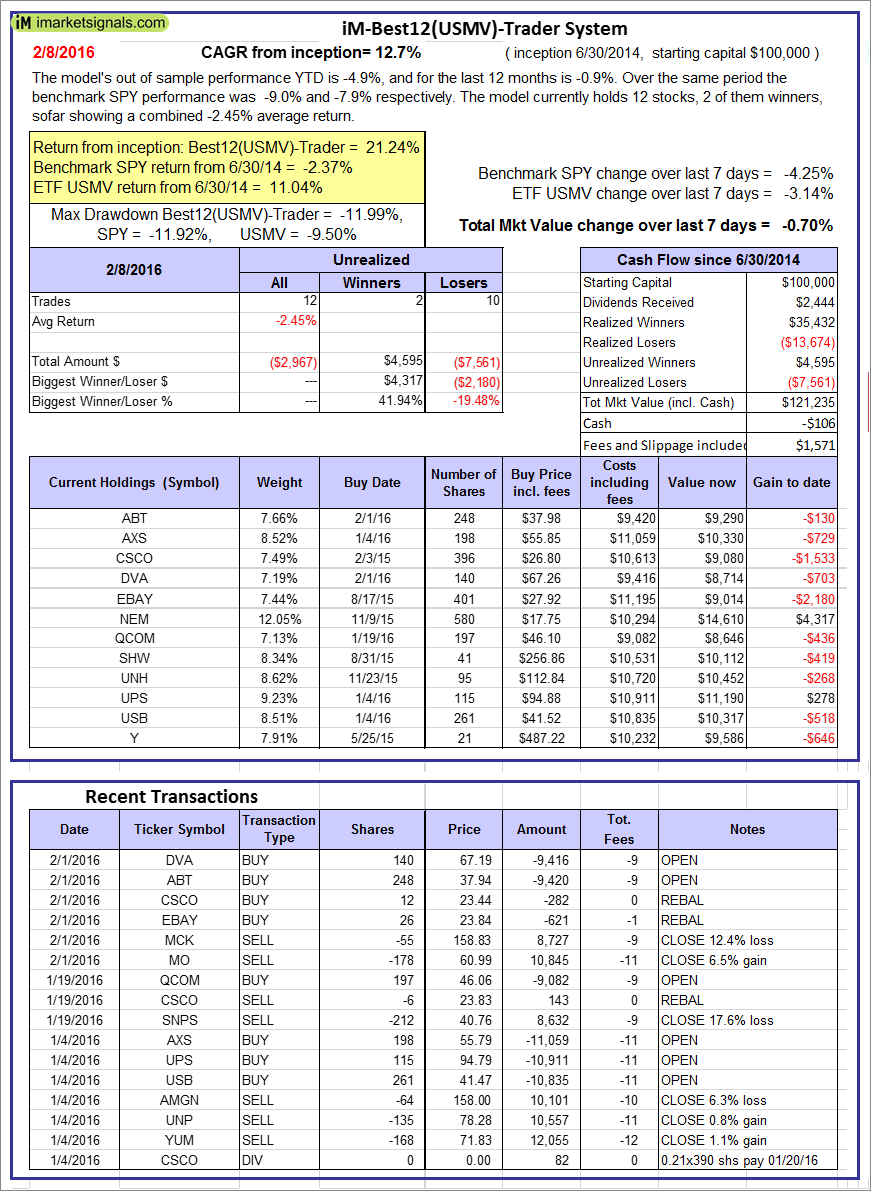 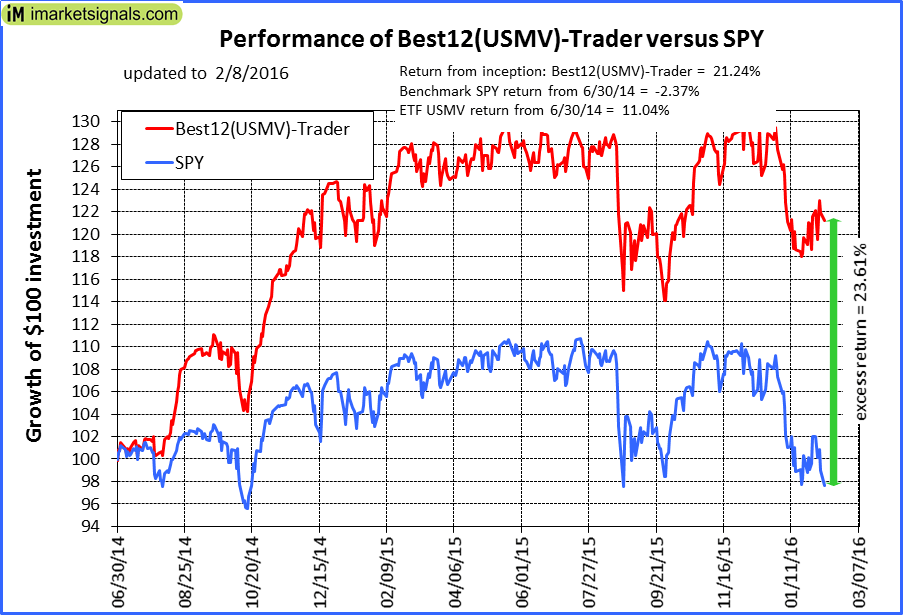 |
iM-Best12(USMV)-Trader: The model’s out of sample performance YTD is -4.9%, and for the last 12 months is -0.9%. Over the same period the benchmark SPY performance was -9.0% and -7.9% respectively. Since inception, on 7/1/2014, the model gained 21.24% while the benchmark SPY gained -2.37% and the ETF USMV gained 11.04% over the same period. Over the previous week the market value of iM-Best12(USMV)-Trader gained -0.70% at a time when SPY gained -4.25%. A starting capital of $100,000 at inception on 7/1/2014 would have grown to $121,235 which includes -$106 cash and excludes $1,571 spent on fees and slippage. |
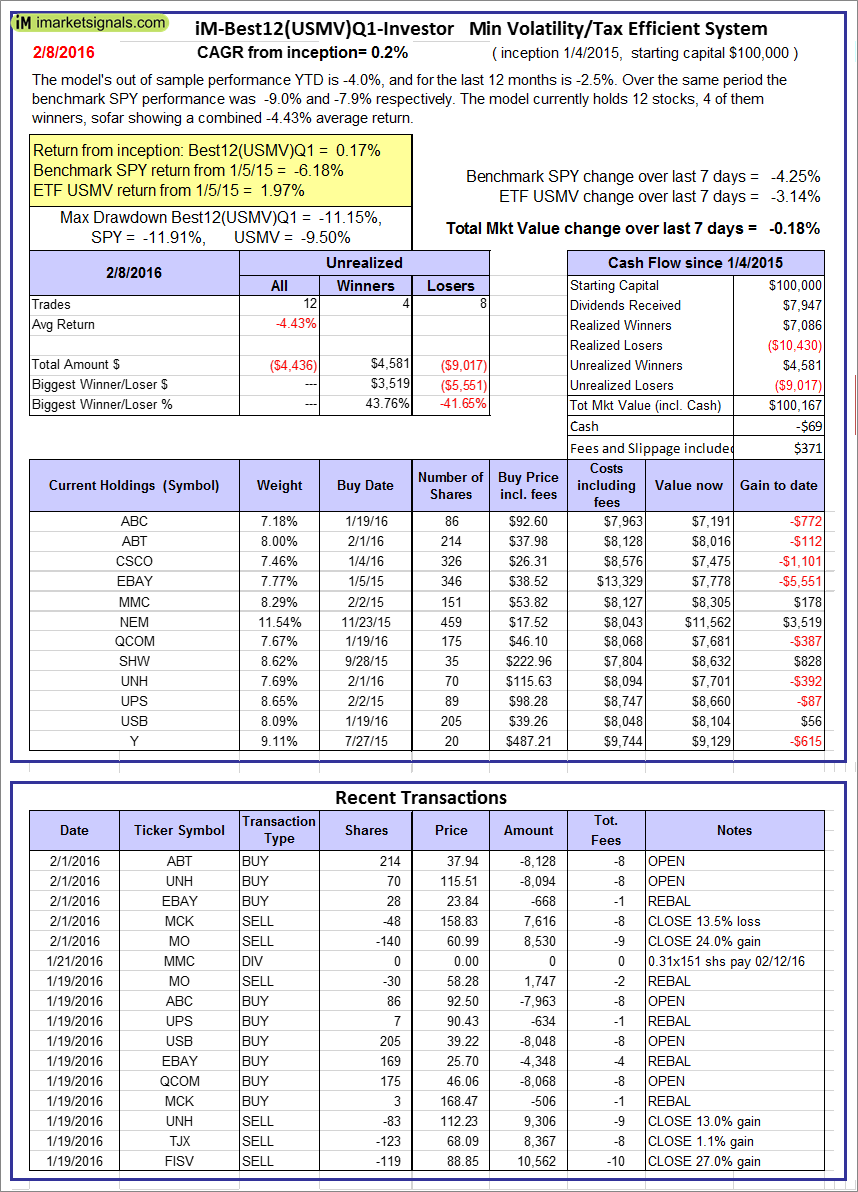 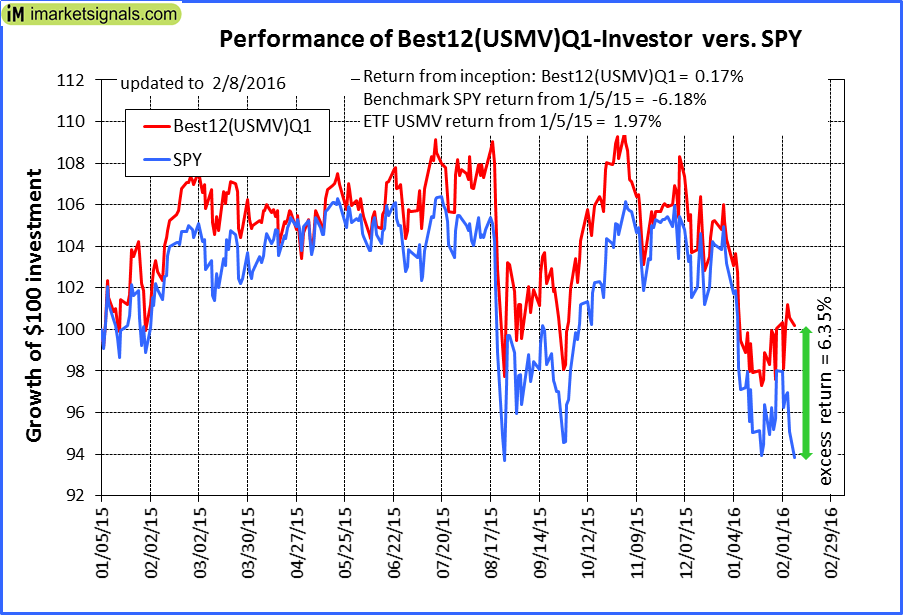 |
iM-Best12(USMV)Q1-Investor: The model’s out of sample performance YTD is -4.0%, and for the last 12 months is -2.5%. Over the same period the benchmark SPY performance was -9.0% and -7.9% respectively. Since inception, on 1/5/2015, the model gained 0.17% while the benchmark SPY gained -6.18% and the ETF USMV gained 1.97% over the same period. Over the previous week the market value of iM-Best12(USMV)Q1 gained -0.18% at a time when SPY gained -4.25%. A starting capital of $100,000 at inception on 1/5/2015 would have grown to $100,167 which includes -$69 cash and excludes $371 spent on fees and slippage. |
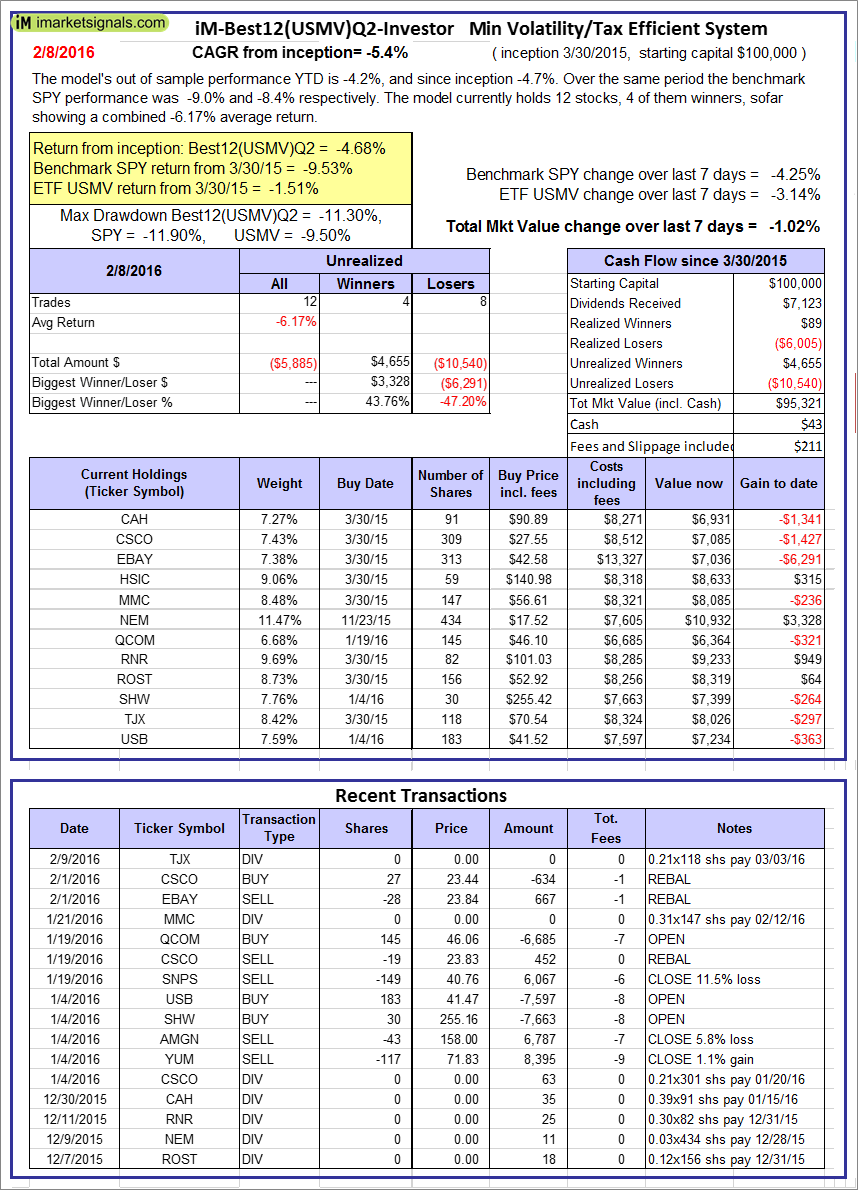  |
iM-Best12(USMV)Q2-Investor: The model’s out of sample performance YTD is -4.2%, and since inception -4.7%. Over the same period the benchmark SPY performance was -9.0% and -8.4% respectively. Since inception, on 3/31/2015, the model gained -4.68% while the benchmark SPY gained -9.53% and the ETF USMV gained -1.51% over the same period. Over the previous week the market value of iM-Best12(USMV)Q2 gained -1.02% at a time when SPY gained -4.25%. A starting capital of $100,000 at inception on 3/31/2015 would have grown to $95,321 which includes $43 cash and excludes $211 spent on fees and slippage. |
 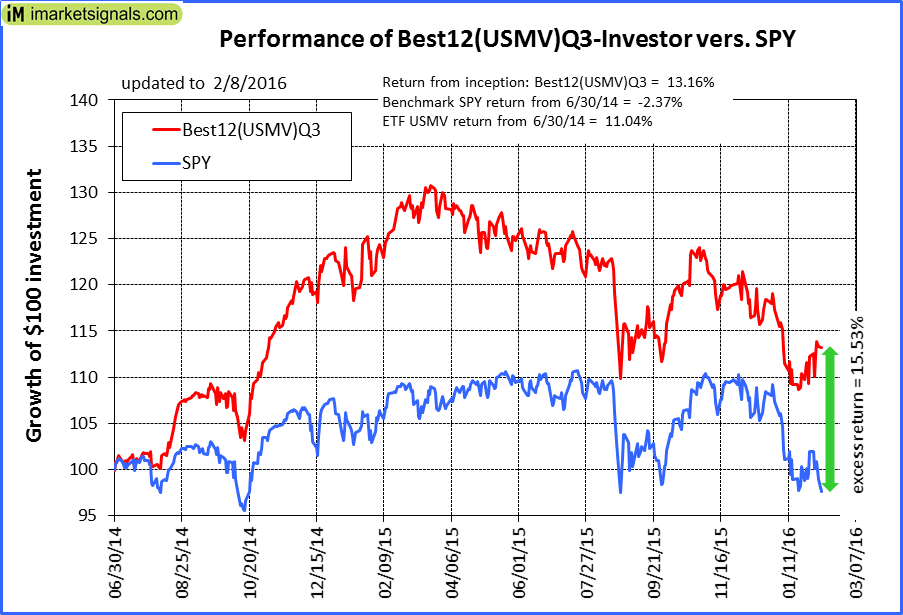 |
iM-Best12(USMV)Q3-Investor: The model’s out of sample performance YTD is -3.5%, and for the last 12 months is -8.7%. Over the same period the benchmark SPY performance was -9.0% and -7.9% respectively. Since inception, on 7/1/2014, the model gained 13.16% while the benchmark SPY gained -2.37% and the ETF USMV gained 11.04% over the same period. Over the previous week the market value of iM-Best12(USMV)Q3 gained 0.54% at a time when SPY gained -4.25%. A starting capital of $100,000 at inception on 7/1/2014 would have grown to $113,158 which includes -$10 cash and excludes $547 spent on fees and slippage. |
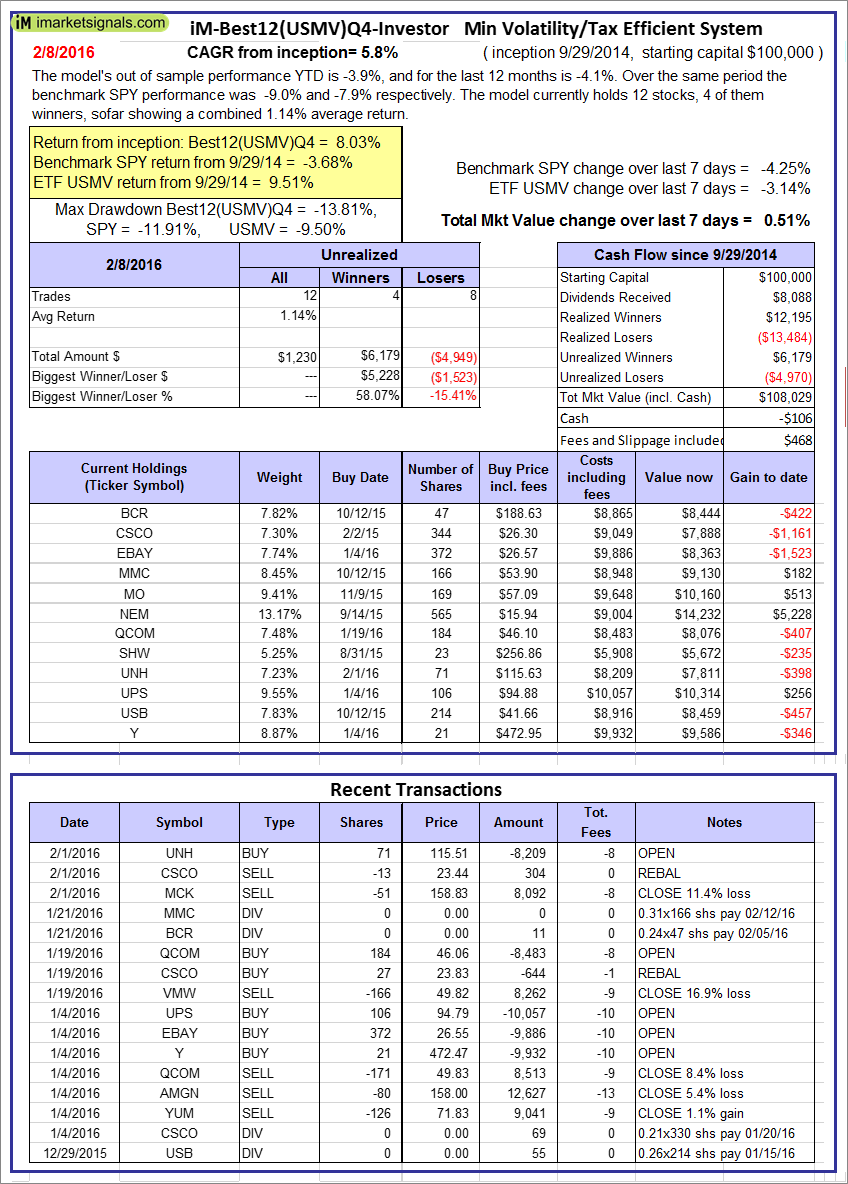 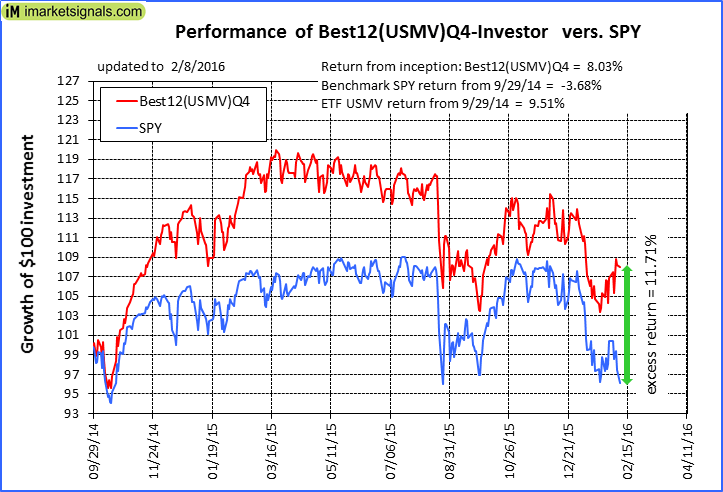 |
iM-Best12(USMV)Q4-Investor: Since inception, on 9/30/2014, the model gained 8.03% while the benchmark SPY gained -3.68% and the ETF USMV gained 9.51% over the same period. Over the previous week the market value of iM-Best12(USMV)Q4 gained 0.51% at a time when SPY gained -4.25%. A starting capital of $100,000 at inception on 9/30/2014 would have grown to $108,029 which includes -$106 cash and excludes $468 spent on fees and slippage. |
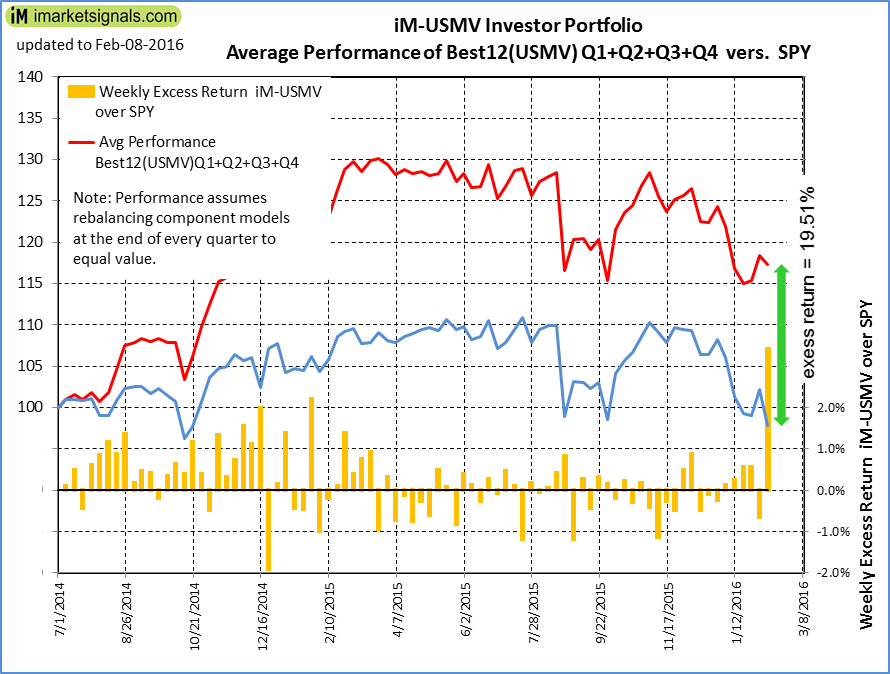 |
Average Performance of iM-Best12(USMV)Q1+Q2+Q3+Q4-Investor resulted in an excess return of 19.51% over SPY. (see iM-USMV Investor Portfolio) |
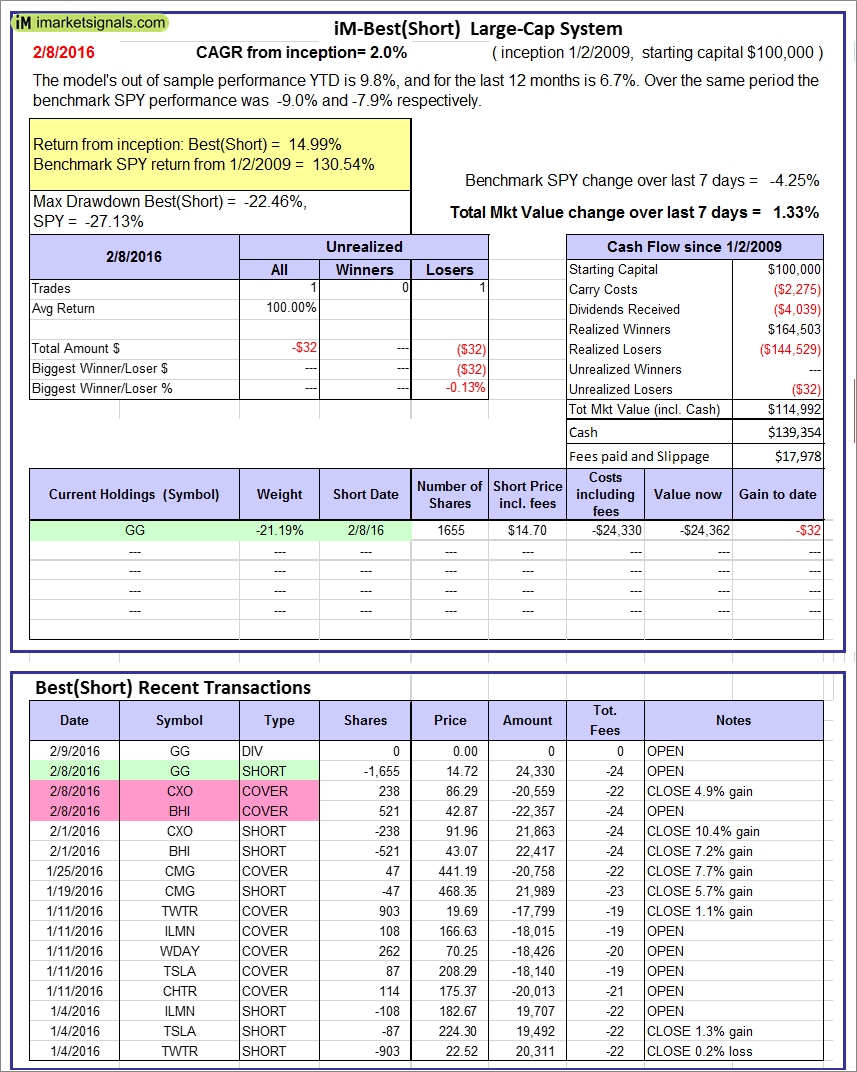 |
iM-Best(Short): The model’s out of sample performance YTD is 9.8%, and for the last 12 months is 6.7%. Over the same period the benchmark SPY performance was -9.0% and -7.9% respectively. Over the previous week the market value of iM-Best(Short) gained 1.33% at a time when SPY gained -4.25%. Over the period 1/2/2009 to 2/8/2016 the starting capital of $100,000 would have grown to $114,992 which includes $139,354 cash and excludes $17,978 spent on fees and slippage. |
iM-Best Reports – 2/8/2016
Posted in pmp SPY-SH
Leave a Reply
You must be logged in to post a comment.