
  |
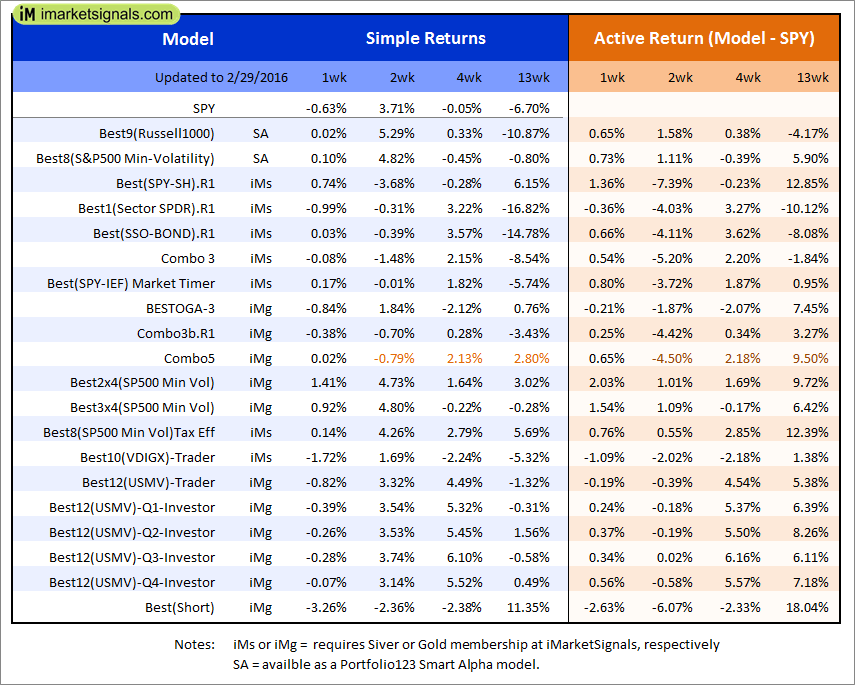
Out of sample performance summary of our models for the past 1, 2, 4 and 13 week periods. The active active return indicates how the models over- or underperformed the benchmark ETF SPY. Also the YTD, and the 1-, 3-, 5- and 10-year annualized returns are shown in the second table |
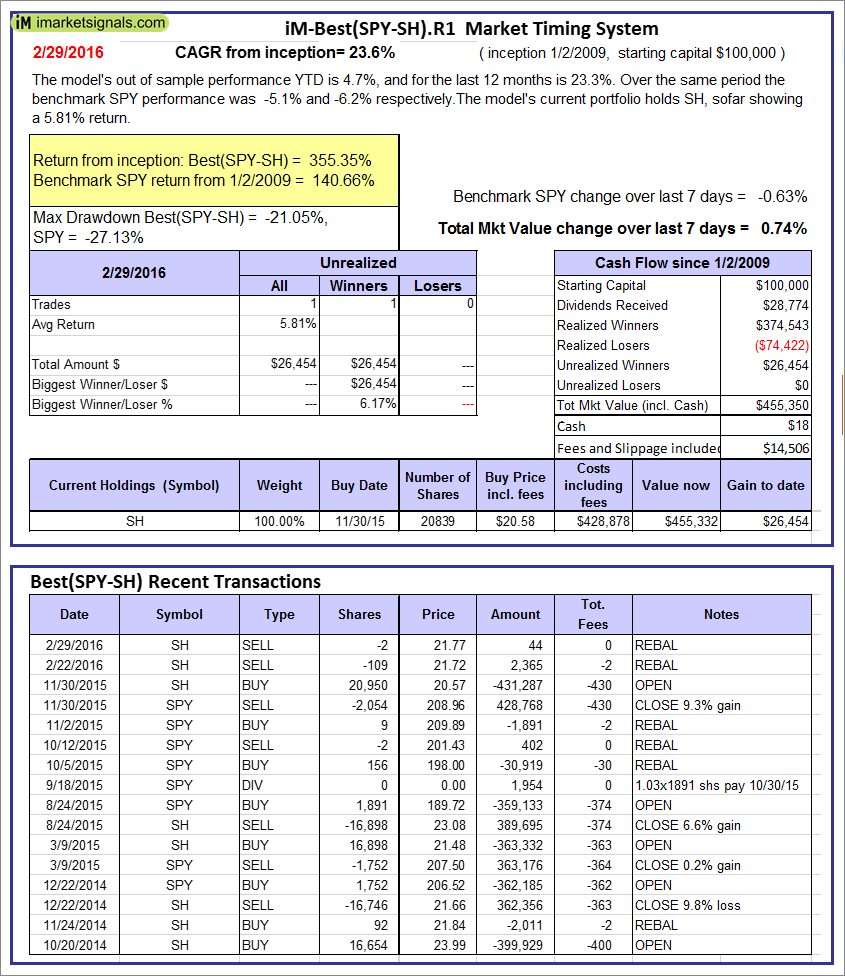 |
iM-Best(SPY-SH): The model’s out of sample performance YTD is 4.7%, and for the last 12 months is 23.3%. Over the same period the benchmark SPY performance was -5.1% and -6.2% respectively. Over the previous week the market value of Best(SPY-SH) gained 0.74% at a time when SPY gained -0.63%. A starting capital of $100,000 at inception on 1/2/2009 would have grown to $455,350 which includes $18 cash and excludes $14,506 spent on fees and slippage. |
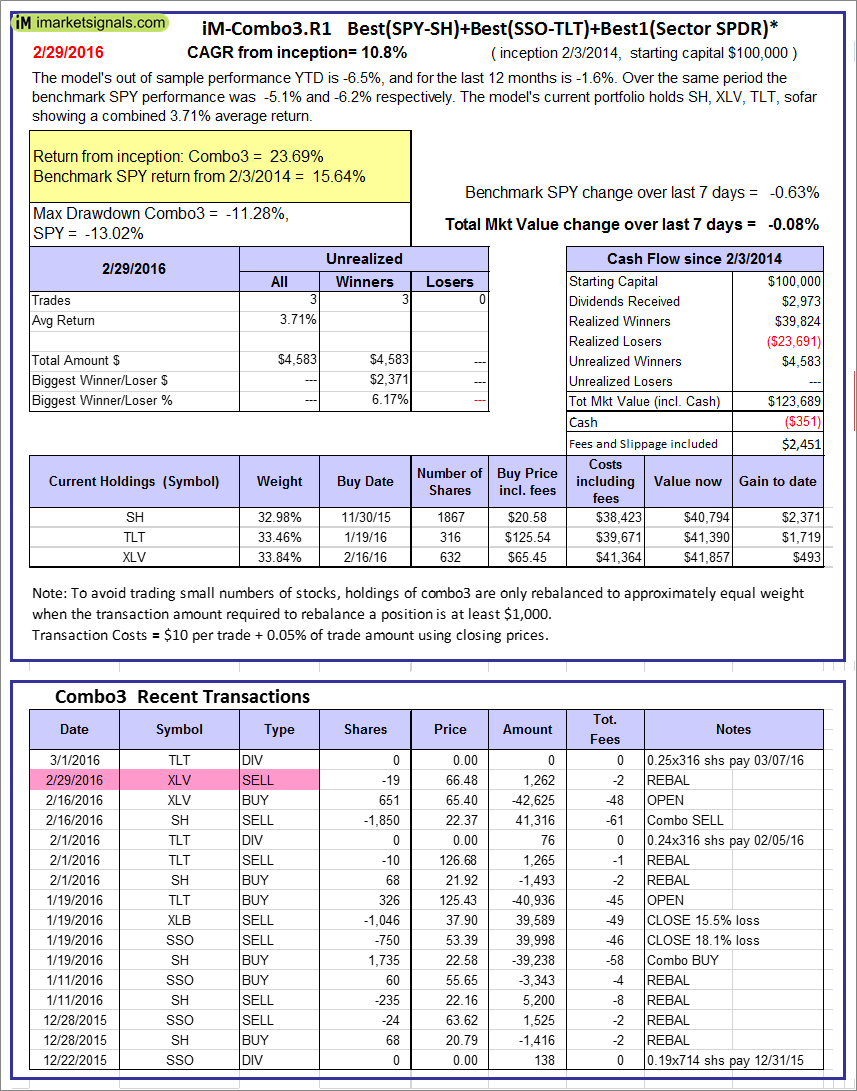 |
iM-Combo3: The model’s out of sample performance YTD is -6.5%, and for the last 12 months is -1.6%. Over the same period the benchmark SPY performance was -5.1% and -6.2% respectively. Over the previous week the market value of iM-Combo-3 gained -0.08% at a time when SPY gained -0.63%[/iM]. A starting capital of $100,000 at inception on 2/3/2014 would have grown to $123,689 which includes -$351 cash and excludes $2,451 spent on fees and slippage. |
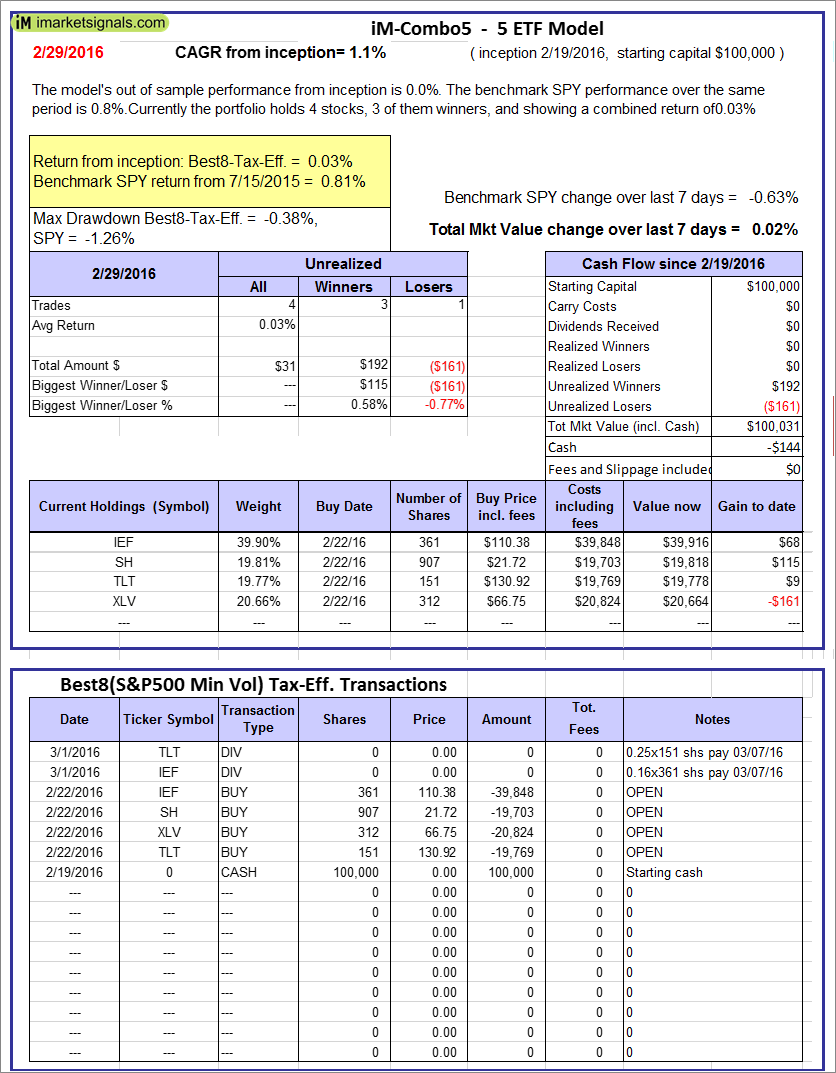 |
iM-Combo5: The model’s out of sample performance from inception is 0.0%. The benchmark SPY performance over the same period is 0.8%. Over the previous week the market value of iM-Combo-3 gained 0.02% at a time when SPY gained -0.63%. A starting capital of $100,000 at inception on 2/22/2016 would have grown to $100,031 which includes -$144 cash and excludes $0 spent on fees and slippage. |
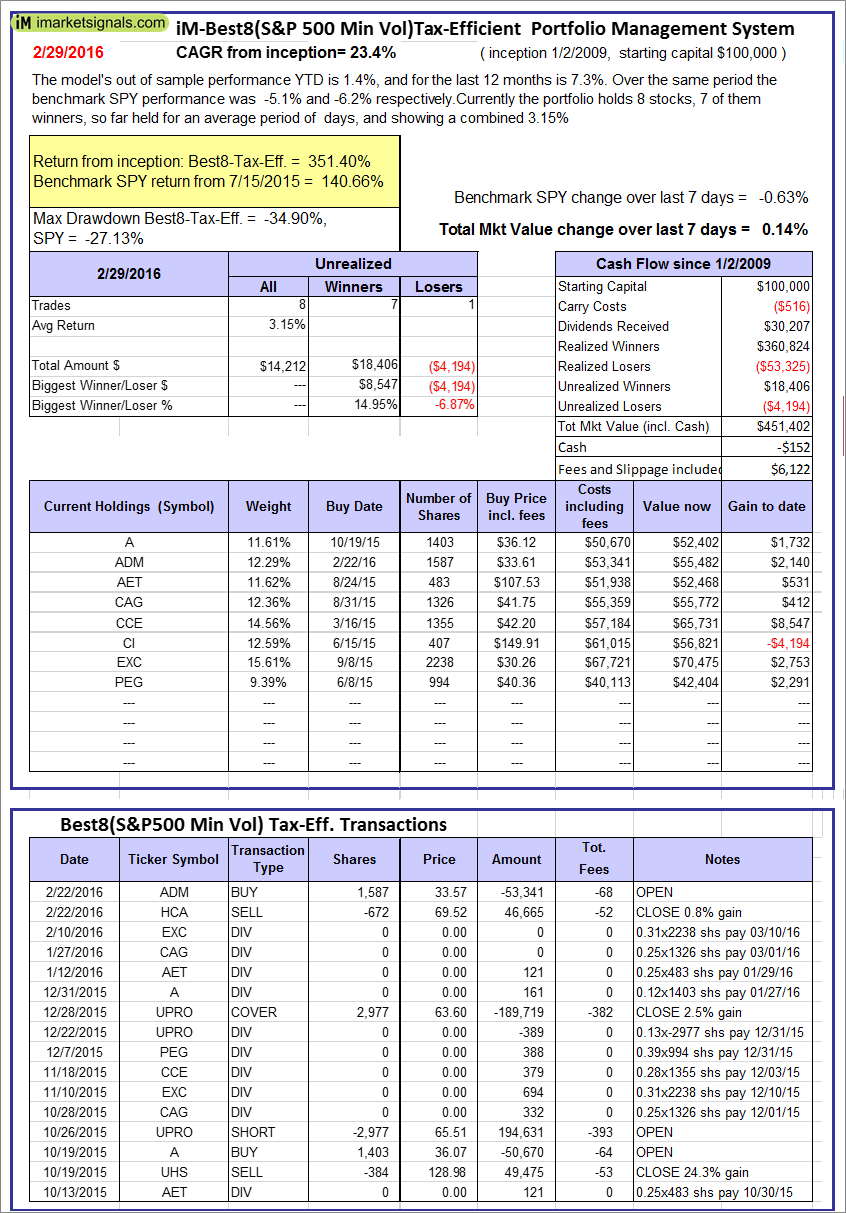 |
The iM-Best8(S&P500 Min Vol)Tax-Efficient The model’s out of sample performance YTD is 1.2%, and for the last 12 months is 8.3%. Over the same period the benchmark SPY performance was -4.5% and -5.9% respectively. Over the previous week the market value of iM-Best8(S&P 500)Tax-Eff. gained 2.61% at a time when SPY gained 2.63%. A starting capital of $100,000 at inception on 1/2/2009 would have grown to $450,777 which includes -$152 cash and excludes $6,122 spent on fees and slippage. |
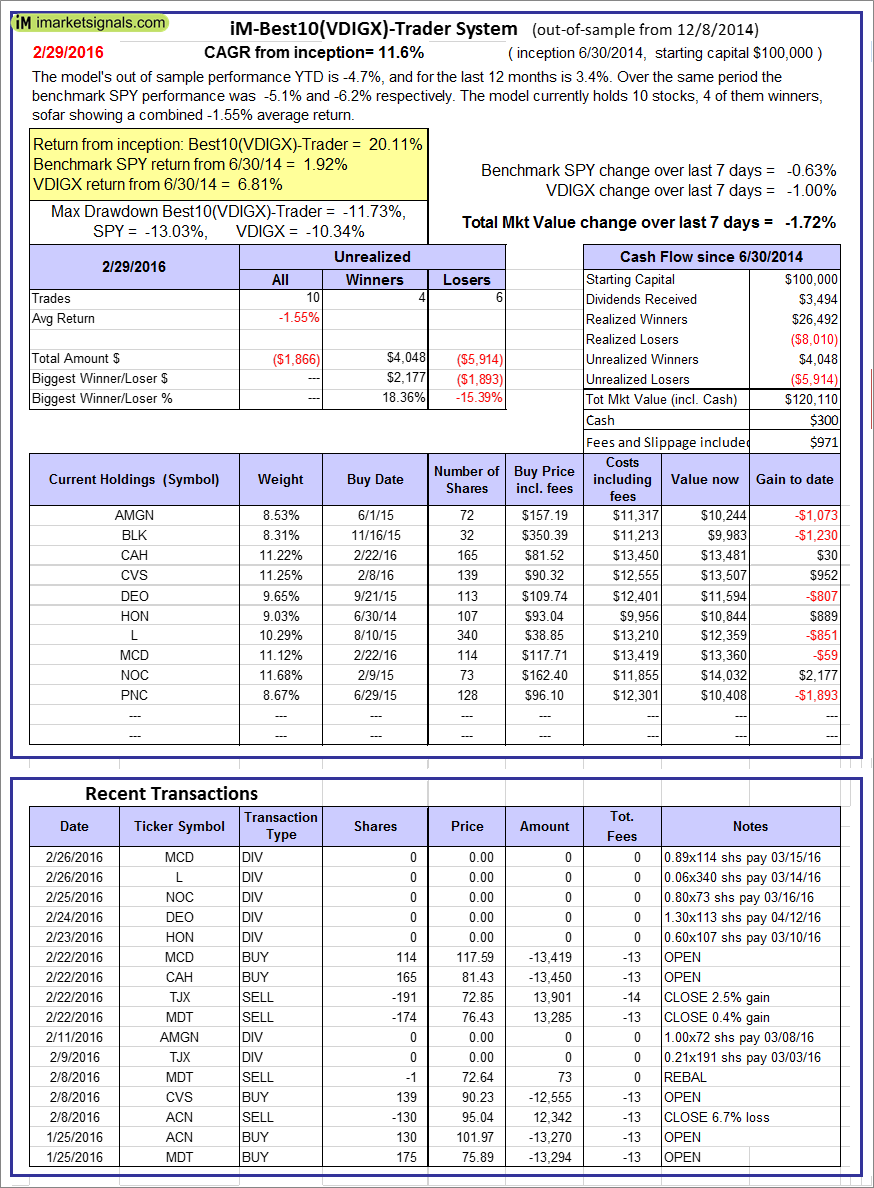 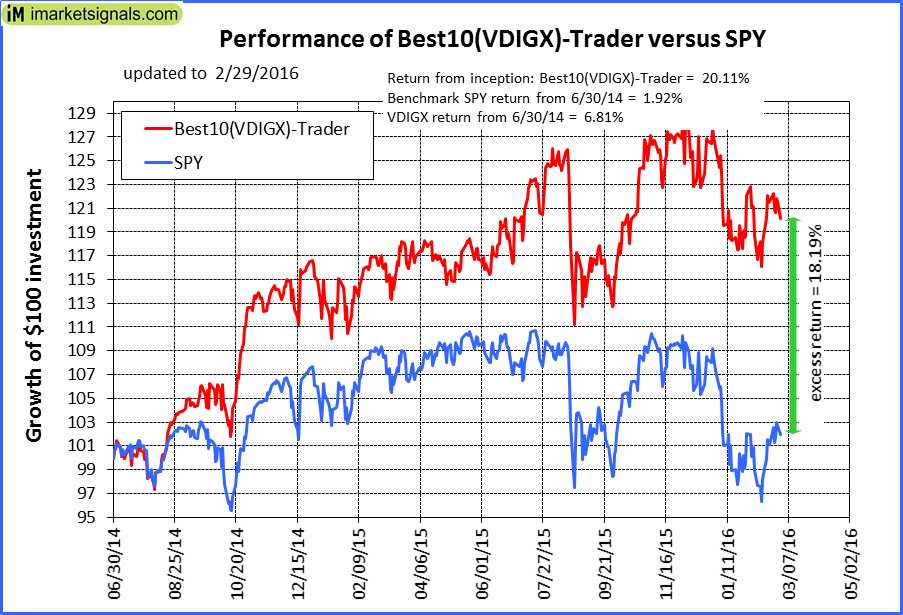 |
iM-Best10(VDIGX)-Trader: The model’s out of sample performance YTD is -4.7%, and for the last 12 months is 3.4%. Over the same period the benchmark SPY performance was -5.1% and -6.2% respectively. Since inception, on 7/1/2014, the model gained 20.11% while the benchmark SPY gained 1.92% and the ETF VDIGX gained 6.81% over the same period. Over the previous week the market value of iM-Best10(VDIGX) gained -1.72% at a time when SPY gained -0.63%. A starting capital of $100,000 at inception on 7/1/2014 would have grown to $120,110 which includes $300 cash and excludes $971 spent on fees and slippage. |
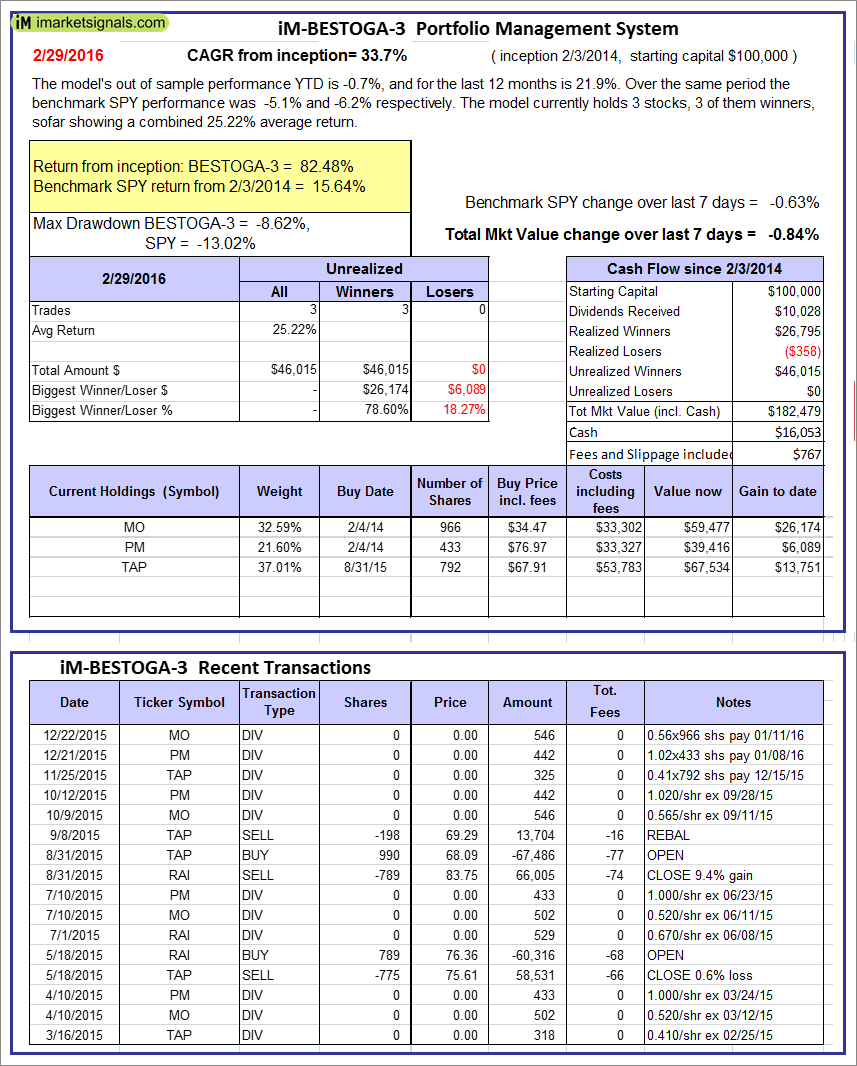 |
iM-BESTOGA-3: The model’s out of sample performance YTD is -0.7%, and for the last 12 months is 21.9%. Over the same period the benchmark SPY performance was -5.1% and -6.2% respectively. Over the previous week the market value of iM-BESTOGA-3 gained -0.84% at a time when SPY gained -0.63%. A starting capital of $100,000 at inception on 2/3/2014 would have grown to $182,479 which includes $16,053 cash and excludes $767 spent on fees and slippage. |
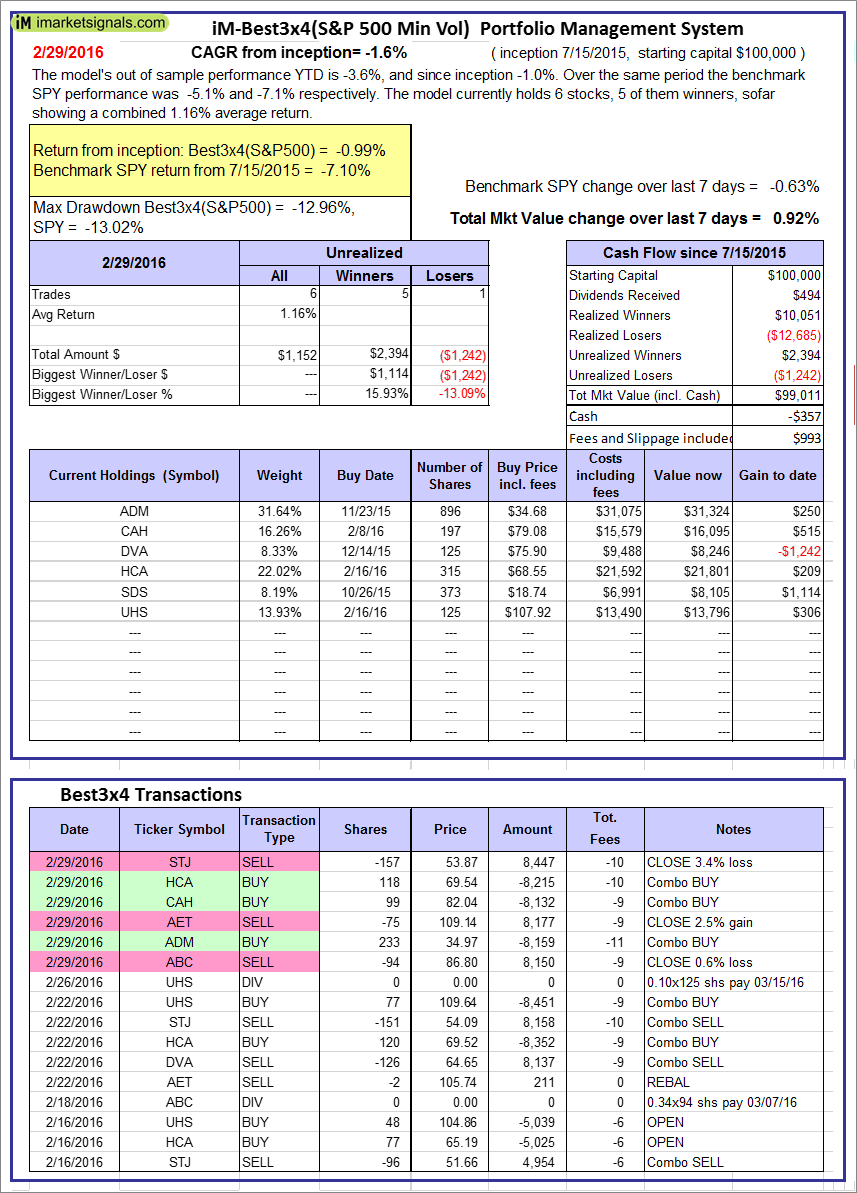 |
iM-Best3x4(S&P 500 Min Vol): The model’s out of sample performance YTD is -3.6%, and since inception -1.0%. Over the same period the benchmark SPY performance was -5.1% and -7.1% respectively. Over the previous week the market value of iM-Best3x4 gained 0.92% at a time when SPY gained -0.63%. A starting capital of $100,000 at inception on 7/15/2015 would have grown to $99,011 which includes -$357 cash and excludes $993 spent on fees and slippage. |
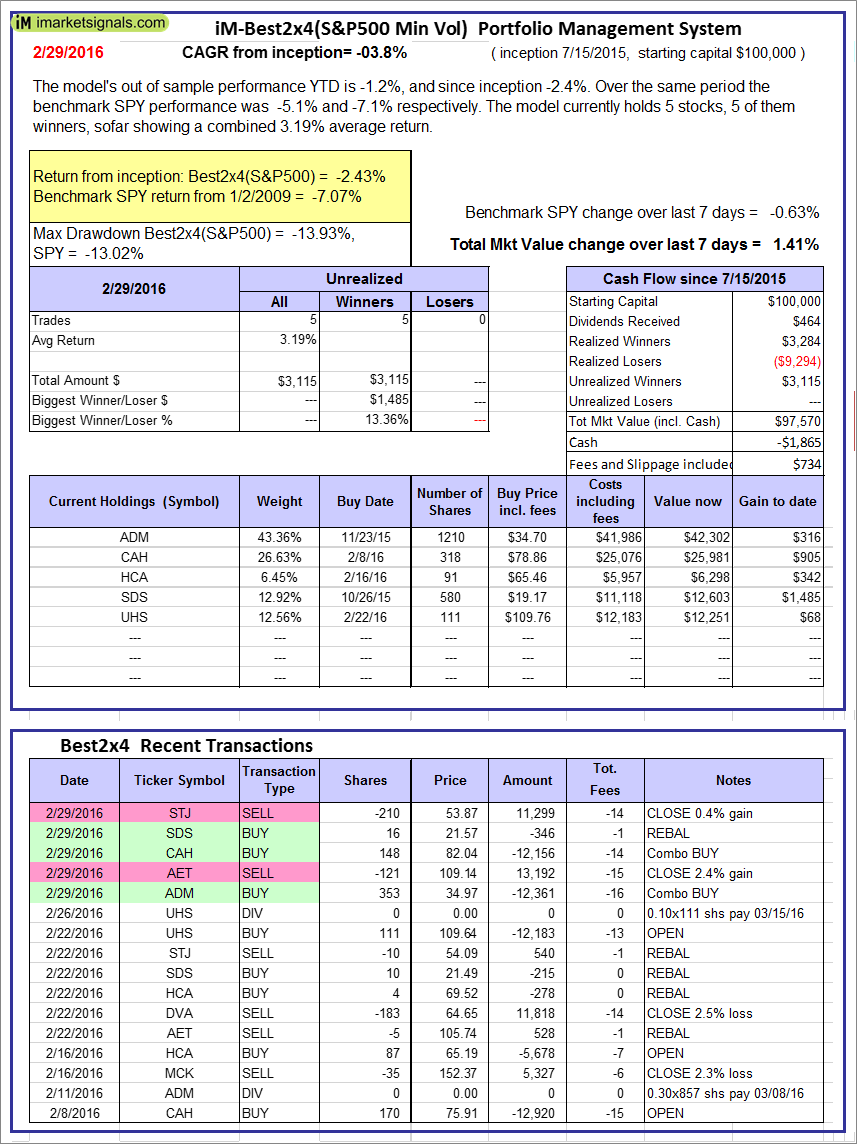 |
iM-Best2x4(S&P 500 Min Vol): The model’s out of sample performance YTD is -1.2%, and since inception -2.4%. Over the same period the benchmark SPY performance was -5.1% and -7.1% respectively. Over the previous week the market value of iM-Best2x4 gained 1.41% at a time when SPY gained -0.63%. A starting capital of $100,000 at inception on 7/16/2015 would have grown to $97,570 which includes -$1,865 cash and excludes $734 spent on fees and slippage. |
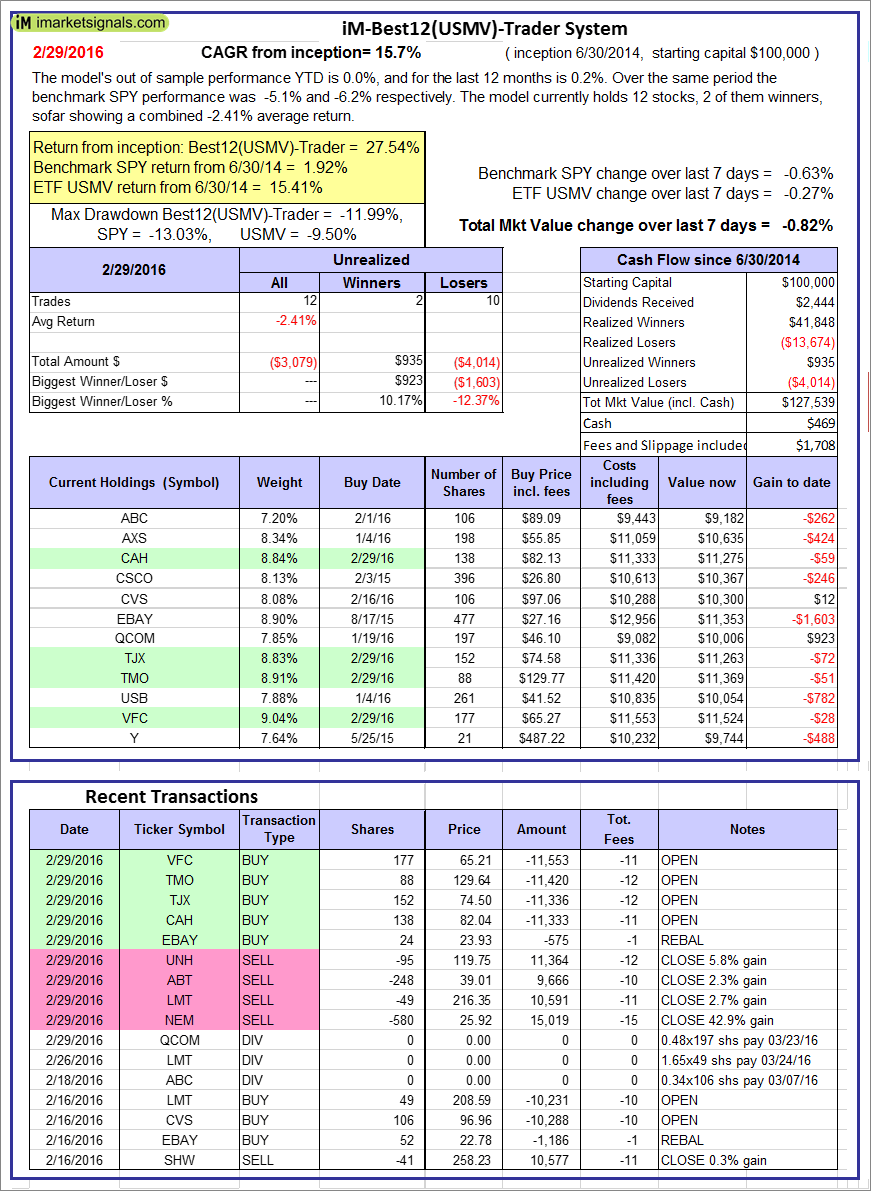  |
iM-Best12(USMV)-Trader: The model’s out of sample performance YTD is 0.0%, and for the last 12 months is 0.2%. Over the same period the benchmark SPY performance was -5.1% and -6.2% respectively. Since inception, on 7/1/2014, the model gained 27.54% while the benchmark SPY gained 1.92% and the ETF USMV gained 15.41% over the same period. Over the previous week the market value of iM-Best12(USMV)-Trader gained -0.82% at a time when SPY gained -0.63%. A starting capital of $100,000 at inception on 7/1/2014 would have grown to $127,539 which includes $469 cash and excludes $1,708 spent on fees and slippage. |
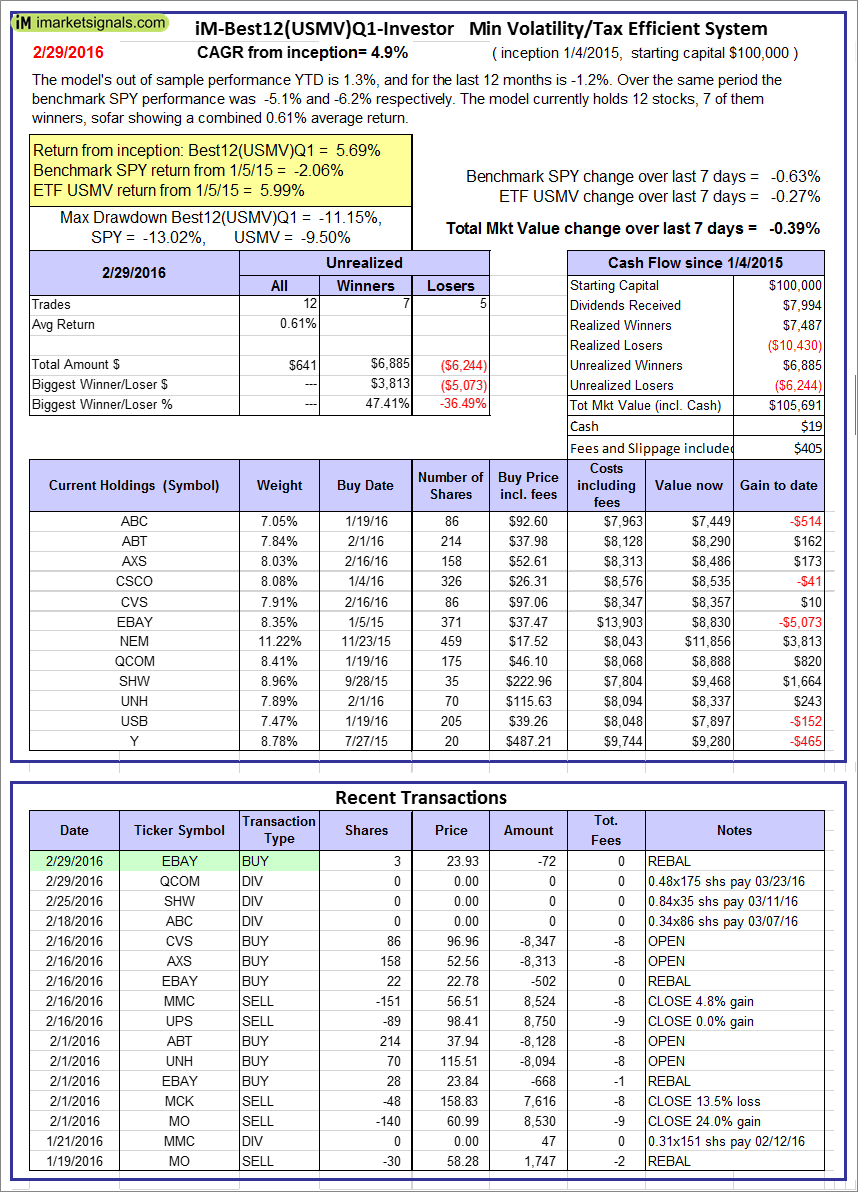  |
iM-Best12(USMV)Q1-Investor: The model’s out of sample performance YTD is 1.3%, and for the last 12 months is -1.2%. Over the same period the benchmark SPY performance was -5.1% and -6.2% respectively. Since inception, on 1/5/2015, the model gained 5.69% while the benchmark SPY gained -2.06% and the ETF USMV gained 5.99% over the same period. Over the previous week the market value of iM-Best12(USMV)Q1 gained -0.39% at a time when SPY gained -0.63%. A starting capital of $100,000 at inception on 1/5/2015 would have grown to $105,691 which includes $19 cash and excludes $405 spent on fees and slippage. |
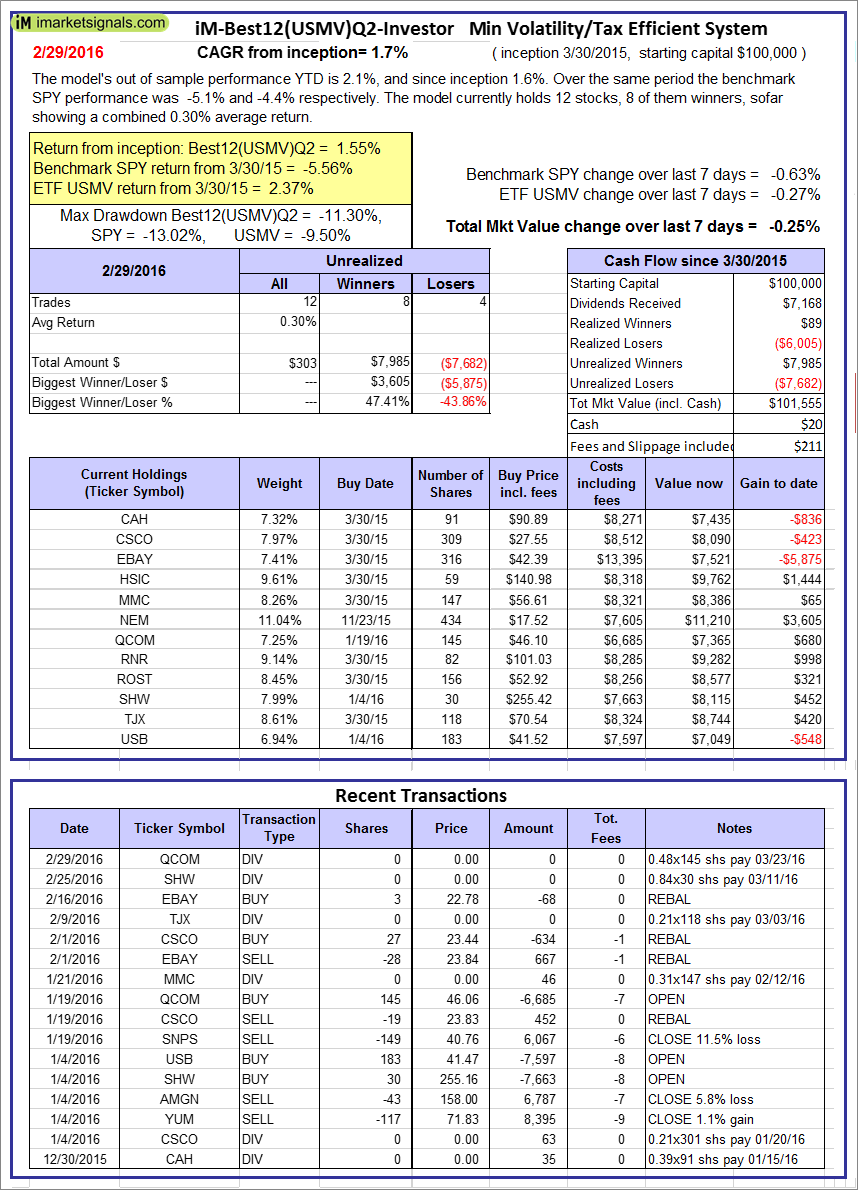 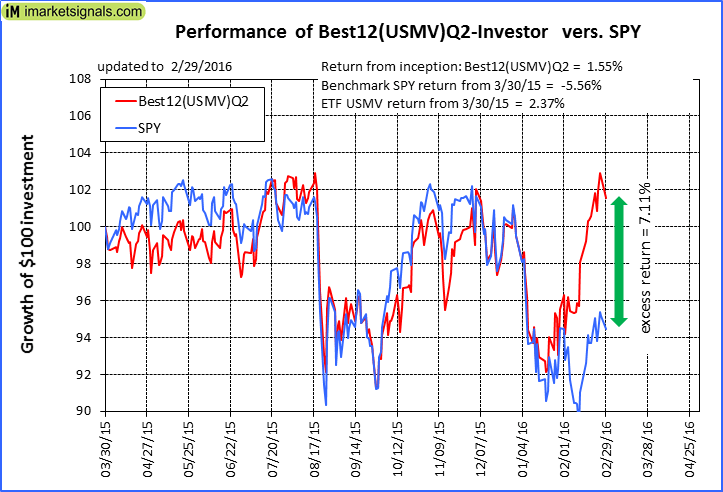 |
iM-Best12(USMV)Q2-Investor: The model’s out of sample performance YTD is 2.1%, and since inception 1.6%. Over the same period the benchmark SPY performance was -5.1% and -4.4% respectively. Since inception, on 3/31/2015, the model gained 1.55% while the benchmark SPY gained -5.56% and the ETF USMV gained 2.37% over the same period. Over the previous week the market value of iM-Best12(USMV)Q2 gained -0.25% at a time when SPY gained -0.63%. A starting capital of $100,000 at inception on 3/31/2015 would have grown to $101,555 which includes $20 cash and excludes $211 spent on fees and slippage. |
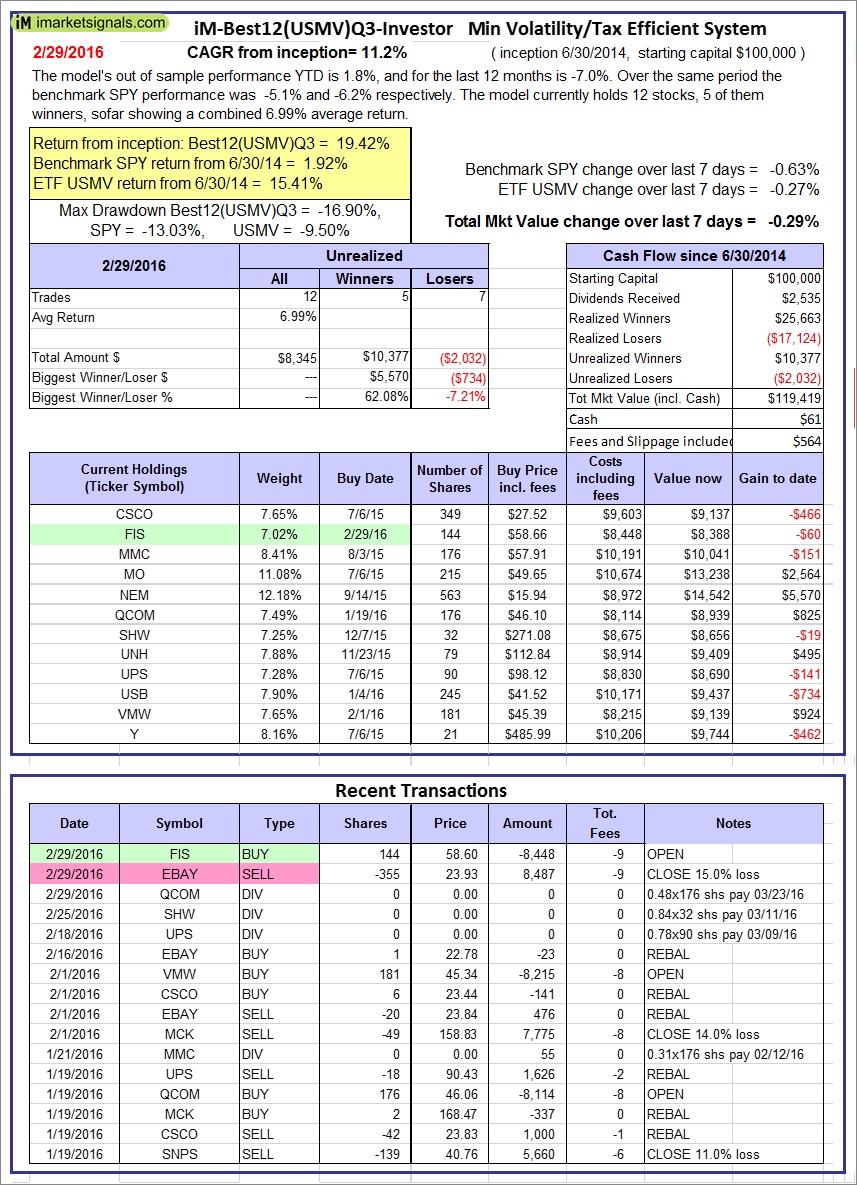  |
iM-Best12(USMV)Q3-Investor: The model’s out of sample performance YTD is 1.8%, and for the last 12 months is -7.0%. Over the same period the benchmark SPY performance was -5.1% and -6.2% respectively. Since inception, on 7/1/2014, the model gained 19.42% while the benchmark SPY gained 1.92% and the ETF USMV gained 15.41% over the same period. Over the previous week the market value of iM-Best12(USMV)Q3 gained -0.29% at a time when SPY gained -0.63%. A starting capital of $100,000 at inception on 7/1/2014 would have grown to $119,419 which includes $61 cash and excludes $564 spent on fees and slippage. |
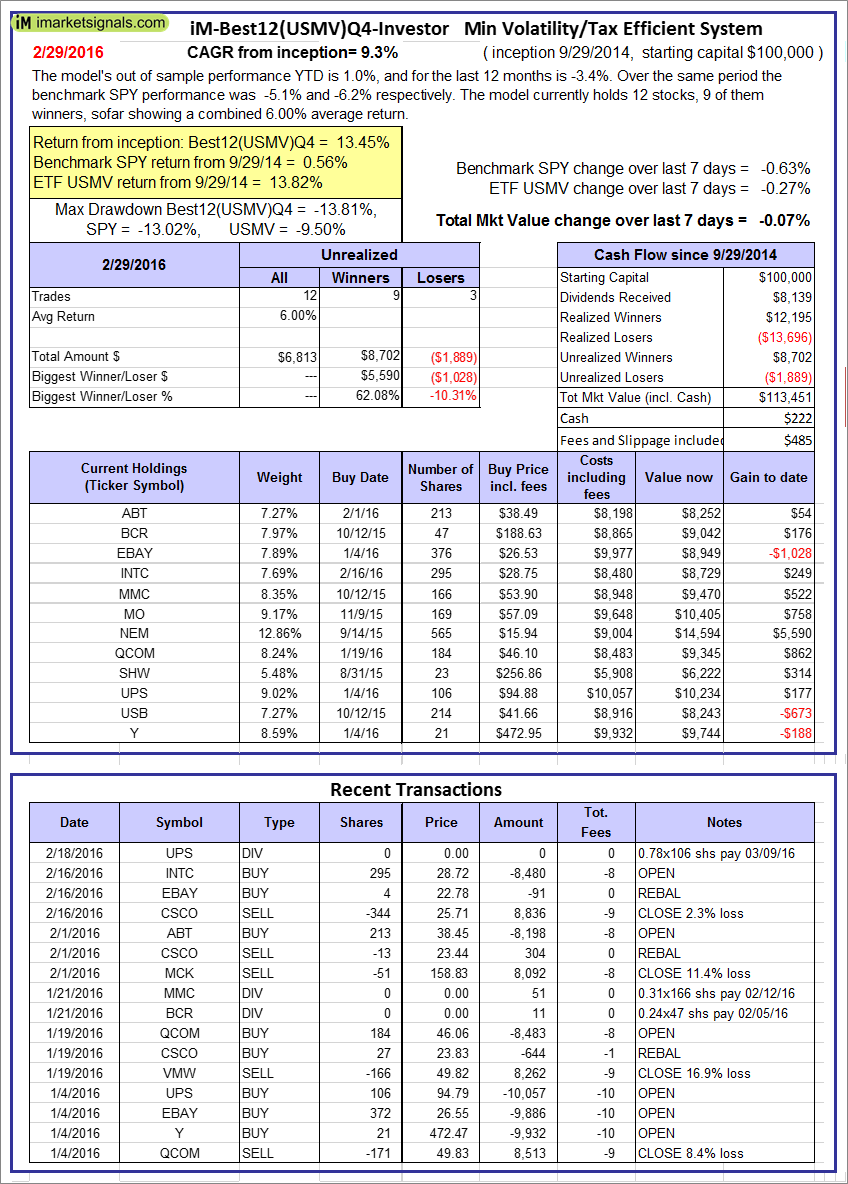 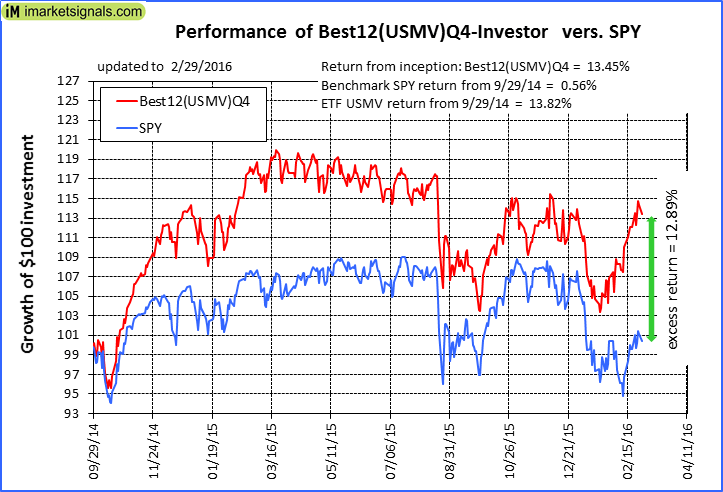 |
iM-Best12(USMV)Q4-Investor: Since inception, on 9/30/2014, the model gained 13.45% while the benchmark SPY gained 0.56% and the ETF USMV gained 13.82% over the same period. Over the previous week the market value of iM-Best12(USMV)Q4 gained -0.07% at a time when SPY gained -0.63%. A starting capital of $100,000 at inception on 9/30/2014 would have grown to $113,451 which includes $222 cash and excludes $485 spent on fees and slippage. |
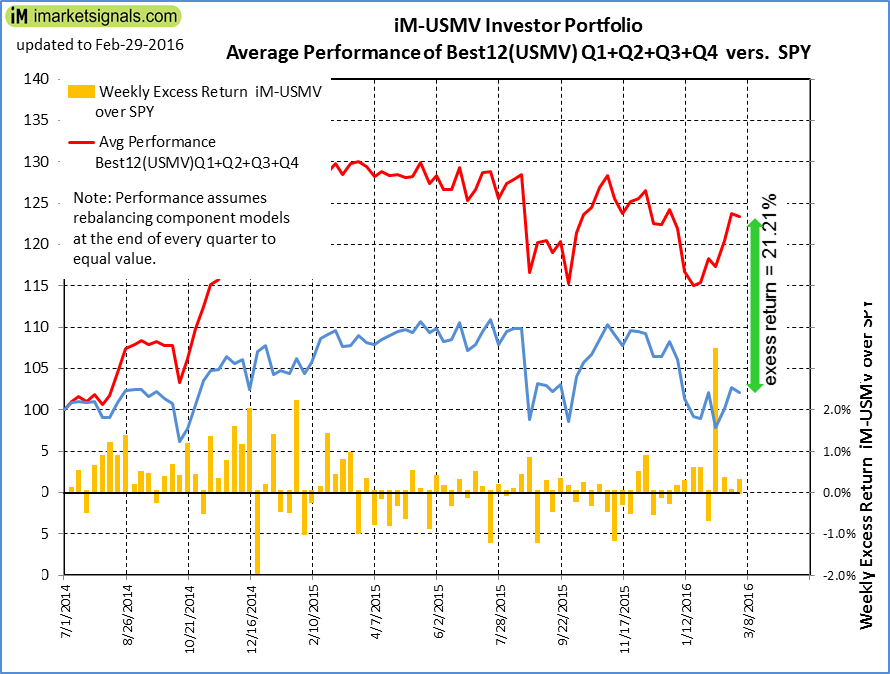 |
Average Performance of iM-Best12(USMV)Q1+Q2+Q3+Q4-Investor resulted in an excess return of 21.21% over SPY. (see iM-USMV Investor Portfolio) |
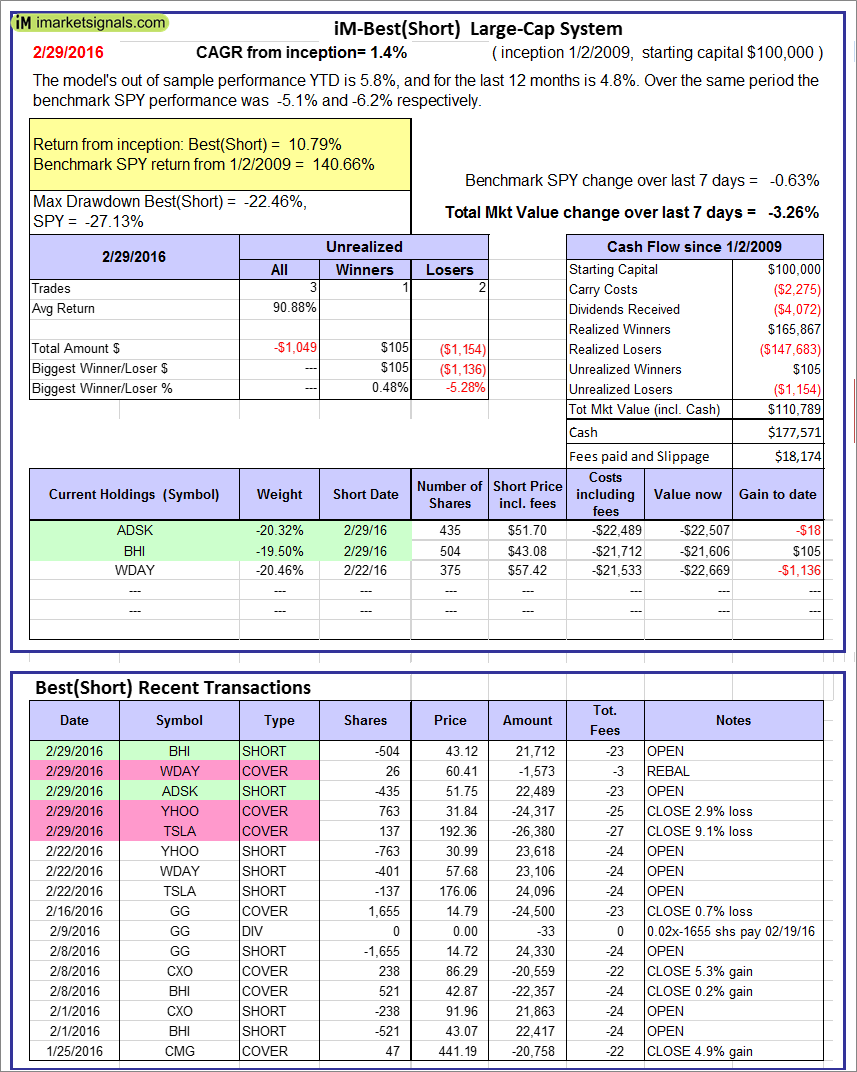 |
iM-Best(Short): The model’s out of sample performance YTD is 5.8%, and for the last 12 months is 4.8%. Over the same period the benchmark SPY performance was -5.1% and -6.2% respectively. Over the previous week the market value of iM-Best(Short) gained -3.26% at a time when SPY gained -0.63%. Over the period 1/2/2009 to 2/29/2016 the starting capital of $100,000 would have grown to $110,789 which includes $177,571 cash and excludes $18,174 spent on fees and slippage. |
iM-Best Reports – 2/29/2016
Posted in pmp SPY-SH
Leave a Reply
You must be logged in to post a comment.