|
|
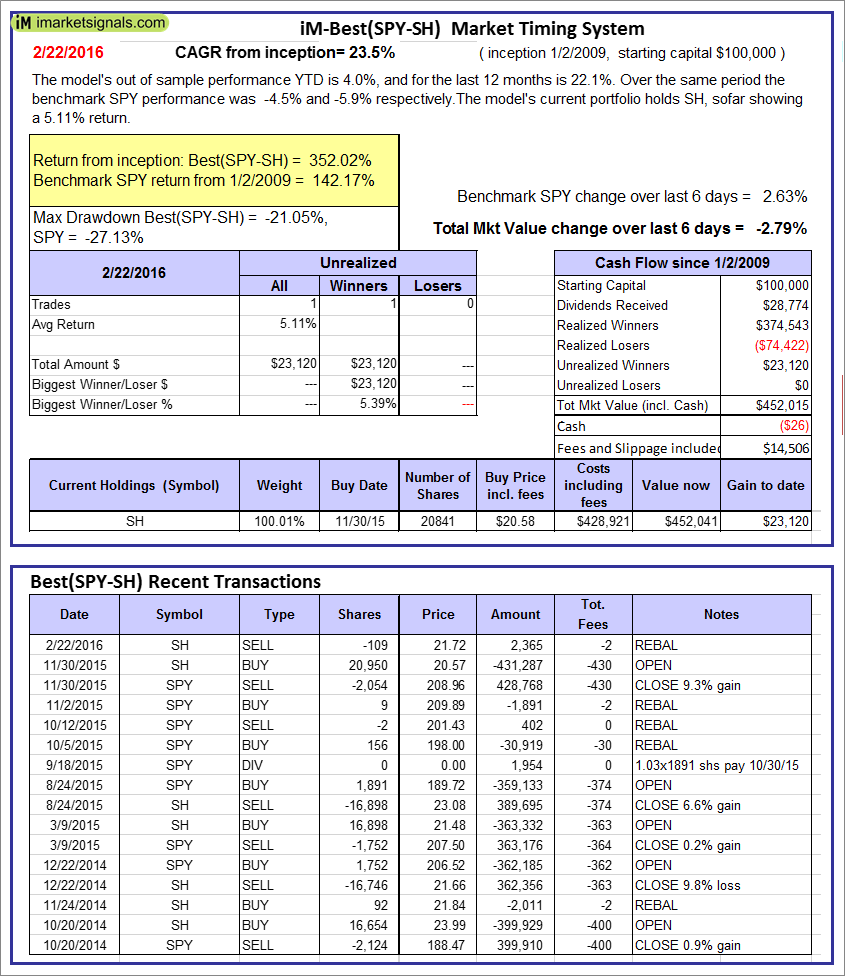
iM-Best(SPY-SH): The model’s out of sample performance YTD is 4.0%, and for the last 12 months is 22.1%. Over the same period the benchmark SPY performance was -4.5% and -5.9% respectively. Over the previous week the market value of Best(SPY-SH) gained -2.79% at a time when SPY gained 2.63%. A starting capital of $100,000 at inception on 1/2/2009 would have grown to $452,015 which includes -$26 cash and excludes $14,506 spent on fees and slippage. |
|
|
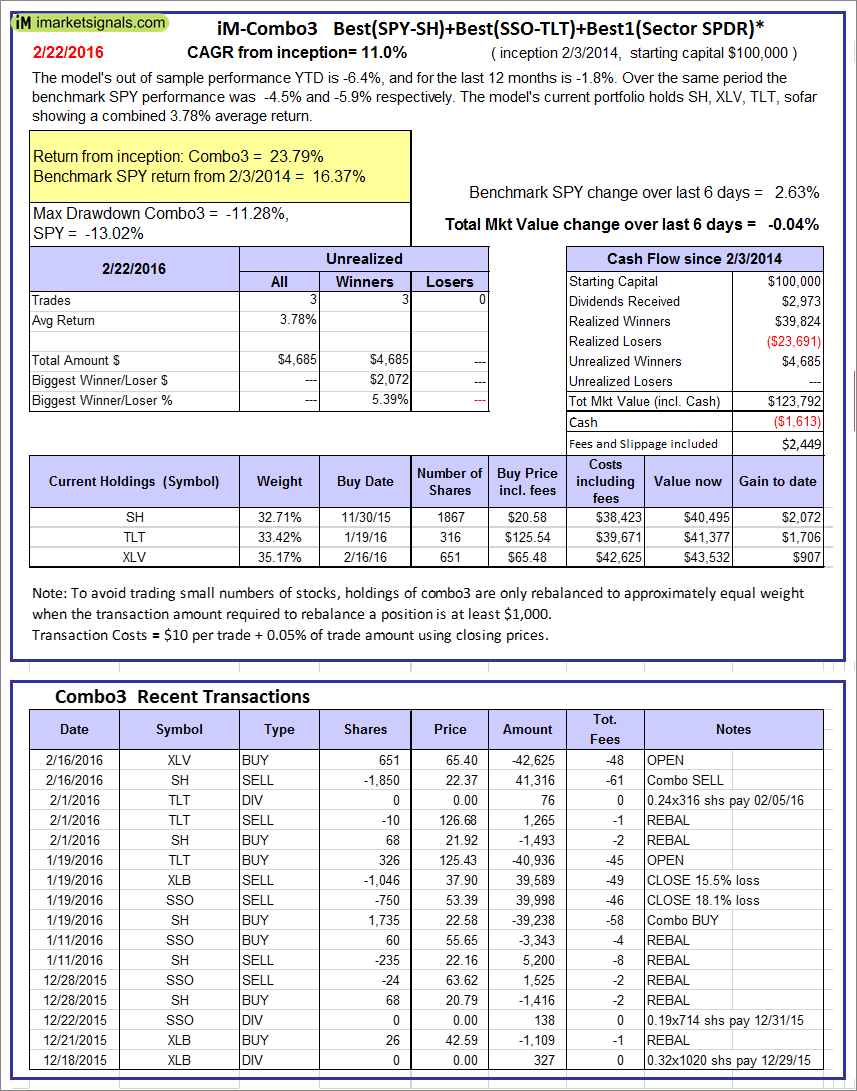
iM-Combo3: The model’s out of sample performance YTD is -6.4%, and for the last 12 months is -1.8%. Over the same period the benchmark SPY performance was -4.5% and -5.9% respectively. Over the previous week the market value of iM-Combo-3 gained -0.04% at a time when SPY gained 2.63%[/iM]. A starting capital of $100,000 at inception on 2/3/2014 would have grown to $123,792 which includes -$1,613 cash and excludes $2,449 spent on fees and slippage. |
|
|
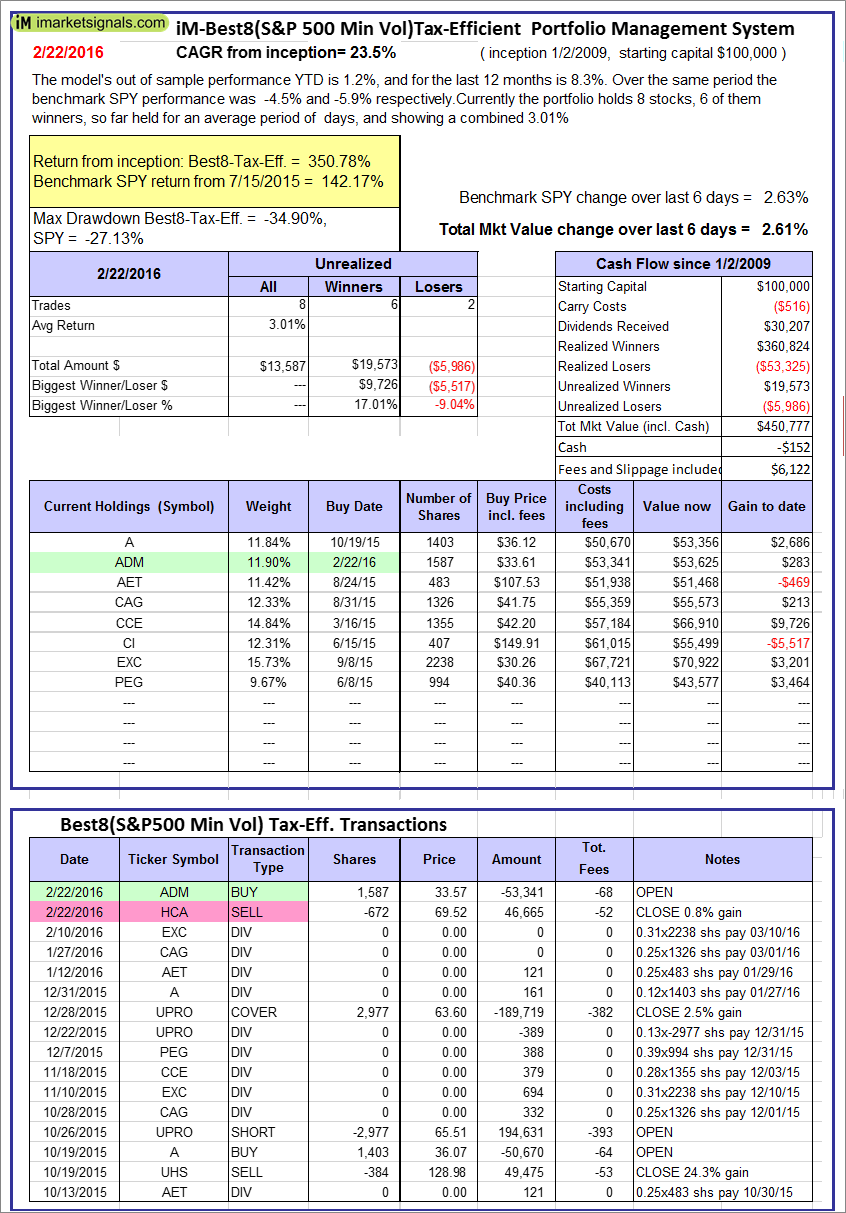
The iM-Best8(S&P500 Min Vol)Tax-Efficient The model’s out of sample performance YTD is 1.2%, and for the last 12 months is 8.3%. Over the same period the benchmark SPY performance was -4.5% and -5.9% respectively. Over the previous week the market value of iM-Best8(S&P 500)Tax-Eff. gained 2.61% at a time when SPY gained 2.63%. A starting capital of $100,000 at inception on 1/2/2009 would have grown to $450,777 which includes -$152 cash and excludes $6,122 spent on fees and slippage. |
|
|
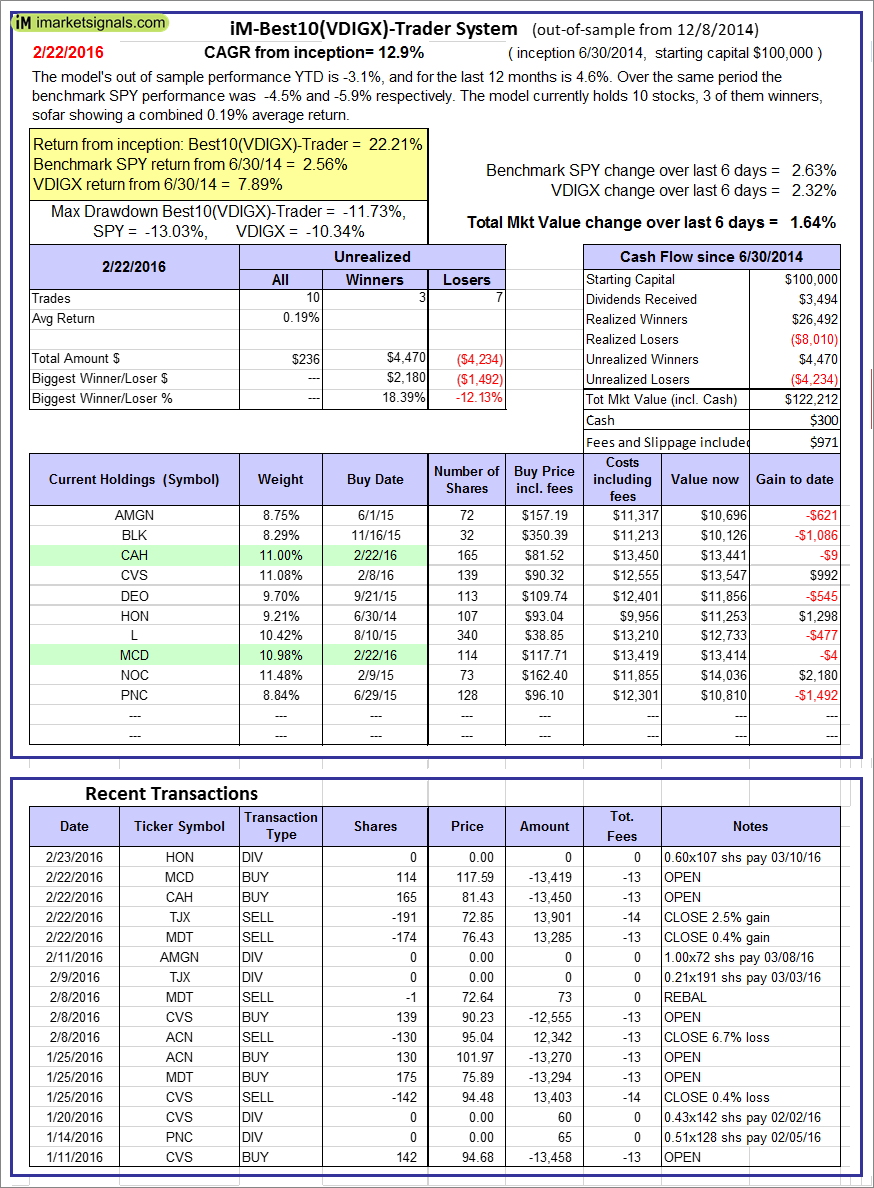
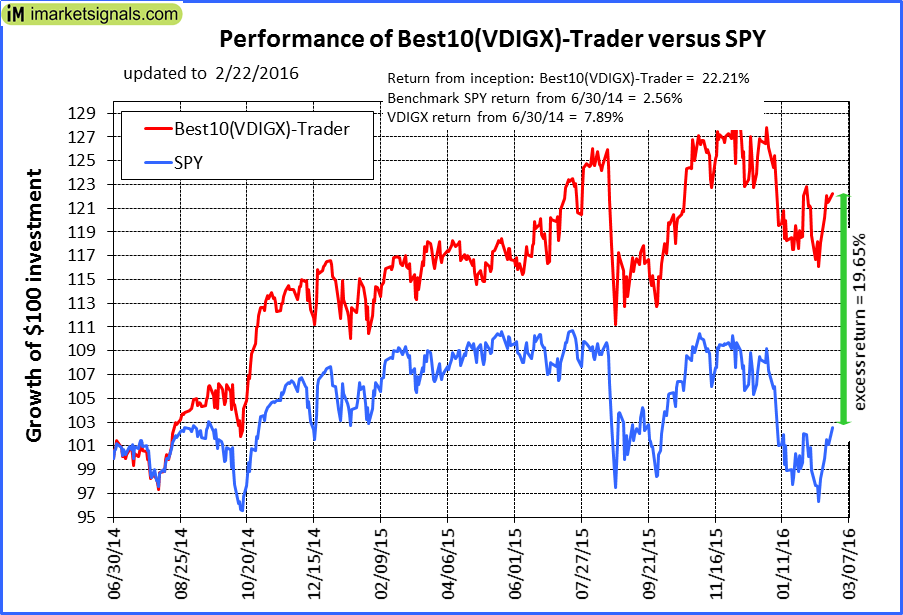
iM-Best10(VDIGX)-Trader: The model’s out of sample performance YTD is -3.1%, and for the last 12 months is 4.6%. Over the same period the benchmark SPY performance was -4.5% and -5.9% respectively. Since inception, on 7/1/2014, the model gained 22.21% while the benchmark SPY gained 2.56% and the ETF VDIGX gained 7.89% over the same period. Over the previous week the market value of iM-Best10(VDIGX) gained 1.64% at a time when SPY gained 2.63%. A starting capital of $100,000 at inception on 7/1/2014 would have grown to $122,212 which includes $300 cash and excludes $971 spent on fees and slippage. |
|
|
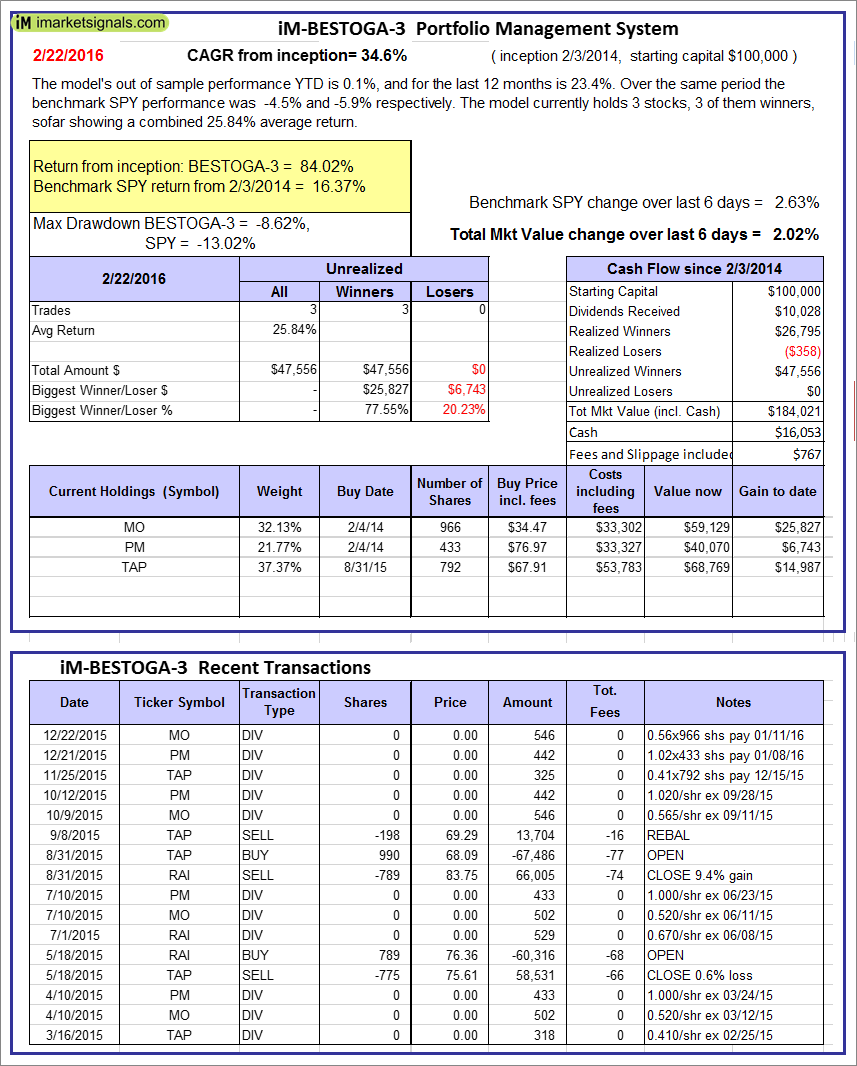
iM-BESTOGA-3: The model’s out of sample performance YTD is 0.1%, and for the last 12 months is 23.4%. Over the same period the benchmark SPY performance was -4.5% and -5.9% respectively. Over the previous week the market value of iM-BESTOGA-3 gained 2.02% at a time when SPY gained 2.63%. A starting capital of $100,000 at inception on 2/3/2014 would have grown to $184,021 which includes $16,053 cash and excludes $767 spent on fees and slippage. |
|
|
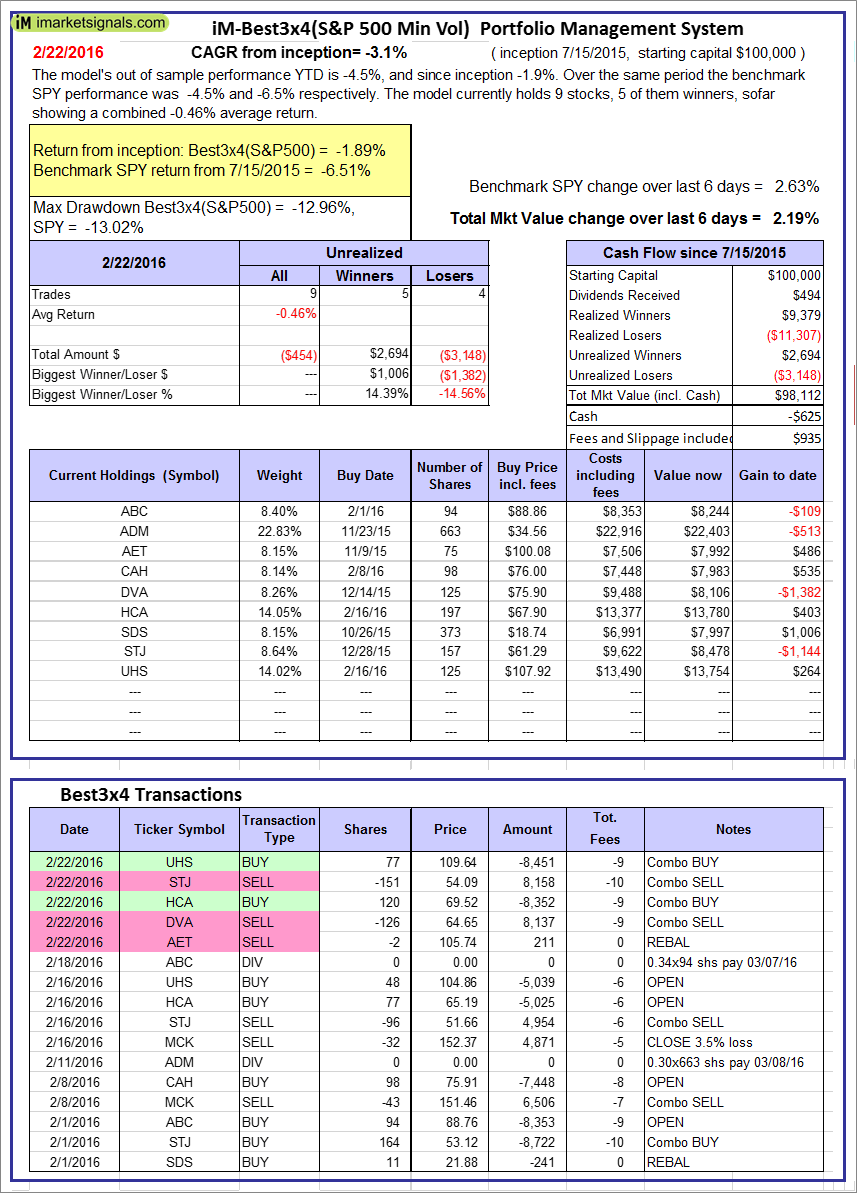
iM-Best3x4(S&P 500 Min Vol): The model’s out of sample performance YTD is -4.5%, and since inception -1.9%. Over the same period the benchmark SPY performance was -4.5% and -6.5% respectively. Over the previous week the market value of iM-Best3x4 gained 2.19% at a time when SPY gained 2.63%. A starting capital of $100,000 at inception on 7/15/2015 would have grown to $98,112 which includes -$625 cash and excludes $935 spent on fees and slippage. |
|
|
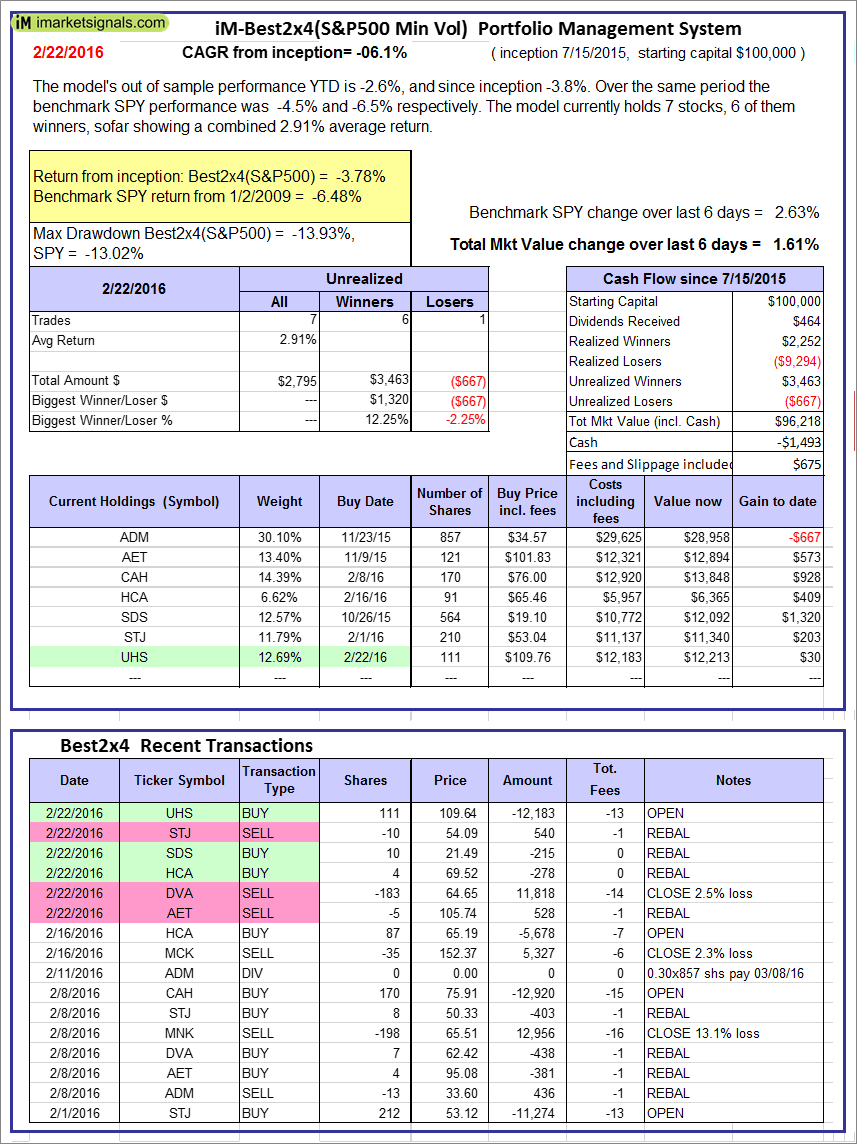
iM-Best2x4(S&P 500 Min Vol): The model’s out of sample performance YTD is -2.6%, and since inception -3.8%. Over the same period the benchmark SPY performance was -4.5% and -6.5% respectively. Over the previous week the market value of iM-Best2x4 gained 1.61% at a time when SPY gained 2.63%. A starting capital of $100,000 at inception on 7/16/2015 would have grown to $96,218 which includes -$1,493 cash and excludes $675 spent on fees and slippage. |
|
|
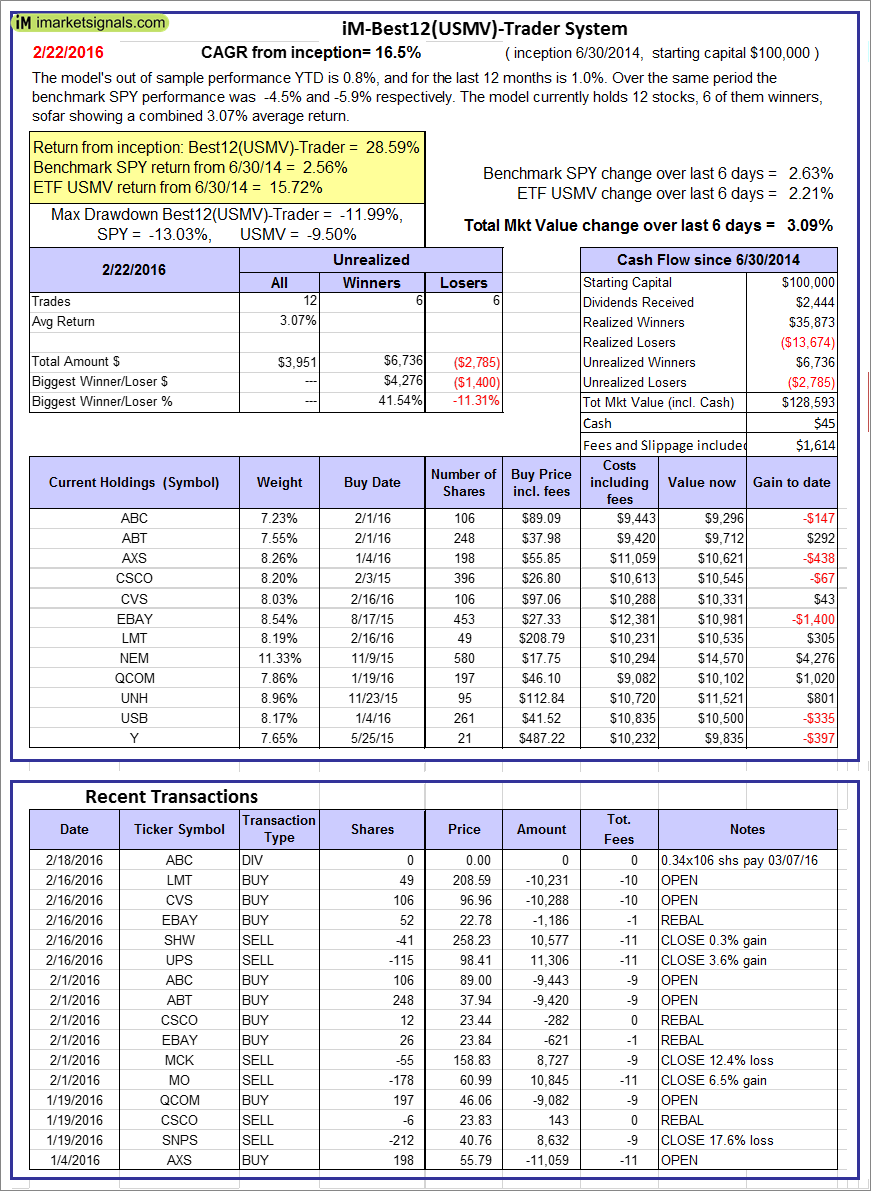
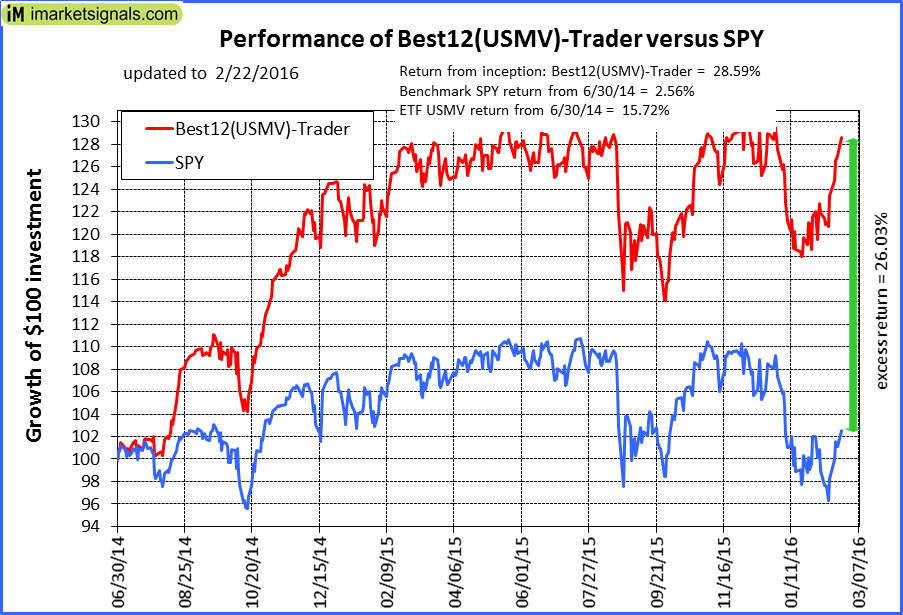
iM-Best12(USMV)-Trader: The model’s out of sample performance YTD is 0.8%, and for the last 12 months is 1.0%. Over the same period the benchmark SPY performance was -4.5% and -5.9% respectively. Since inception, on 7/1/2014, the model gained 28.59% while the benchmark SPY gained 2.56% and the ETF USMV gained 15.72% over the same period. Over the previous week the market value of iM-Best12(USMV)-Trader gained 3.09% at a time when SPY gained 2.63%. A starting capital of $100,000 at inception on 7/1/2014 would have grown to $128,593 which includes $45 cash and excludes $1,614 spent on fees and slippage. |
|
|
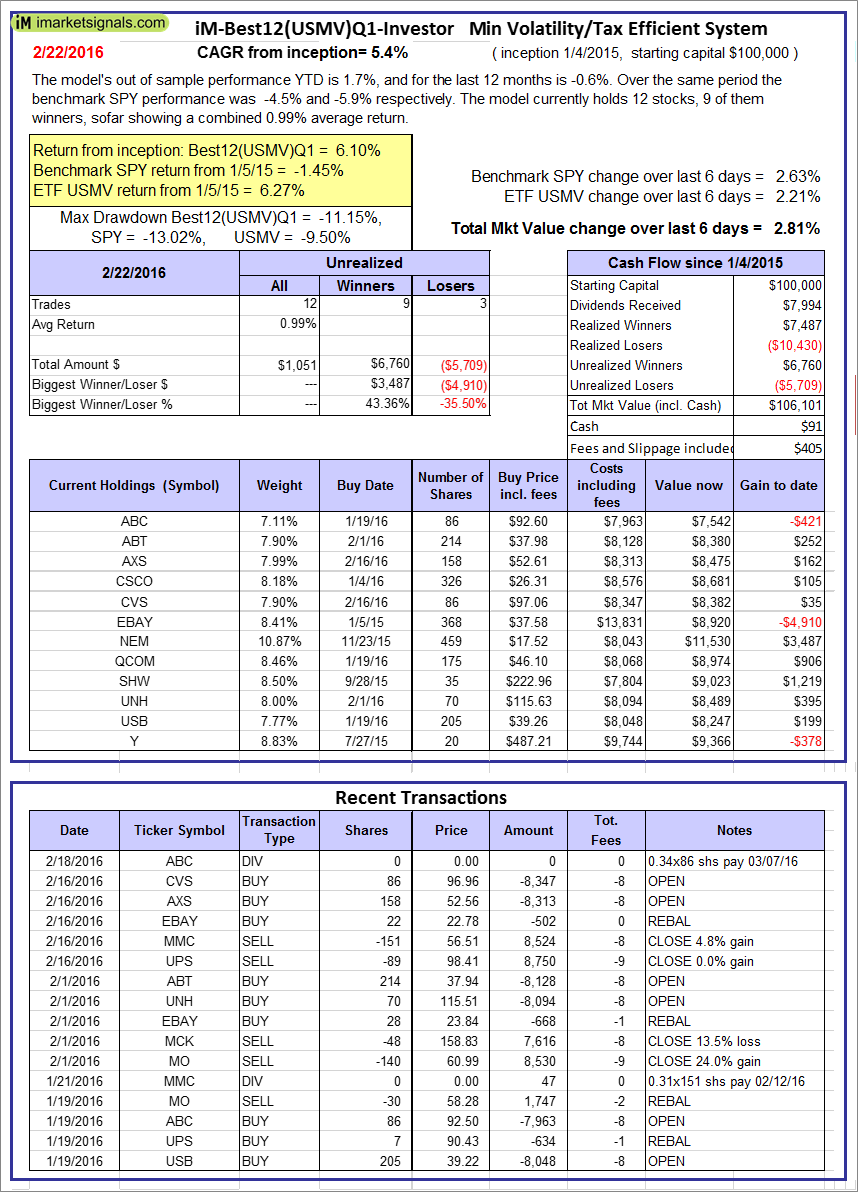
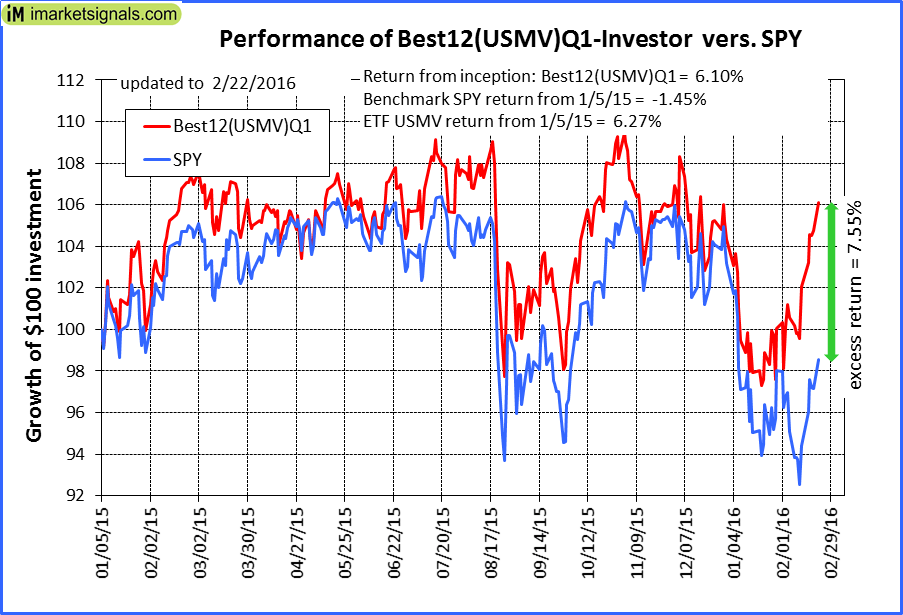
iM-Best12(USMV)Q1-Investor: The model’s out of sample performance YTD is 1.7%, and for the last 12 months is -0.6%. Over the same period the benchmark SPY performance was -4.5% and -5.9% respectively. Since inception, on 1/5/2015, the model gained 6.10% while the benchmark SPY gained -1.45% and the ETF USMV gained 6.27% over the same period. Over the previous week the market value of iM-Best12(USMV)Q1 gained 2.81% at a time when SPY gained 2.63%. A starting capital of $100,000 at inception on 1/5/2015 would have grown to $106,101 which includes $91 cash and excludes $405 spent on fees and slippage. |
|
|
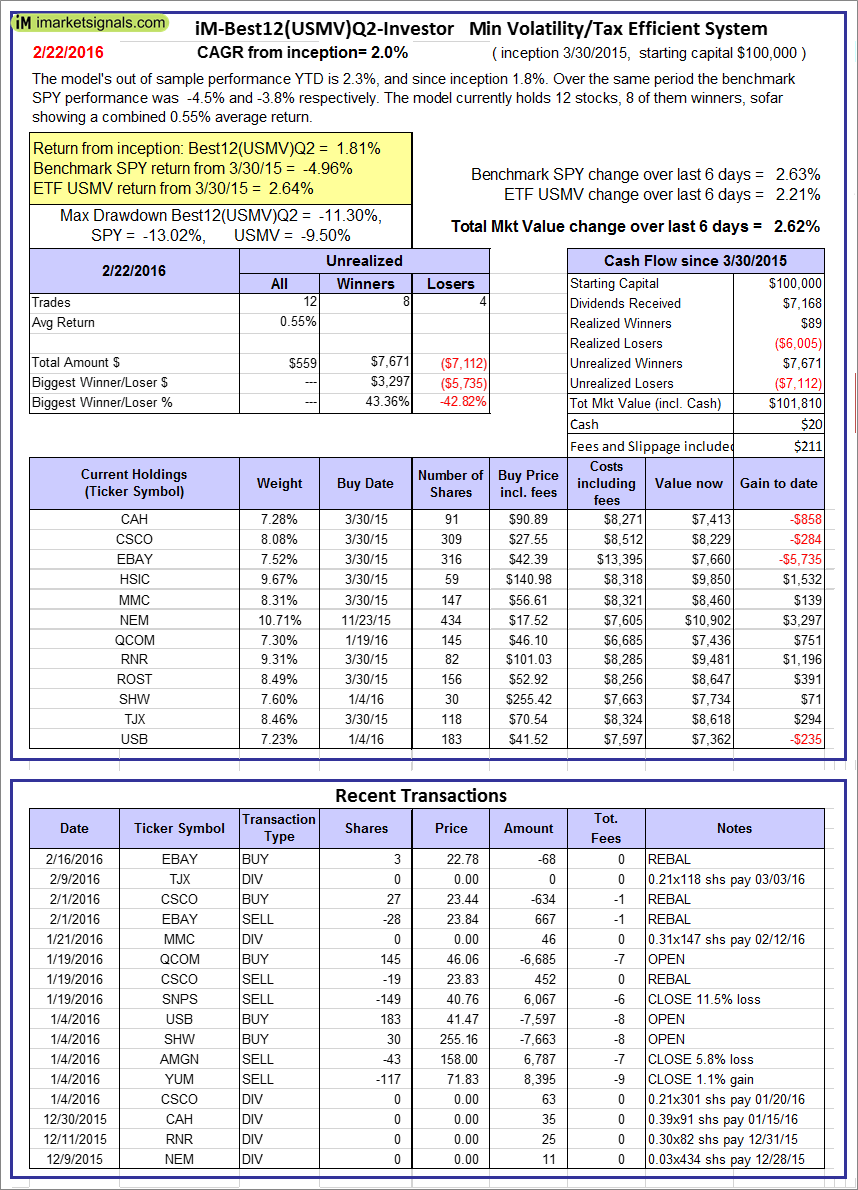
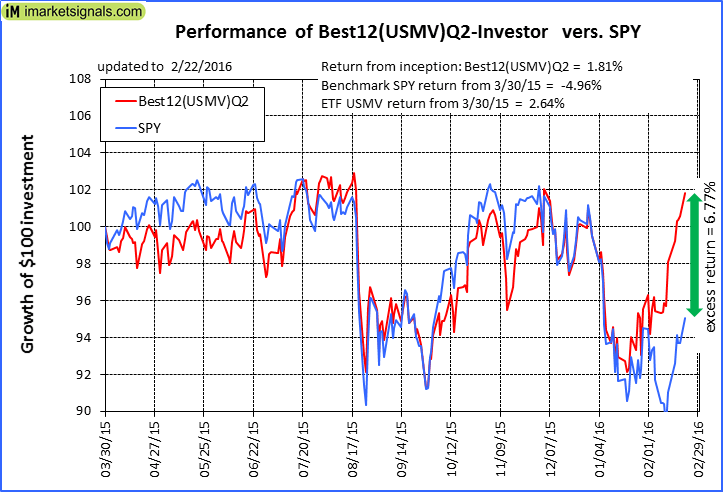
iM-Best12(USMV)Q2-Investor: The model’s out of sample performance YTD is 2.3%, and since inception 1.8%. Over the same period the benchmark SPY performance was -4.5% and -3.8% respectively. Since inception, on 3/31/2015, the model gained 1.81% while the benchmark SPY gained -4.96% and the ETF USMV gained 2.64% over the same period. Over the previous week the market value of iM-Best12(USMV)Q2 gained 2.62% at a time when SPY gained 2.63%. A starting capital of $100,000 at inception on 3/31/2015 would have grown to $101,810 which includes $20 cash and excludes $211 spent on fees and slippage. |
|
|
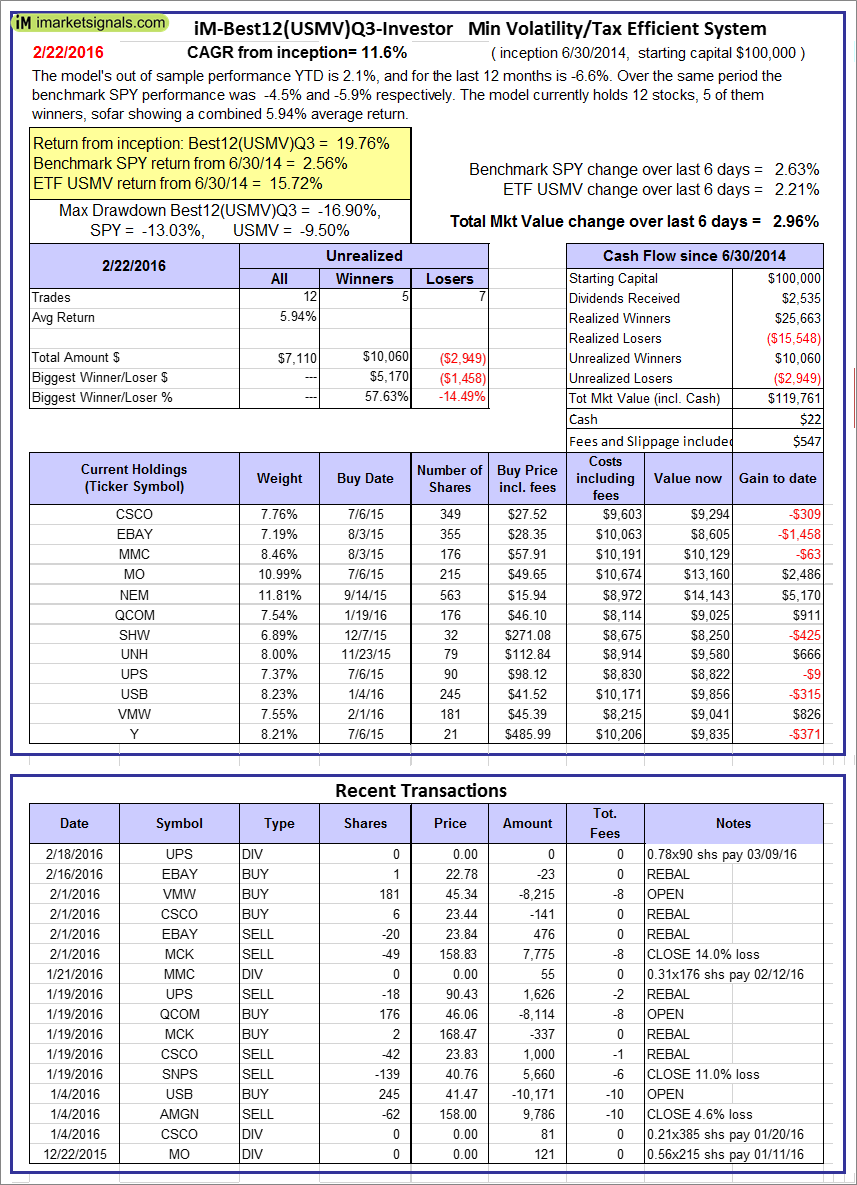
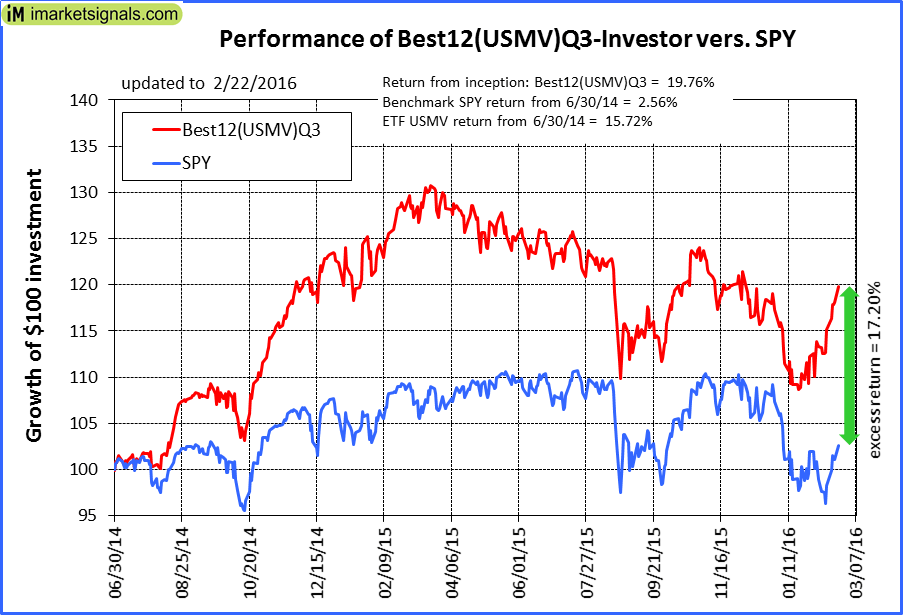
iM-Best12(USMV)Q3-Investor: The model’s out of sample performance YTD is 2.1%, and for the last 12 months is -6.6%. Over the same period the benchmark SPY performance was -4.5% and -5.9% respectively. Since inception, on 7/1/2014, the model gained 19.76% while the benchmark SPY gained 2.56% and the ETF USMV gained 15.72% over the same period. Over the previous week the market value of iM-Best12(USMV)Q3 gained 2.96% at a time when SPY gained 2.63%. A starting capital of $100,000 at inception on 7/1/2014 would have grown to $119,761 which includes $22 cash and excludes $547 spent on fees and slippage. |
|
|
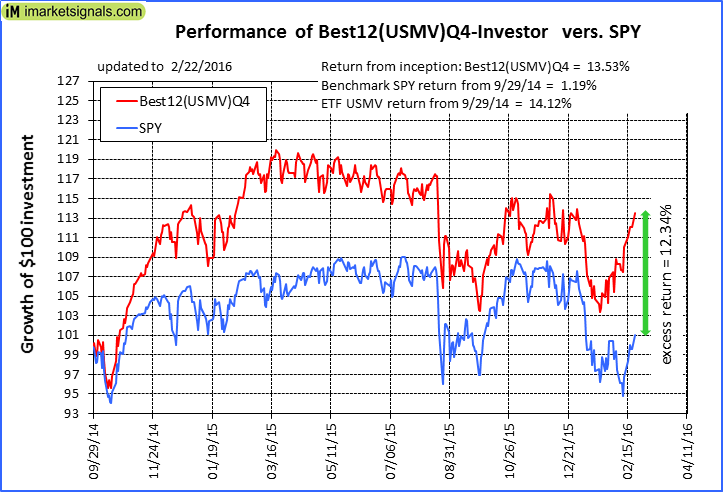
iM-Best12(USMV)Q4-Investor: Since inception, on 9/30/2014, the model gained 13.53% while the benchmark SPY gained 1.19% and the ETF USMV gained 14.12% over the same period. Over the previous week the market value of iM-Best12(USMV)Q4 gained 2.27% at a time when SPY gained 2.63%. A starting capital of $100,000 at inception on 9/30/2014 would have grown to $113,530 which includes $222 cash and excludes $485 spent on fees and slippage. |
|
|
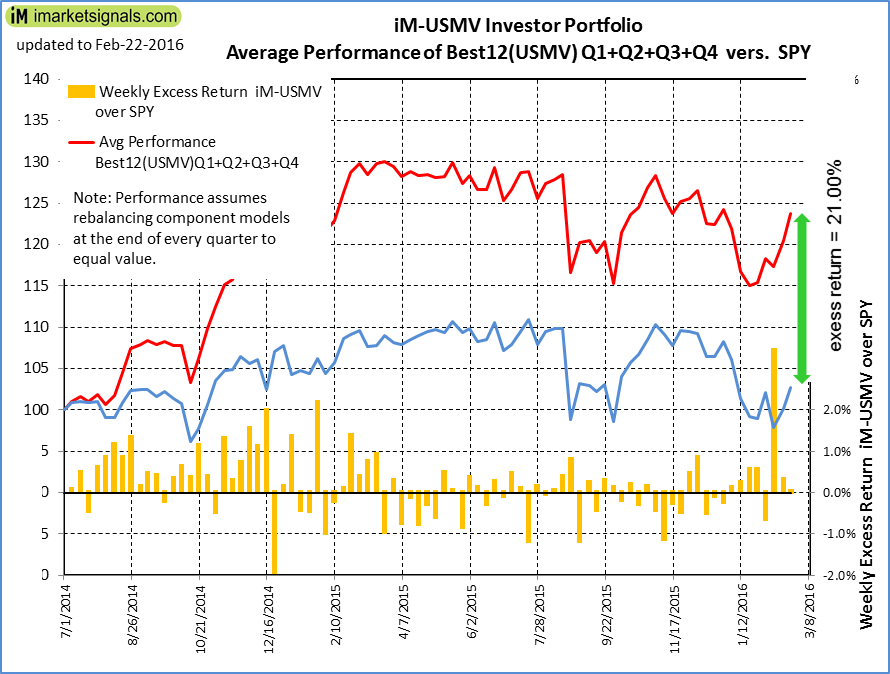
Average Performance of iM-Best12(USMV)Q1+Q2+Q3+Q4-Investor resulted in an excess return of 21.00% over SPY. (see iM-USMV Investor Portfolio) |
|
|
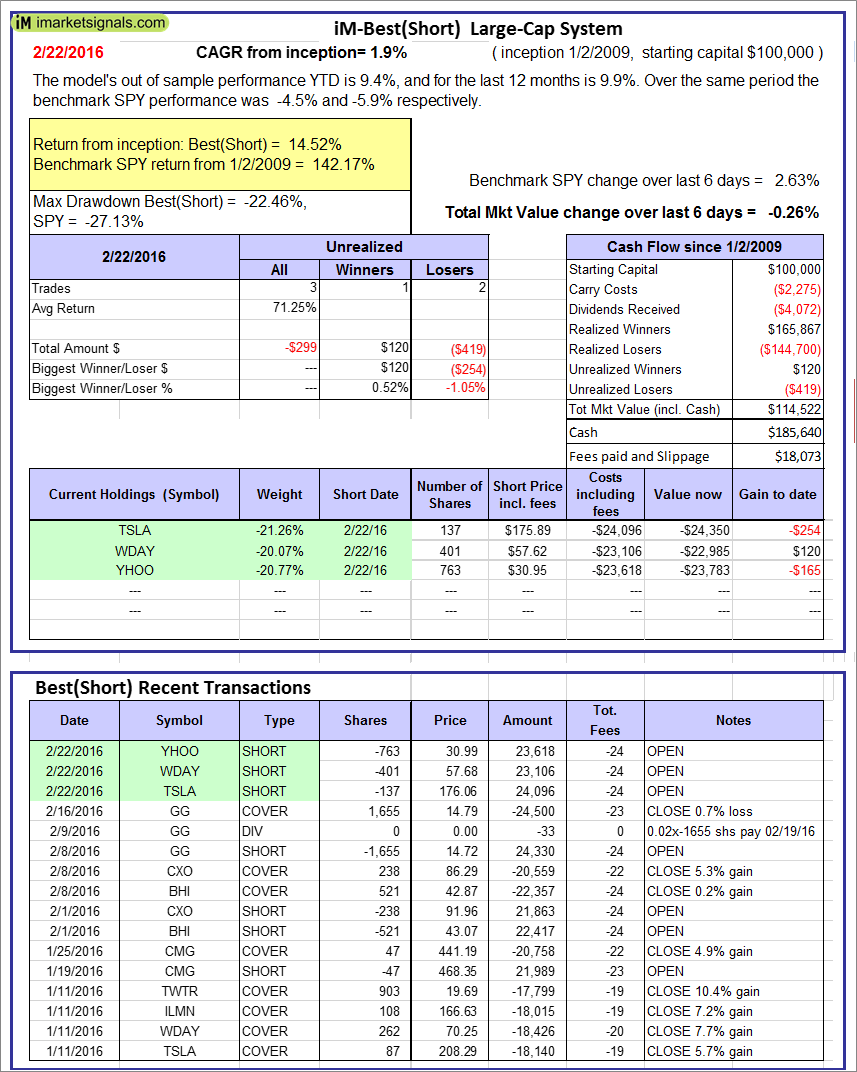
iM-Best(Short): The model’s out of sample performance YTD is 9.4%, and for the last 12 months is 9.9%. Over the same period the benchmark SPY performance was -4.5% and -5.9% respectively. Over the previous week the market value of iM-Best(Short) gained -0.26% at a time when SPY gained 2.63%. Over the period 1/2/2009 to 2/22/2016 the starting capital of $100,000 would have grown to $114,522 which includes $185,640 cash and excludes $18,073 spent on fees and slippage. |


Leave a Reply
You must be logged in to post a comment.