
  |
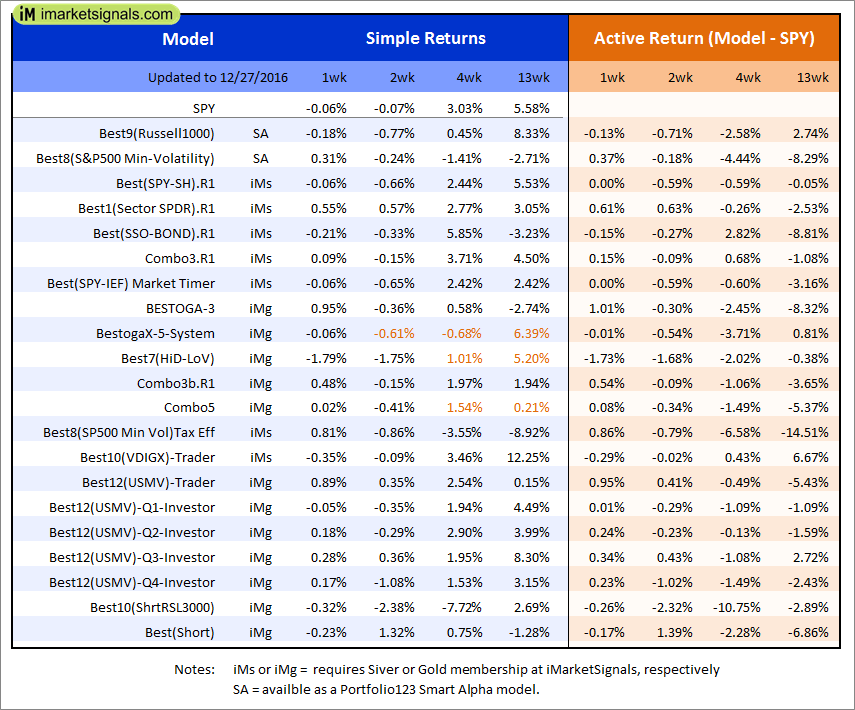
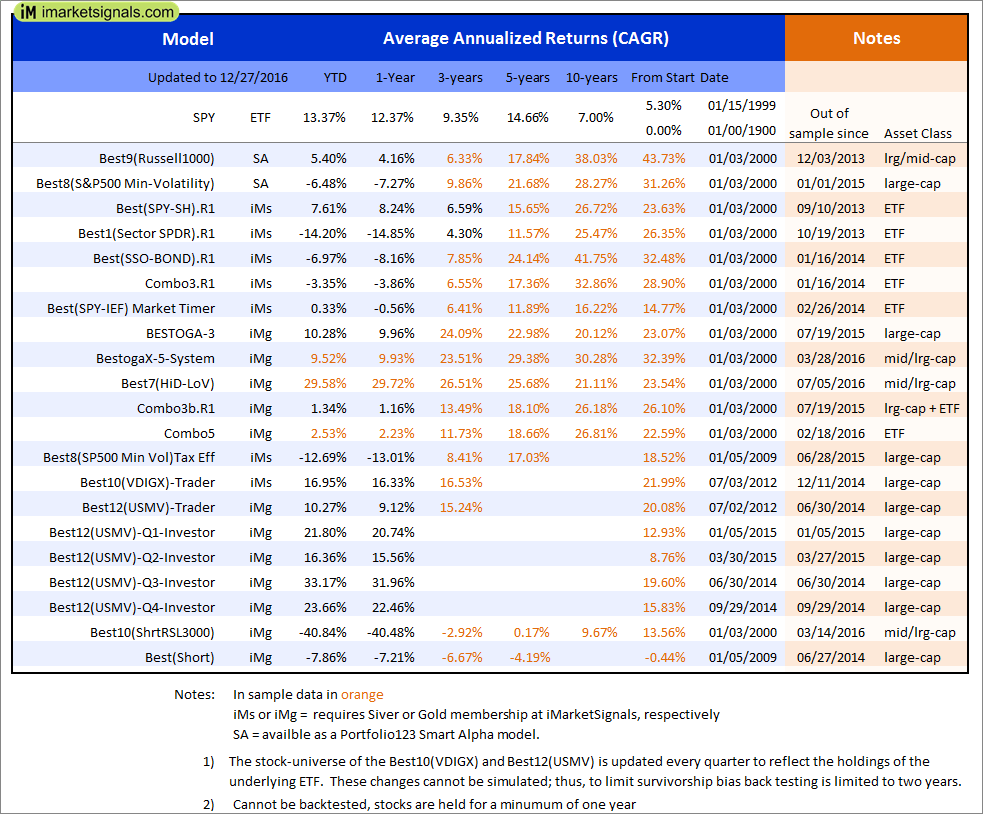
Out of sample performance summary of our models for the past 1, 2, 4 and 13 week periods. The active active return indicates how the models over- or underperformed the benchmark ETF SPY. Also the YTD, and the 1-, 3-, 5- and 10-year annualized returns are shown in the second table |
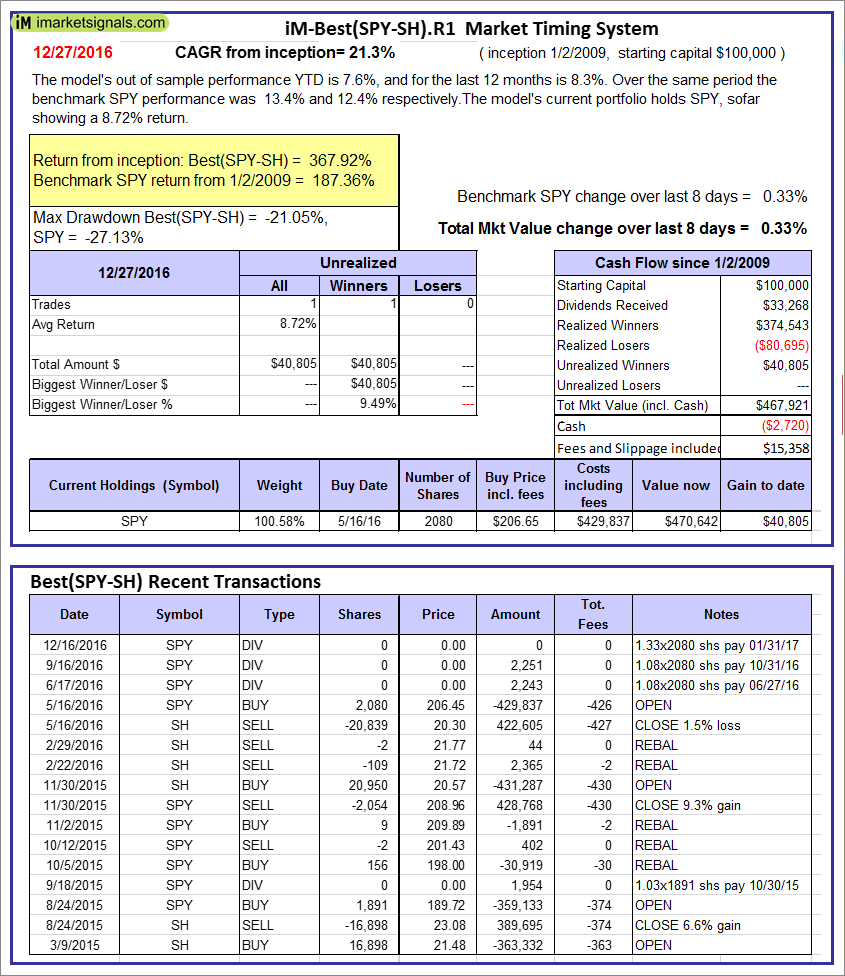 |
iM-Best(SPY-SH).R1: The model’s out of sample performance YTD is 7.6%, and for the last 12 months is 8.3%. Over the same period the benchmark SPY performance was 13.4% and 12.4% respectively. Over the previous week the market value of Best(SPY-SH) gained 0.33% at a time when SPY gained 0.33%. A starting capital of $100,000 at inception on 1/2/2009 would have grown to $467,921 which includes -$2,720 cash and excludes $15,358 spent on fees and slippage. |
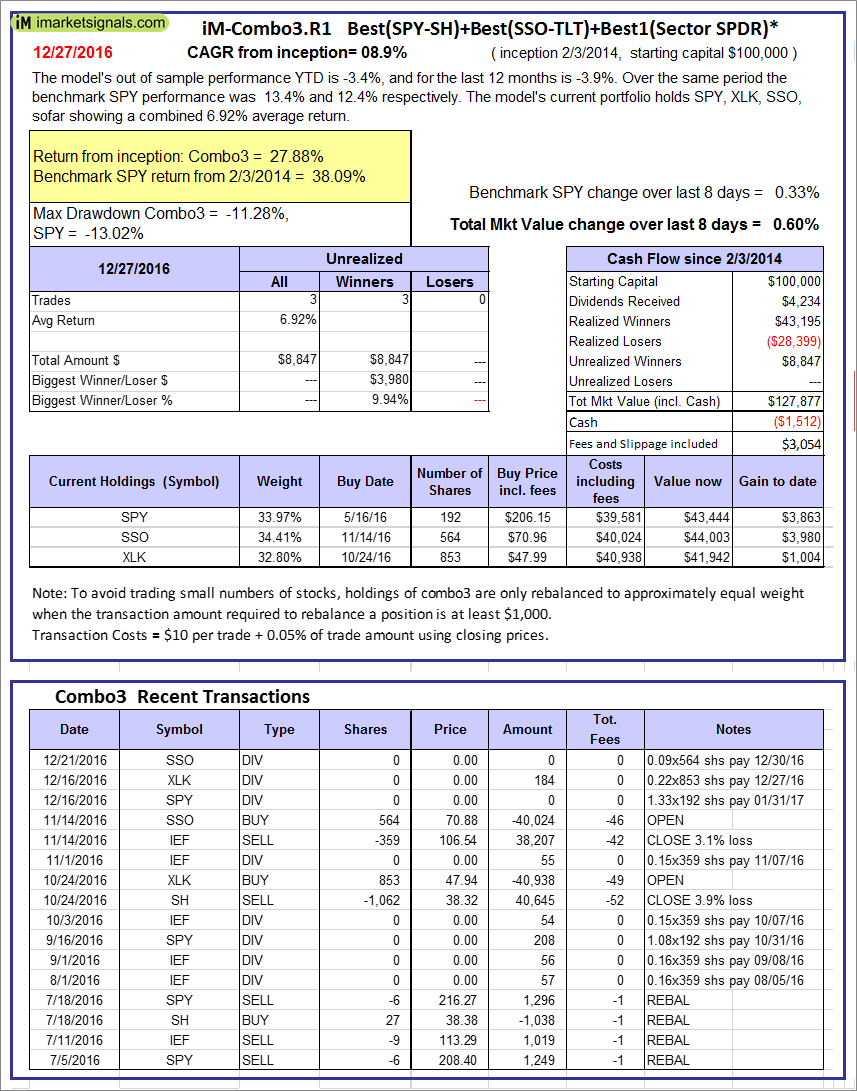 |
iM-Combo3.R1: The model’s out of sample performance YTD is -3.4%, and for the last 12 months is -3.9%. Over the same period the benchmark SPY performance was 13.4% and 12.4% respectively. Over the previous week the market value of iM-Combo3.R1 gained 0.60% at a time when SPY gained 0.33%. A starting capital of $100,000 at inception on 2/3/2014 would have grown to $127,877 which includes -$1,512 cash and excludes $3,054 spent on fees and slippage. |
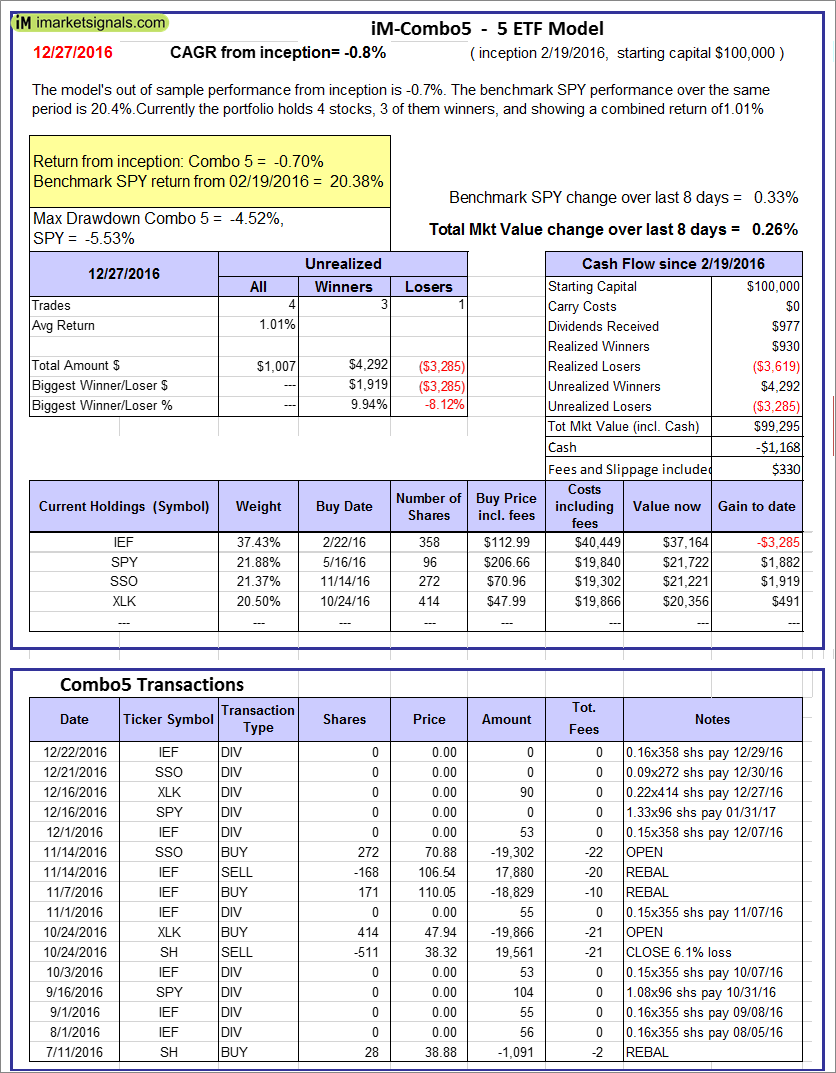 |
iM-Combo5: The model’s out of sample performance from inception is -0.7%. The benchmark SPY performance over the same period is 20.4%. Over the previous week the market value of iM-Combo5 gained 0.26% at a time when SPY gained 0.33%. A starting capital of $100,000 at inception on 2/22/2016 would have grown to $99,295 which includes -$1,168 cash and excludes $330 spent on fees and slippage. |
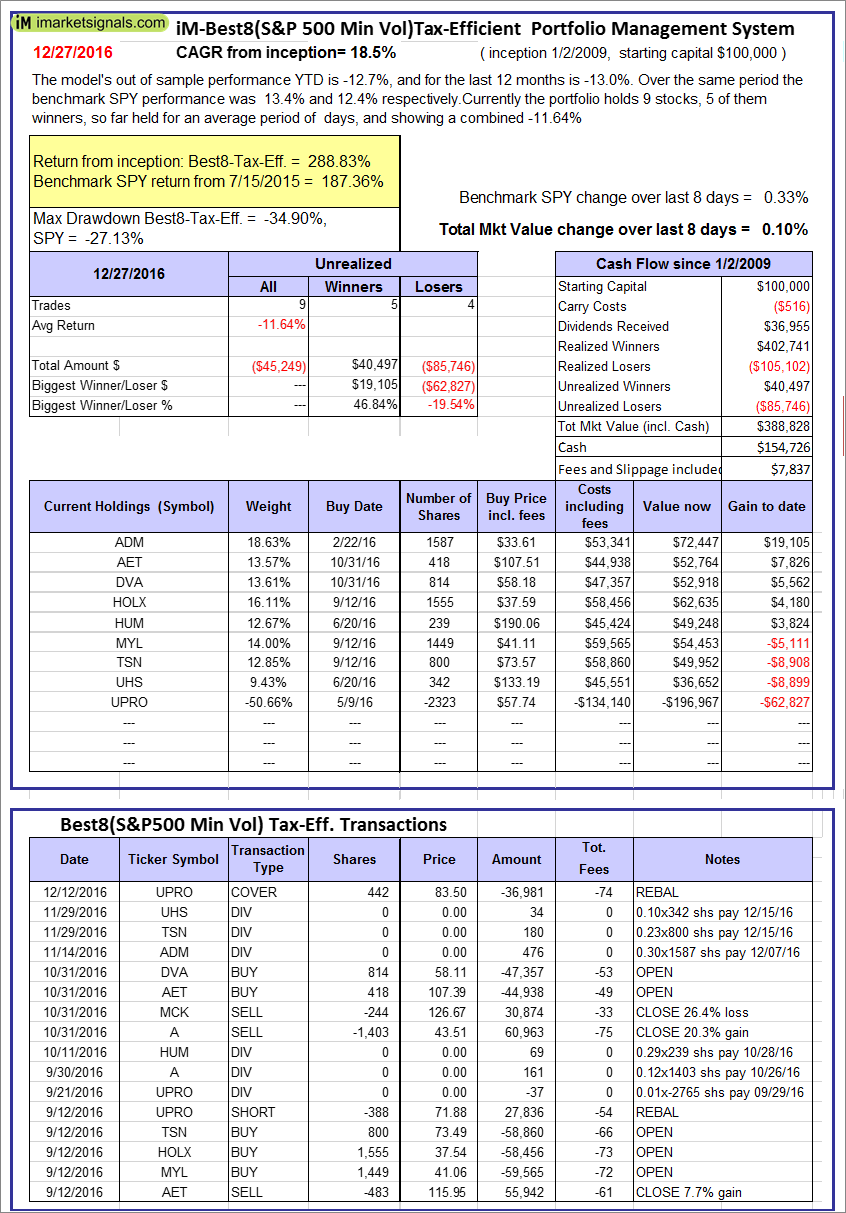 |
The iM-Best8(S&P500 Min Vol)Tax-Efficient The model’s out of sample performance YTD is -12.7%, and for the last 12 months is -13.0%. Over the same period the benchmark SPY performance was 13.4% and 12.4% respectively. Over the previous week the market value of iM-Best8(S&P 500)Tax-Eff. gained 0.10% at a time when SPY gained 0.33%. A starting capital of $100,000 at inception on 1/2/2009 would have grown to $388,828 which includes $154,726 cash and excludes $7,837 spent on fees and slippage. |
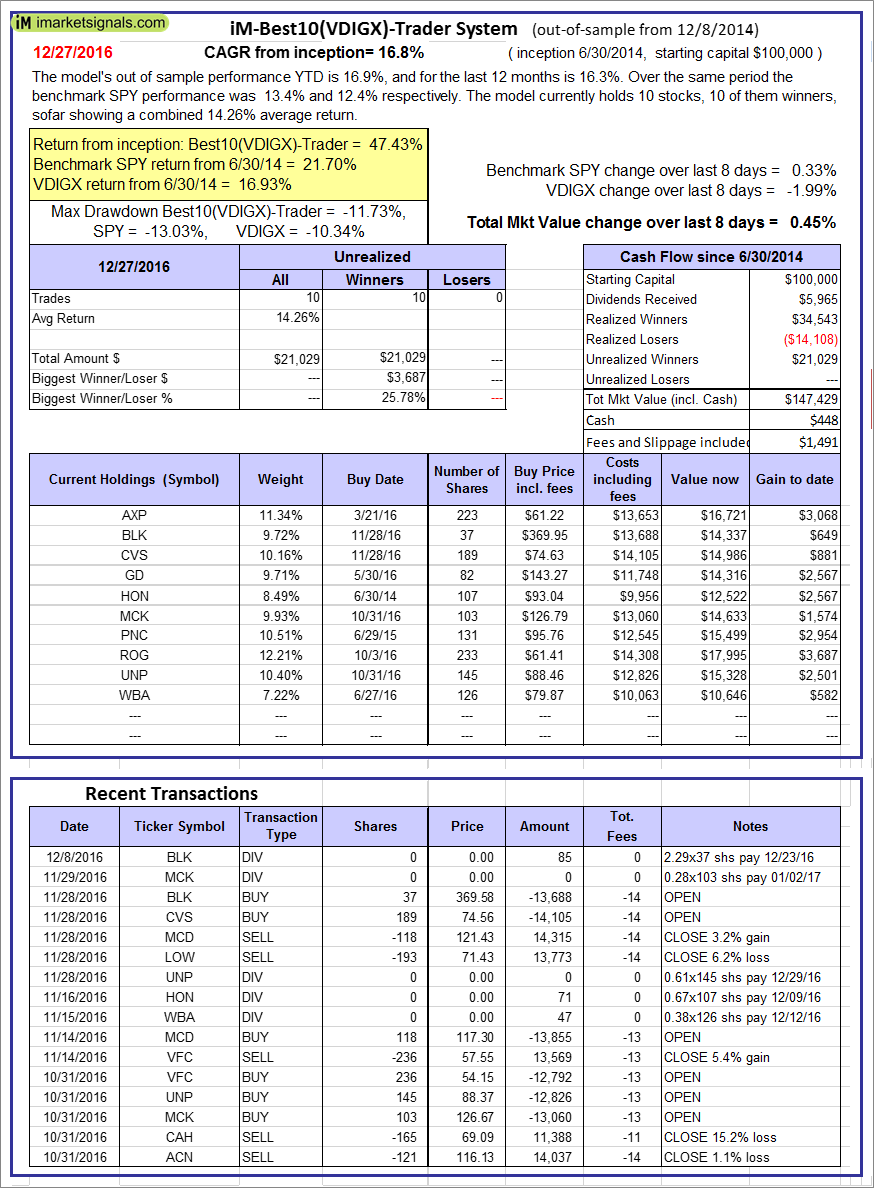  |
iM-Best10(VDIGX)-Trader: The model’s out of sample performance YTD is 16.9%, and for the last 12 months is 16.3%. Over the same period the benchmark SPY performance was 13.4% and 12.4% respectively. Since inception, on 7/1/2014, the model gained 47.43% while the benchmark SPY gained 21.70% and the ETF VDIGX gained 16.93% over the same period. Over the previous week the market value of iM-Best10(VDIGX) gained 0.45% at a time when SPY gained 0.33%. A starting capital of $100,000 at inception on 7/1/2014 would have grown to $147,429 which includes $448 cash and excludes $1,491 spent on fees and slippage. |
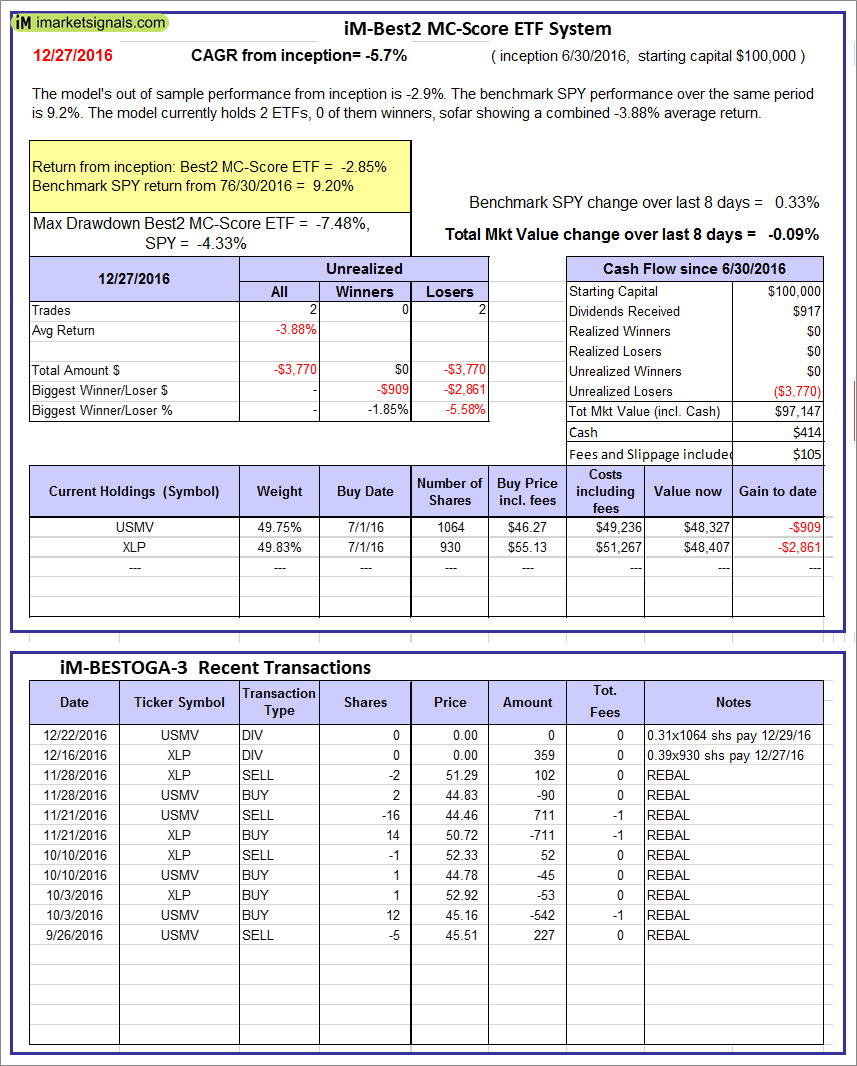 |
iM-Best2 MC-Score ETF System: The model’s out of sample performance from inception is -2.9%. The benchmark SPY performance over the same period is 9.2%. Over the previous week the market value of iM-BESTOGA-3 gained -0.09% at a time when SPY gained 0.33%. A starting capital of $100,000 at inception on 2/3/2014 would have grown to $414 which includes $105 cash and excludes Gain to date spent on fees and slippage. |
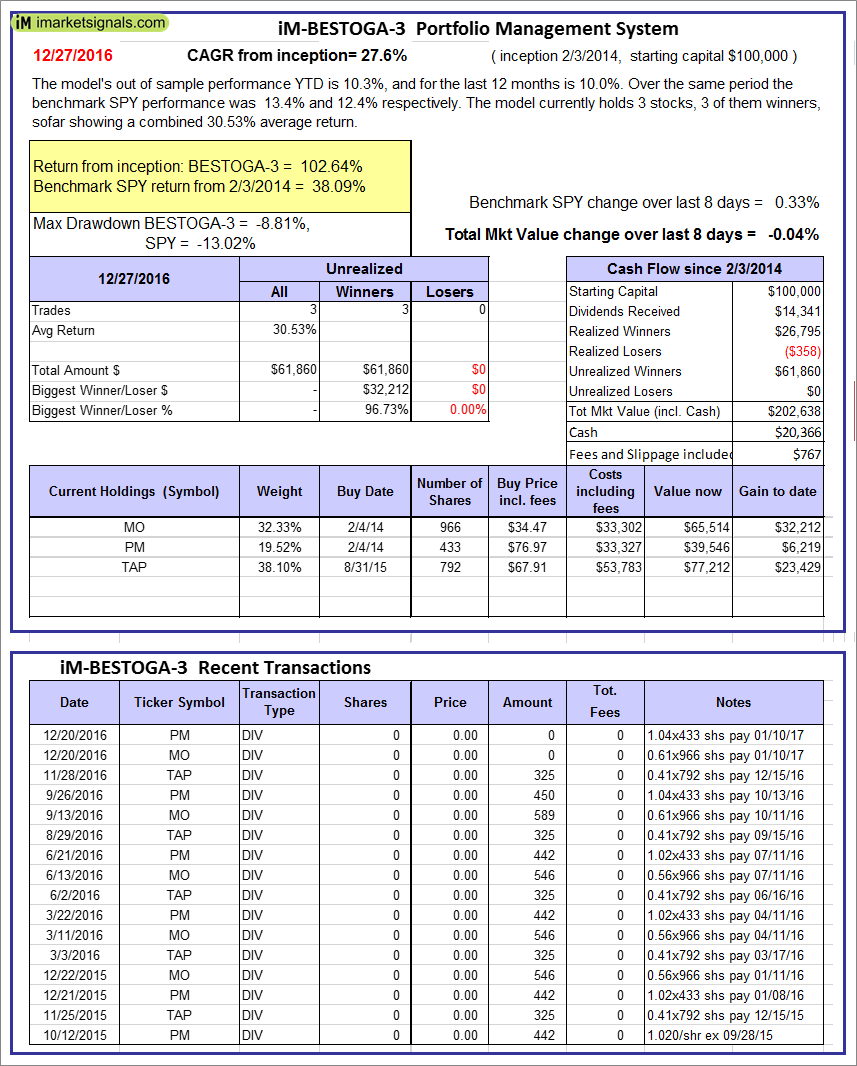 |
iM-BESTOGA-3: The model’s out of sample performance YTD is 10.3%, and for the last 12 months is 10.0%. Over the same period the benchmark SPY performance was 13.4% and 12.4% respectively. Over the previous week the market value of iM-BESTOGA-3 gained -0.04% at a time when SPY gained 0.33%. A starting capital of $100,000 at inception on 2/3/2014 would have grown to $202,638 which includes $20,366 cash and excludes $767 spent on fees and slippage. |
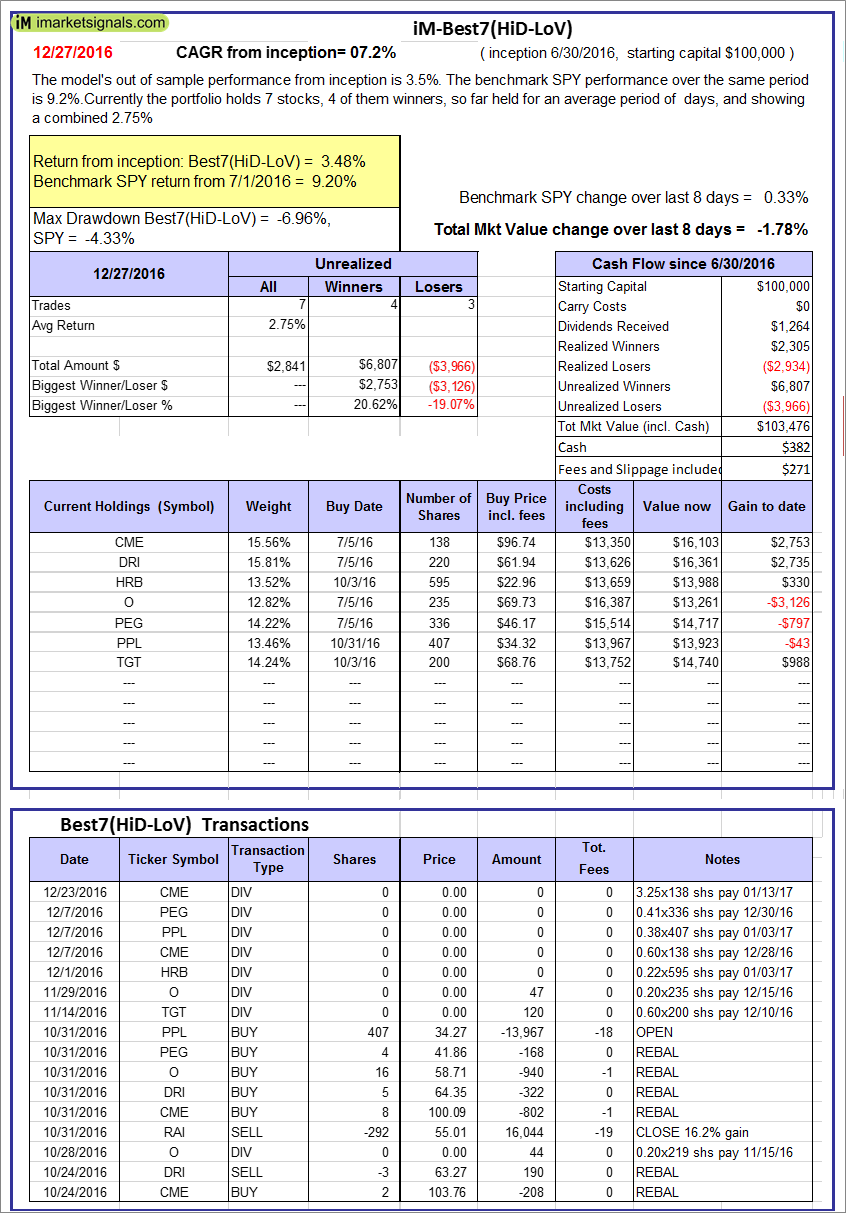 |
iM-Best7(HiD-LoV): The model’s out of sample performance from inception is 3.5%. The benchmark SPY performance over the same period is 9.2%. Over the previous week the market value of iM-BESTOGA-3 gained -1.78% at a time when SPY gained 0.33%. A starting capital of $100,000 at inception on 2/3/2014 would have grown to $103,476 which includes $382 cash and excludes $271 spent on fees and slippage. |
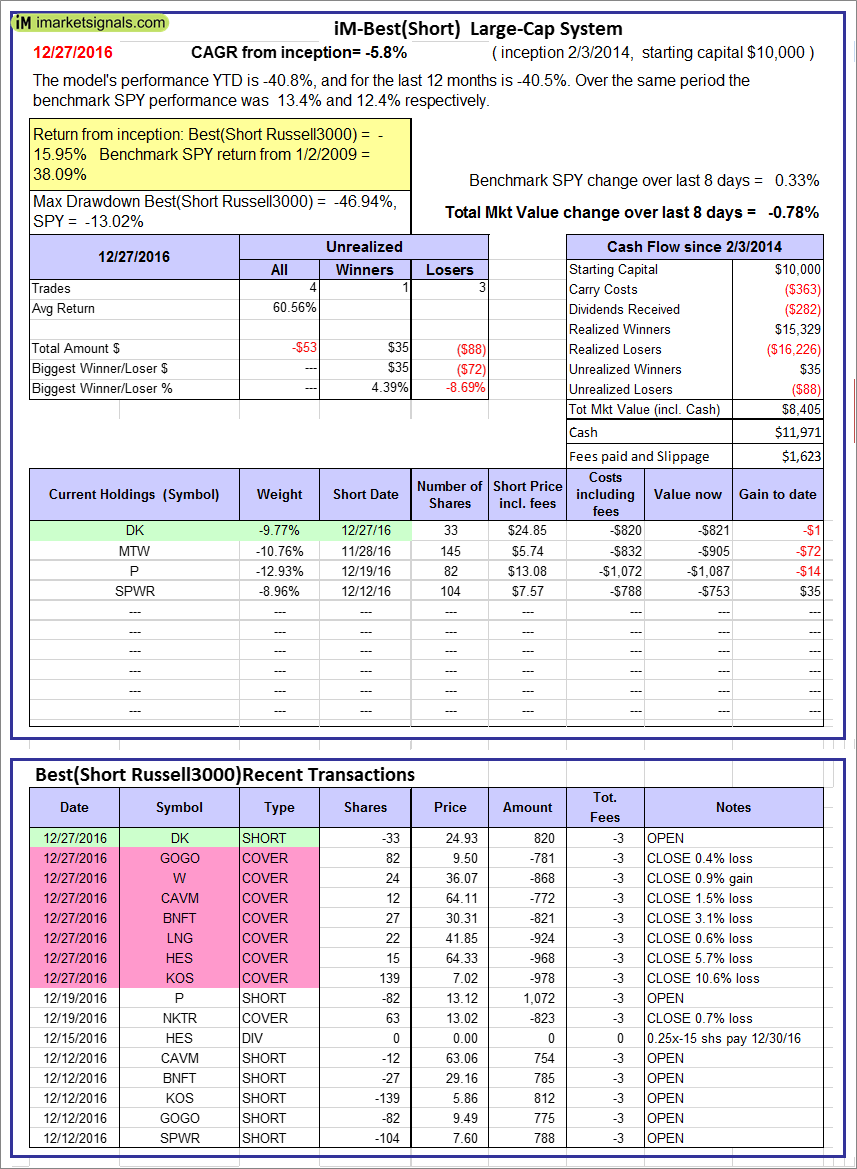 |
iM-Best10(Short Russell3000): The model’s performance YTD is -40.8%, and for the last 12 months is -40.5%. Over the same period the benchmark SPY performance was 13.4% and 12.4% respectively. Over the previous week the market value of iM-Best10(Short Russell3000) gained -0.78% at a time when SPY gained 0.33%. Over the period 2/3/2014 to 12/27/2016 the starting capital of $100,000 would have grown to $8,405 which includes $11,971 cash and excludes $1,623 spent on fees and slippage. |
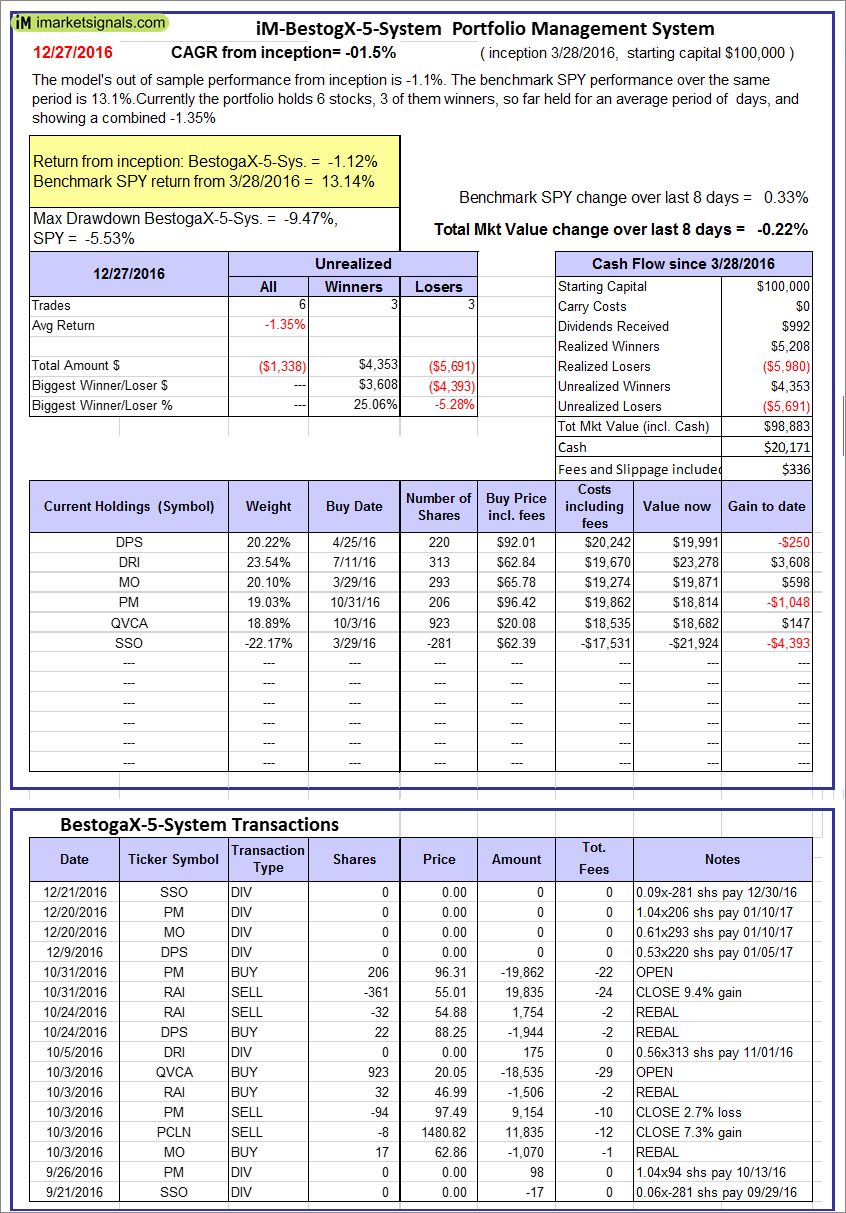 |
iM-BestogaX5-System: The model’s out of sample performance from inception is -1.1%. The benchmark SPY performance over the same period is 13.1%. Over the previous week the market value of iM-Best8(S&P 500)Tax-Eff. gained -0.22% at a time when SPY gained 0.33%. A starting capital of $100,000 at inception on 1/2/2009 would have grown to $98,883 which includes $20,171 cash and excludes $336 spent on fees and slippage. |
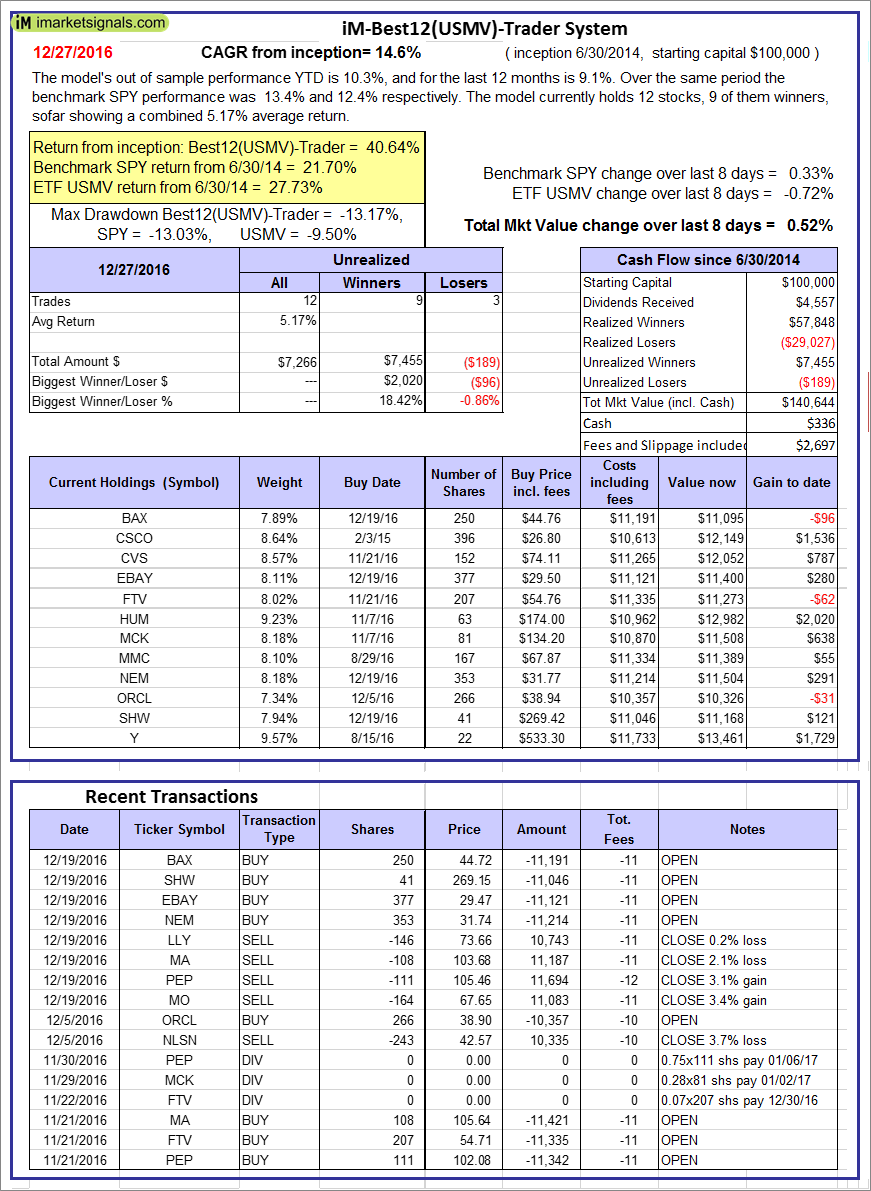  |
iM-Best12(USMV)-Trader: The model’s out of sample performance YTD is 10.3%, and for the last 12 months is 9.1%. Over the same period the benchmark SPY performance was 13.4% and 12.4% respectively. Since inception, on 7/1/2014, the model gained 40.64% while the benchmark SPY gained 21.70% and the ETF USMV gained 27.73% over the same period. Over the previous week the market value of iM-Best12(USMV)-Trader gained 0.52% at a time when SPY gained 0.33%. A starting capital of $100,000 at inception on 7/1/2014 would have grown to $140,644 which includes $336 cash and excludes $2,697 spent on fees and slippage. |
  |
iM-Best12(USMV)Q1-Investor: The model’s out of sample performance YTD is 21.8%, and for the last 12 months is 20.7%. Over the same period the benchmark SPY performance was 13.4% and 12.4% respectively. Since inception, on 1/5/2015, the model gained 27.06% while the benchmark SPY gained 16.95% and the ETF USMV gained 17.30% over the same period. Over the previous week the market value of iM-Best12(USMV)Q1 gained 0.17% at a time when SPY gained 0.33%. A starting capital of $100,000 at inception on 1/5/2015 would have grown to $127,061 which includes $78 cash and excludes $598 spent on fees and slippage. |
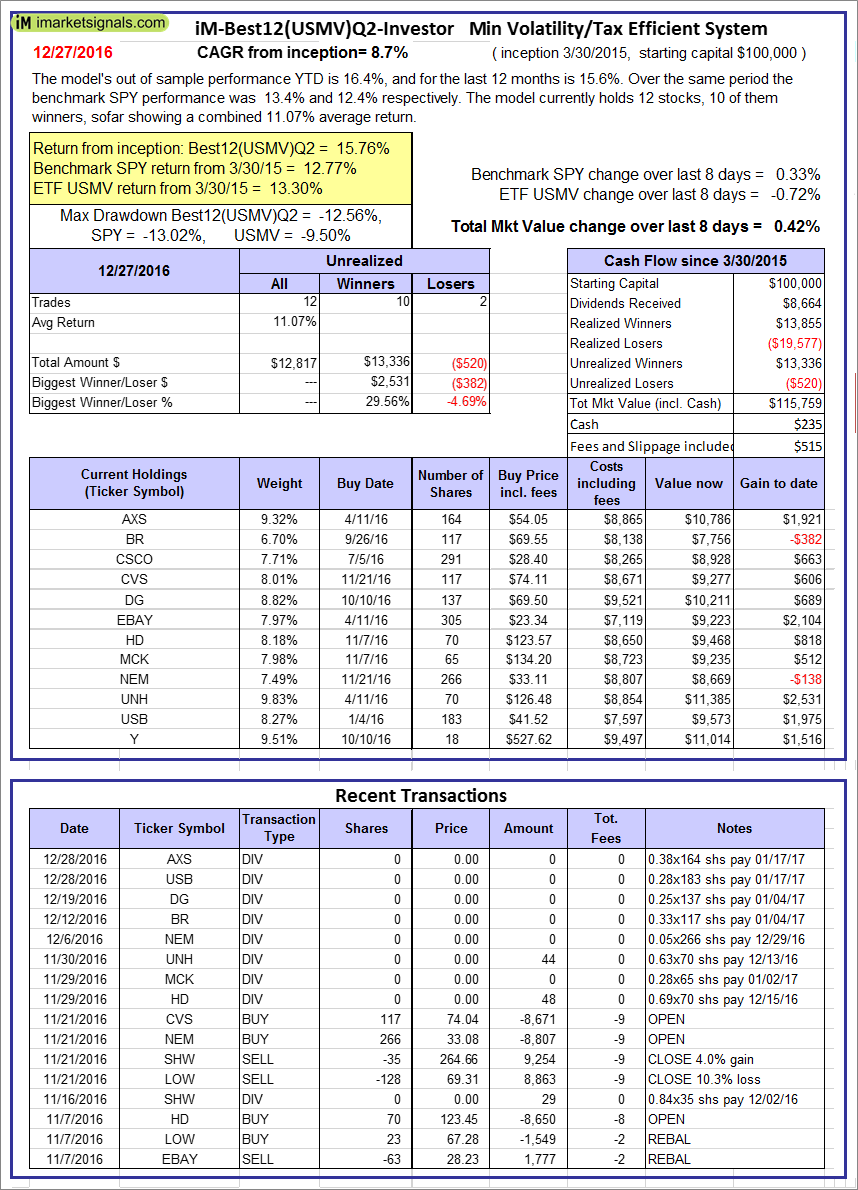 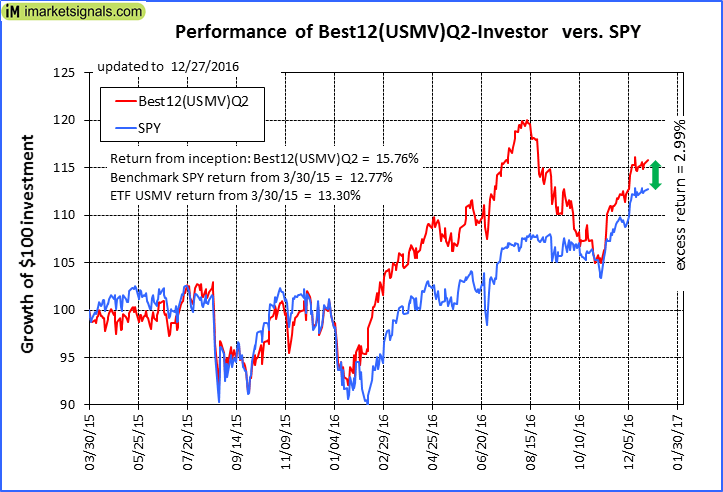 |
iM-Best12(USMV)Q2-Investor: The model’s out of sample performance YTD is 16.4%, and for the last 12 months is 15.6%. Over the same period the benchmark SPY performance was 13.4% and 12.4% respectively. Since inception, on 3/31/2015, the model gained 15.76% while the benchmark SPY gained 12.77% and the ETF USMV gained 13.30% over the same period. Over the previous week the market value of iM-Best12(USMV)Q2 gained 0.42% at a time when SPY gained 0.33%. A starting capital of $100,000 at inception on 3/31/2015 would have grown to $115,759 which includes $235 cash and excludes $515 spent on fees and slippage. |
 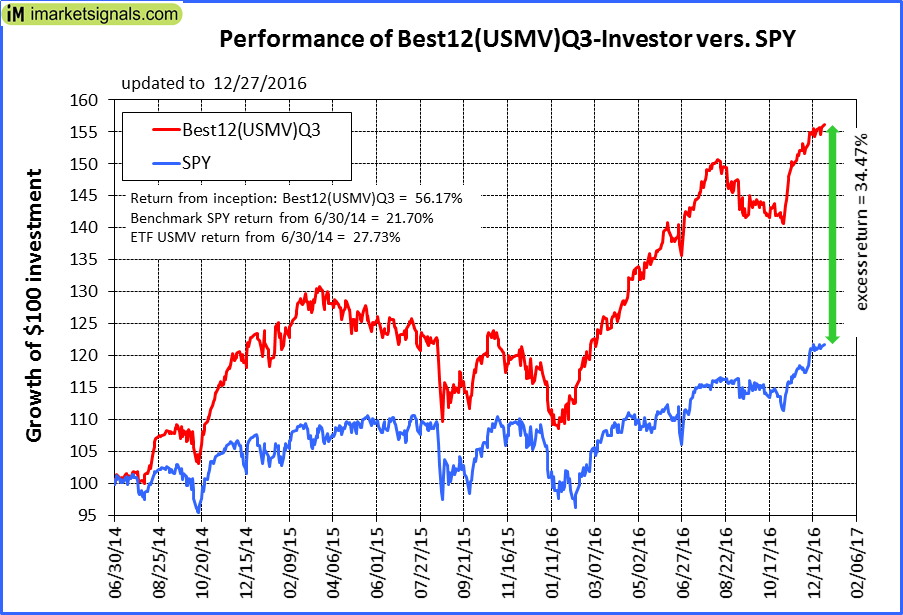 |
iM-Best12(USMV)Q3-Investor: The model’s out of sample performance YTD is 33.2%, and for the last 12 months is 32.0%. Over the same period the benchmark SPY performance was 13.4% and 12.4% respectively. Since inception, on 7/1/2014, the model gained 56.17% while the benchmark SPY gained 21.70% and the ETF USMV gained 27.73% over the same period. Over the previous week the market value of iM-Best12(USMV)Q3 gained 0.45% at a time when SPY gained 0.33%. A starting capital of $100,000 at inception on 7/1/2014 would have grown to $156,173 which includes -$131 cash and excludes $865 spent on fees and slippage. |
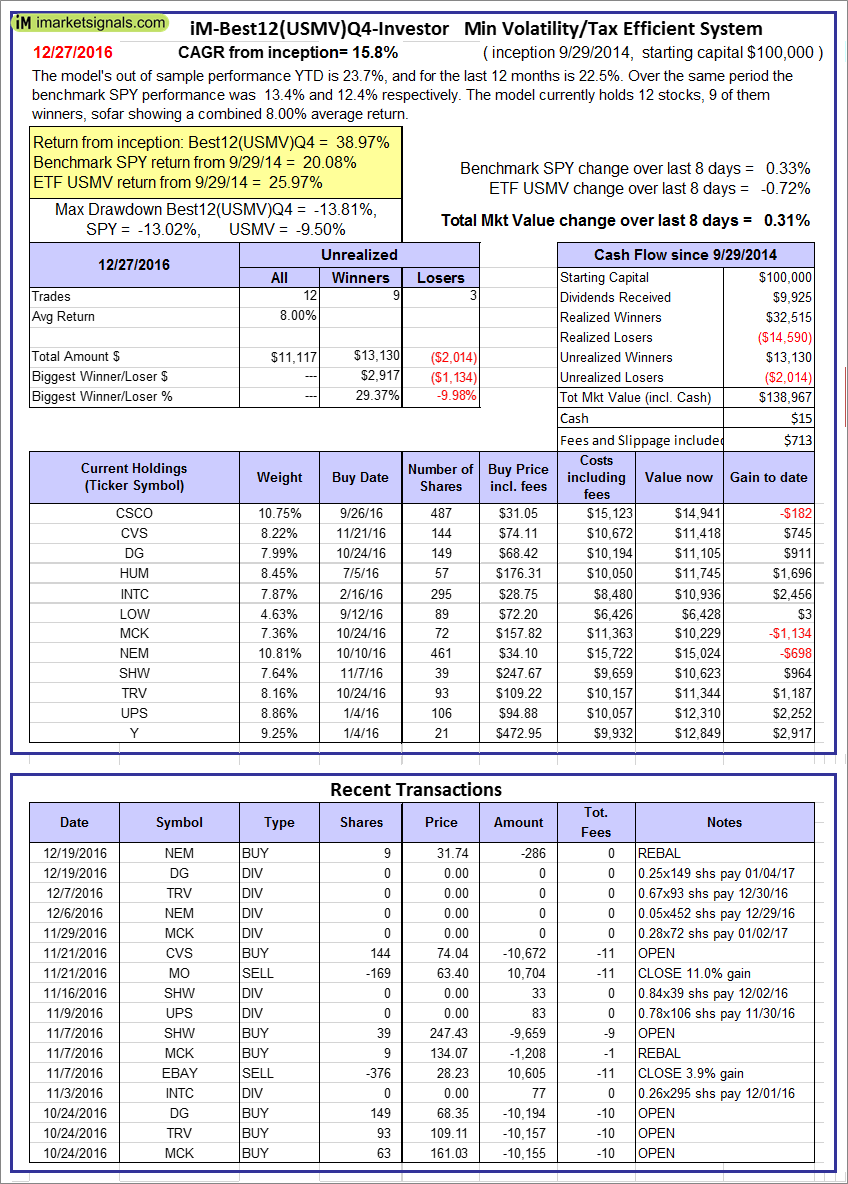 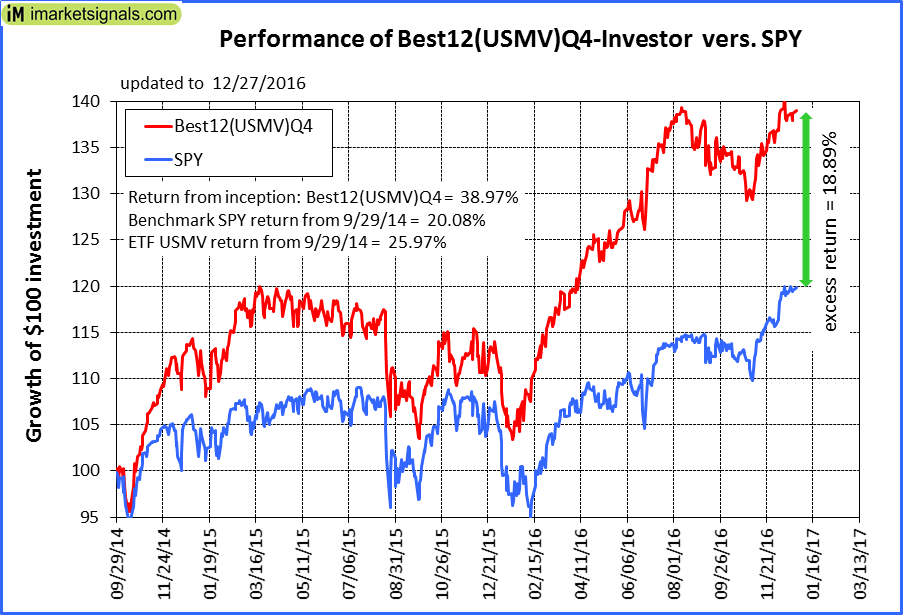 |
iM-Best12(USMV)Q4-Investor: Since inception, on 9/30/2014, the model gained 38.97% while the benchmark SPY gained 20.08% and the ETF USMV gained 25.97% over the same period. Over the previous week the market value of iM-Best12(USMV)Q4 gained 0.31% at a time when SPY gained 0.33%. A starting capital of $100,000 at inception on 9/30/2014 would have grown to $138,967 which includes $15 cash and excludes $713 spent on fees and slippage. |
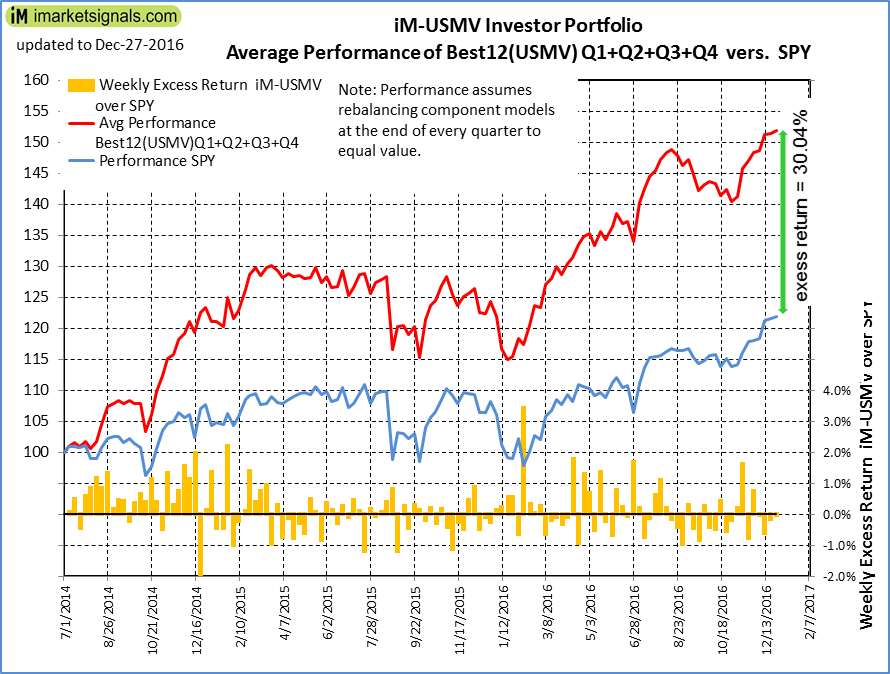 |
Average Performance of iM-Best12(USMV)Q1+Q2+Q3+Q4-Investor resulted in an excess return of 30.04% over SPY. (see iM-USMV Investor Portfolio) |
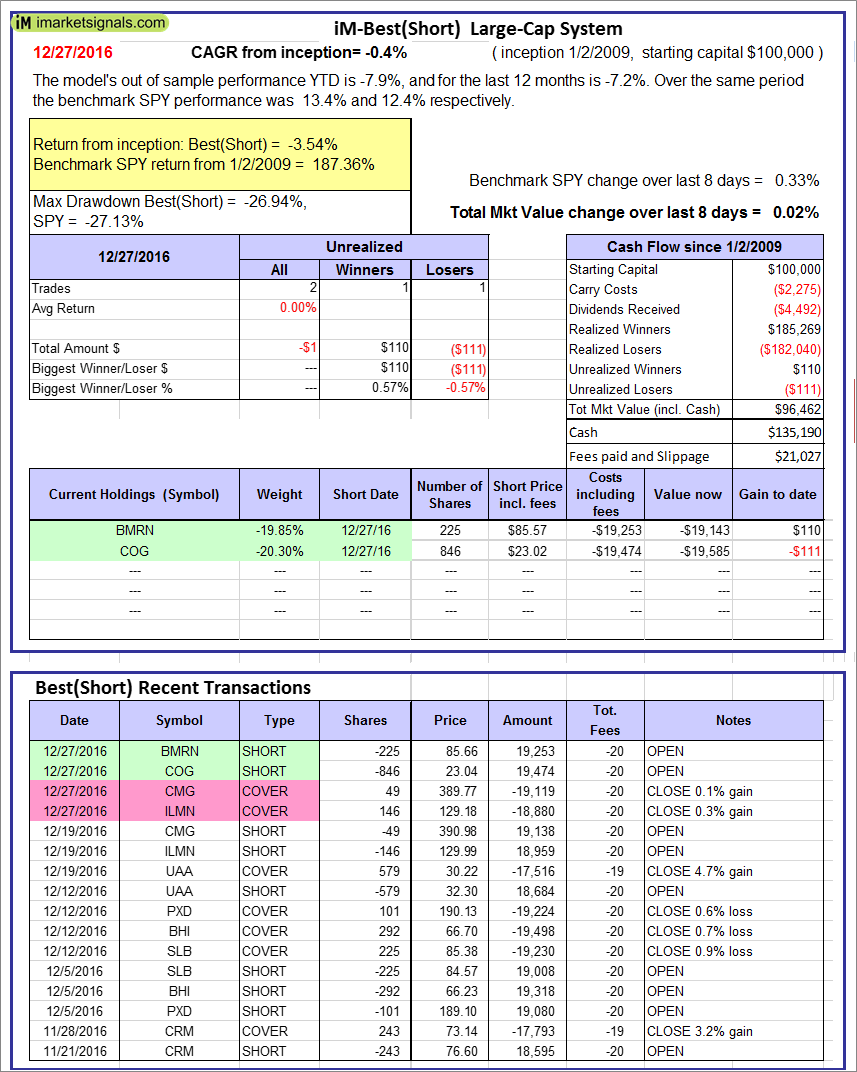 |
iM-Best(Short): The model’s out of sample performance YTD is -7.9%, and for the last 12 months is -7.2%. Over the same period the benchmark SPY performance was 13.4% and 12.4% respectively. Over the previous week the market value of iM-Best(Short) gained 0.02% at a time when SPY gained 0.33%. Over the period 1/2/2009 to 12/27/2016 the starting capital of $100,000 would have grown to $96,462 which includes $135,190 cash and excludes $21,027 spent on fees and slippage. |
iM-Best Reports – 12/27/2016
Posted in pmp SPY-SH
Leave a Reply
You must be logged in to post a comment.