  |
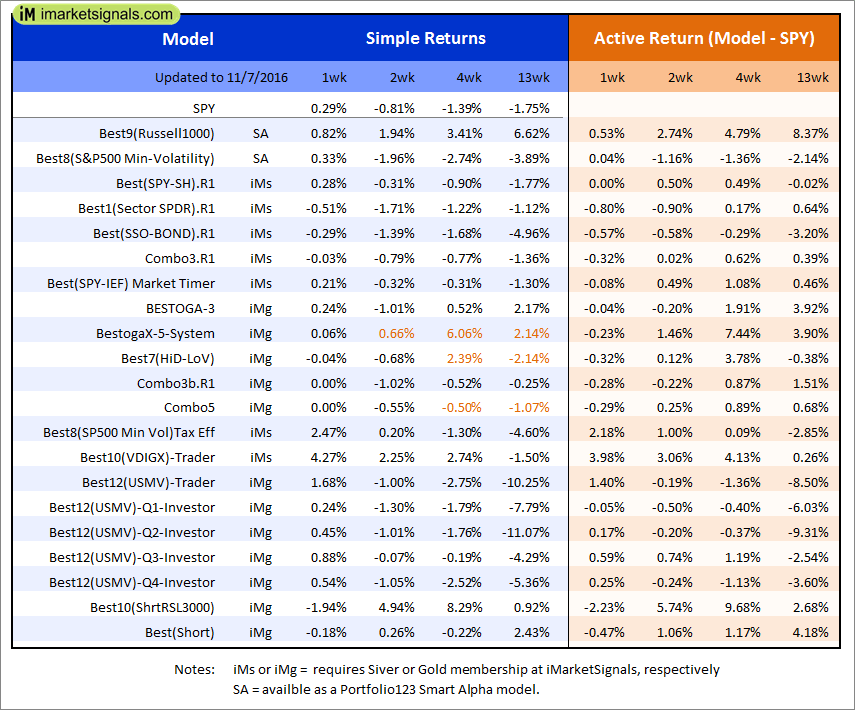
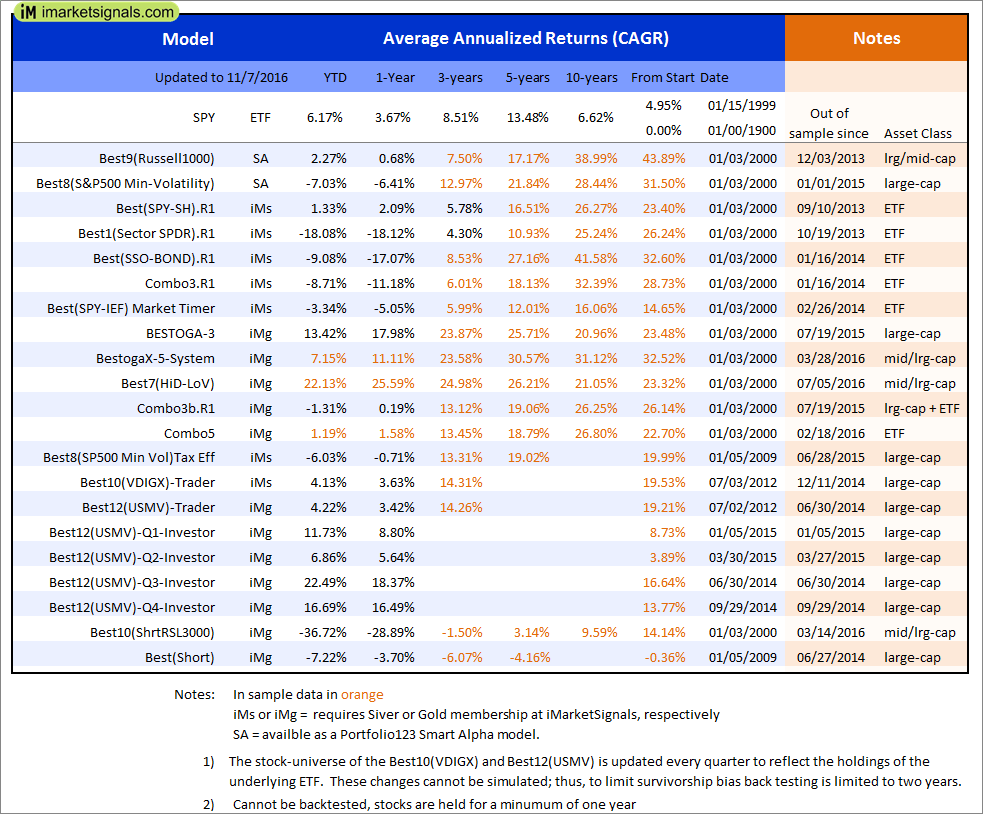
Out of sample performance summary of our models for the past 1, 2, 4 and 13 week periods. The active active return indicates how the models over- or underperformed the benchmark ETF SPY. Also the YTD, and the 1-, 3-, 5- and 10-year annualized returns are shown in the second table |
|
|
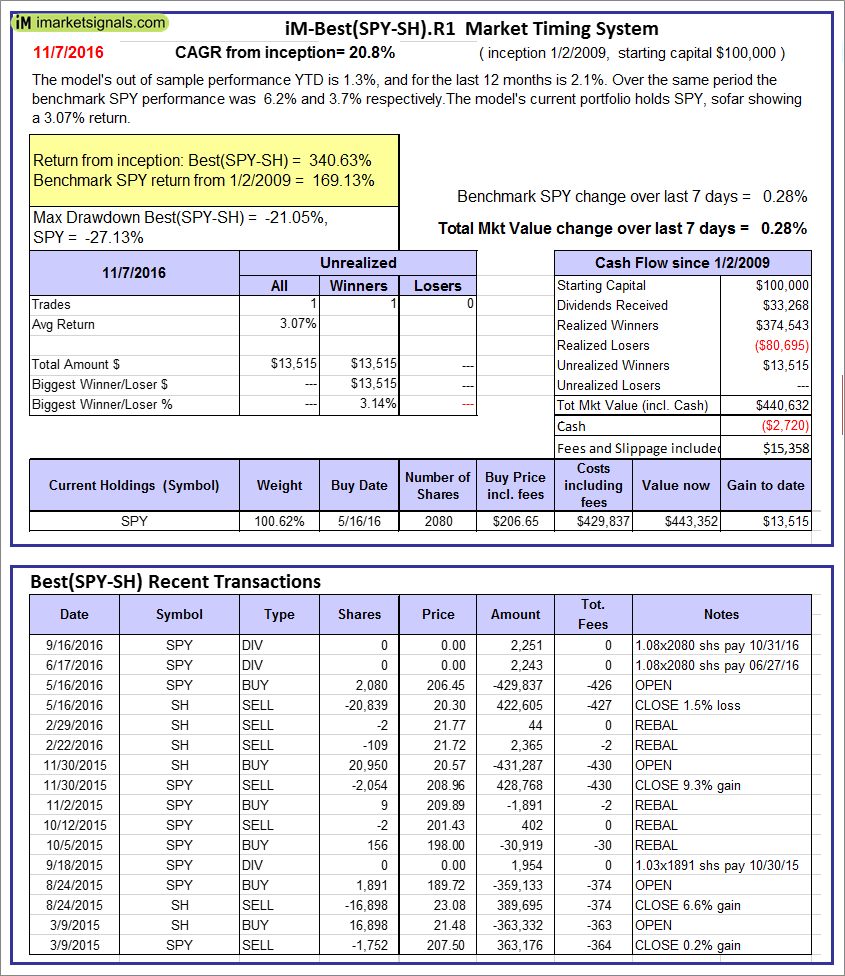
iM-Best(SPY-SH).R1: The model’s out of sample performance YTD is 1.3%, and for the last 12 months is 2.1%. Over the same period the benchmark SPY performance was 6.2% and 3.7% respectively. Over the previous week the market value of Best(SPY-SH) gained 0.28% at a time when SPY gained 0.28%. A starting capital of $100,000 at inception on 1/2/2009 would have grown to $440,632 which includes -$2,720 cash and excludes $15,358 spent on fees and slippage. |
|
|
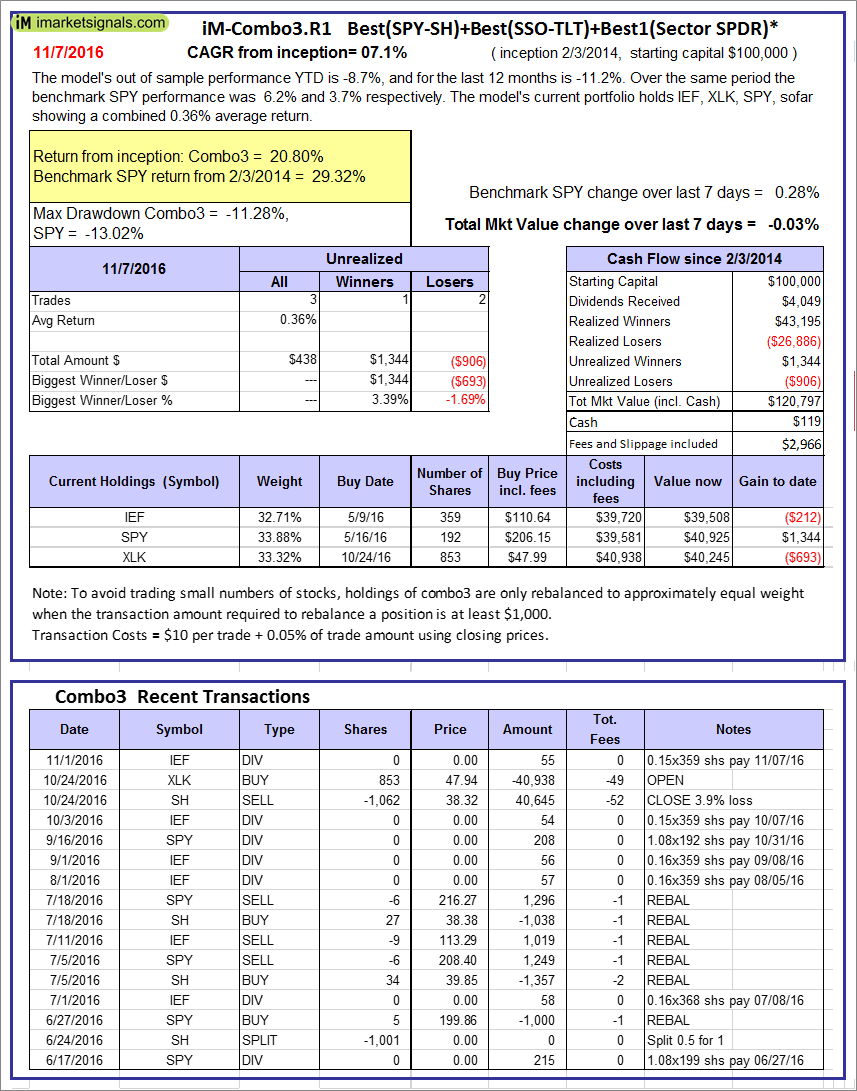
iM-Combo3.R1: The model’s out of sample performance YTD is -8.7%, and for the last 12 months is -11.2%. Over the same period the benchmark SPY performance was 6.2% and 3.7% respectively. Over the previous week the market value of iM-Combo3.R1 gained -0.03% at a time when SPY gained 0.28%. A starting capital of $100,000 at inception on 2/3/2014 would have grown to $120,797 which includes $119 cash and excludes $2,966 spent on fees and slippage. |
|
|
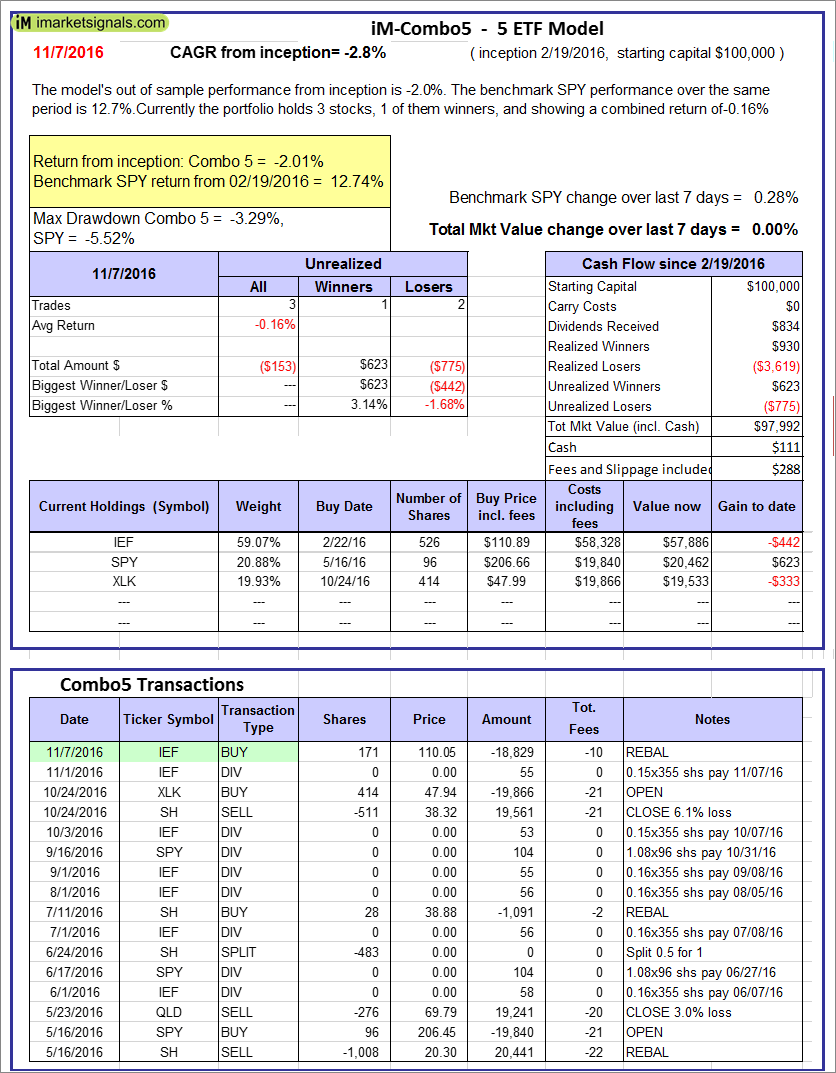
iM-Combo5: The model’s out of sample performance from inception is -2.0%. The benchmark SPY performance over the same period is 12.7%. Over the previous week the market value of iM-Combo5 gained 0.00% at a time when SPY gained 0.28%. A starting capital of $100,000 at inception on 2/22/2016 would have grown to $97,992 which includes $111 cash and excludes $288 spent on fees and slippage. |
|
|
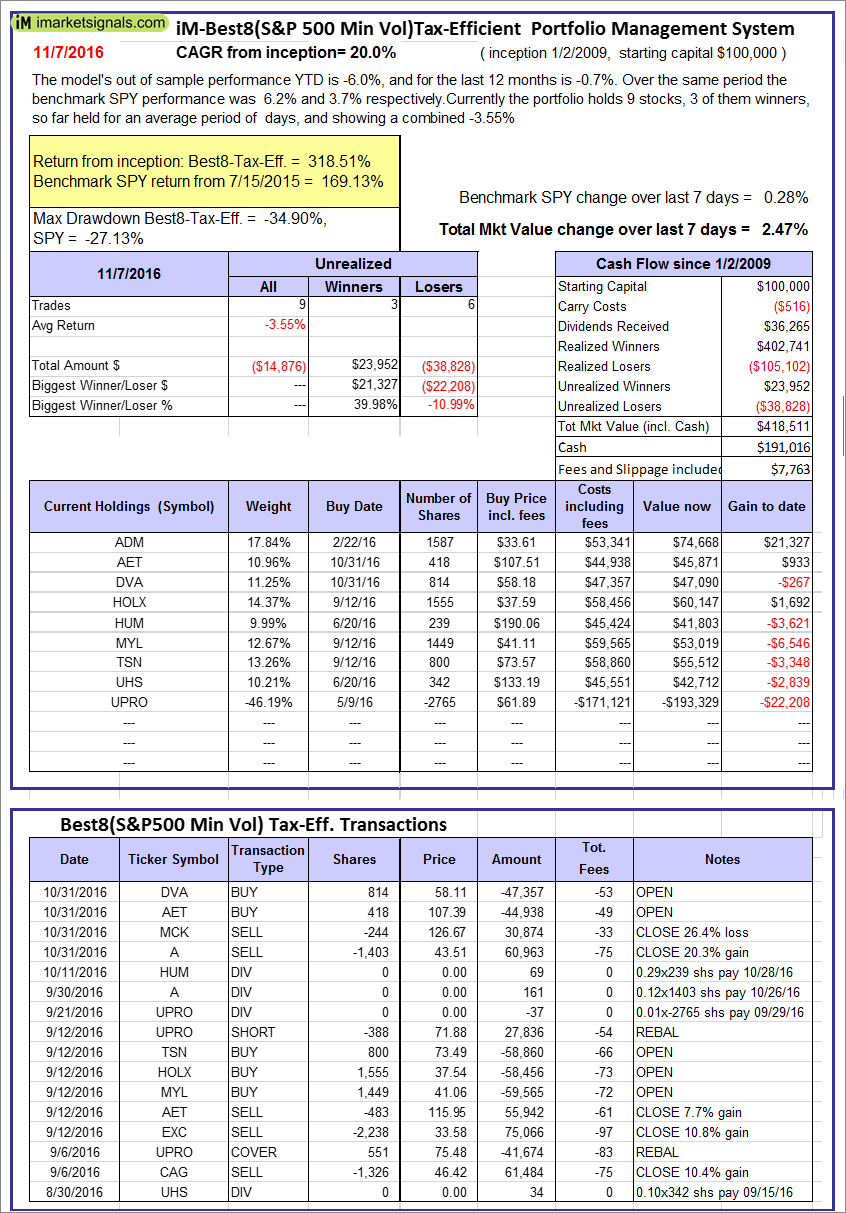
The iM-Best8(S&P500 Min Vol)Tax-Efficient The model’s out of sample performance YTD is -6.0%, and for the last 12 months is -0.7%. Over the same period the benchmark SPY performance was 6.2% and 3.7% respectively. Over the previous week the market value of iM-Best8(S&P 500)Tax-Eff. gained 2.47% at a time when SPY gained 0.28%. A starting capital of $100,000 at inception on 1/2/2009 would have grown to $418,511 which includes $191,016 cash and excludes $7,763 spent on fees and slippage. |
|
|
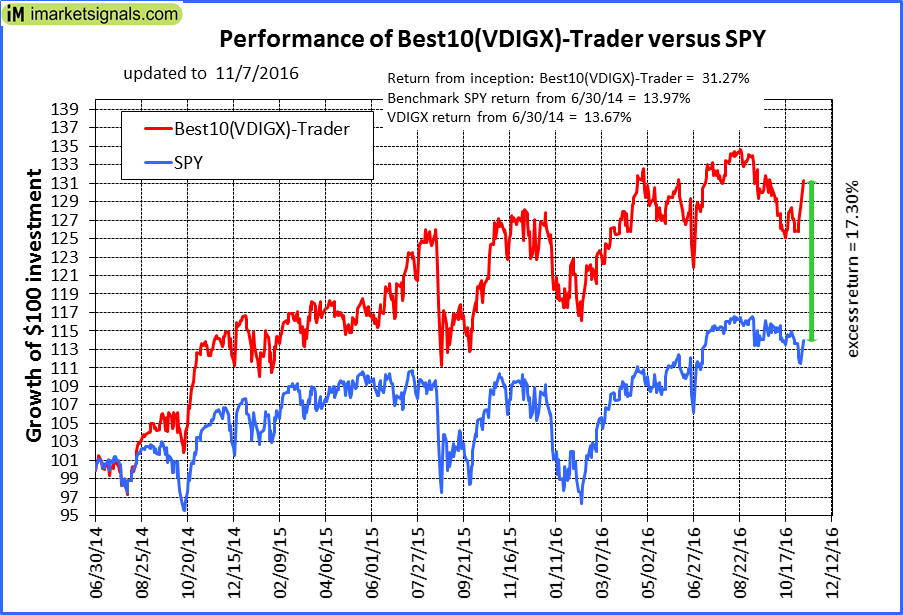
iM-Best10(VDIGX)-Trader: The model’s out of sample performance YTD is 4.1%, and for the last 12 months is 3.6%. Over the same period the benchmark SPY performance was 6.2% and 3.7% respectively. Since inception, on 7/1/2014, the model gained 31.27% while the benchmark SPY gained 13.97% and the ETF VDIGX gained 13.67% over the same period. Over the previous week the market value of iM-Best10(VDIGX) gained 4.27% at a time when SPY gained 0.28%. A starting capital of $100,000 at inception on 7/1/2014 would have grown to $131,268 which includes -$44 cash and excludes $1,408 spent on fees and slippage. |
|
|
iM-Best2 MC-Score ETF System: The model’s out of sample performance from inception is -4.1%. The benchmark SPY performance over the same period is 2.3%. Over the previous week the market value of iM-BESTOGA-3 gained -0.28% at a time when SPY gained 0.28%. A starting capital of $100,000 at inception on 2/3/2014 would have grown to $43 which includes $103 cash and excludes Gain to date spent on fees and slippage. |
|
|
iM-BESTOGA-3: The model’s out of sample performance YTD is 13.4%, and for the last 12 months is 18.0%. Over the same period the benchmark SPY performance was 6.2% and 3.7% respectively. Over the previous week the market value of iM-BESTOGA-3 gained 0.24% at a time when SPY gained 0.28%. A starting capital of $100,000 at inception on 2/3/2014 would have grown to $208,396 which includes $20,041 cash and excludes $767 spent on fees and slippage. |
|
|
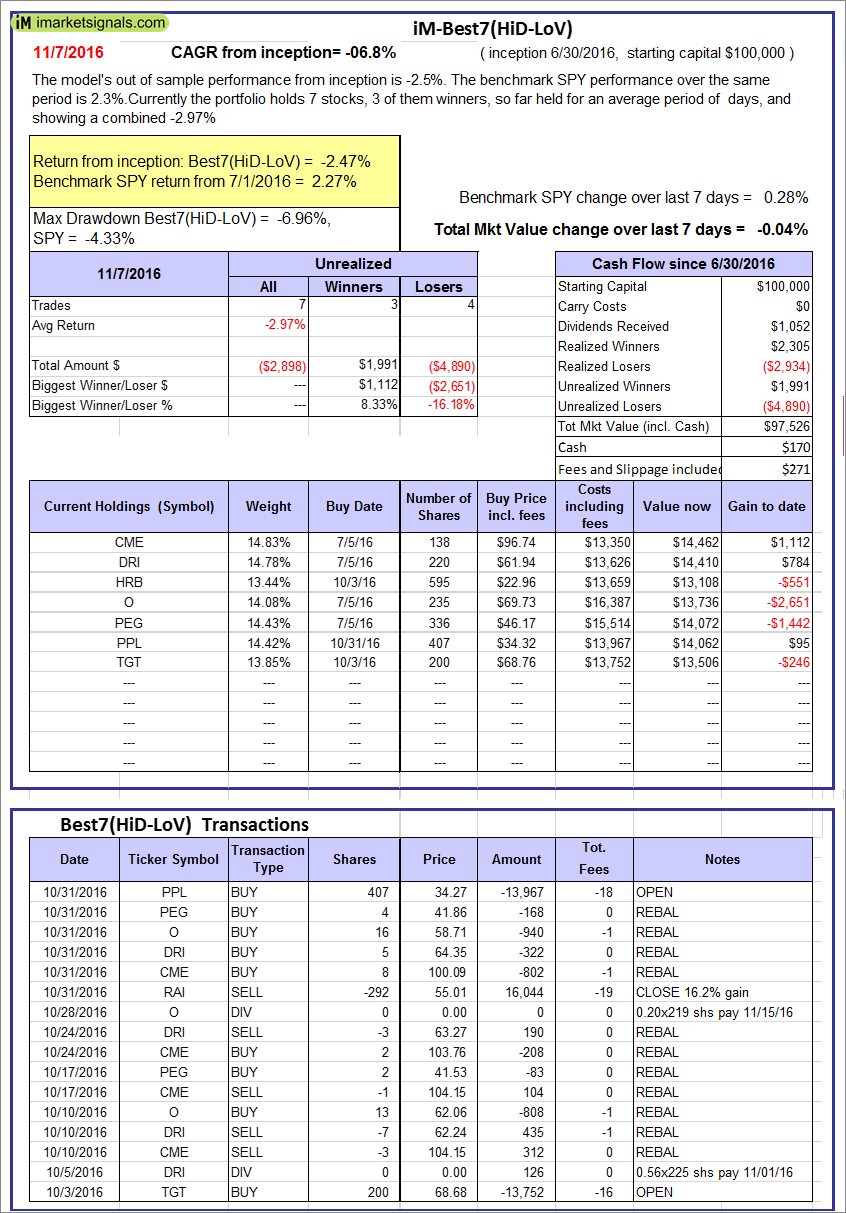
iM-Best7(HiD-LoV): The model’s out of sample performance from inception is -2.5%. The benchmark SPY performance over the same period is 2.3%. Over the previous week the market value of iM-BESTOGA-3 gained -0.04% at a time when SPY gained 0.28%. A starting capital of $100,000 at inception on 2/3/2014 would have grown to $97,526 which includes $170 cash and excludes $271 spent on fees and slippage. |
|
|
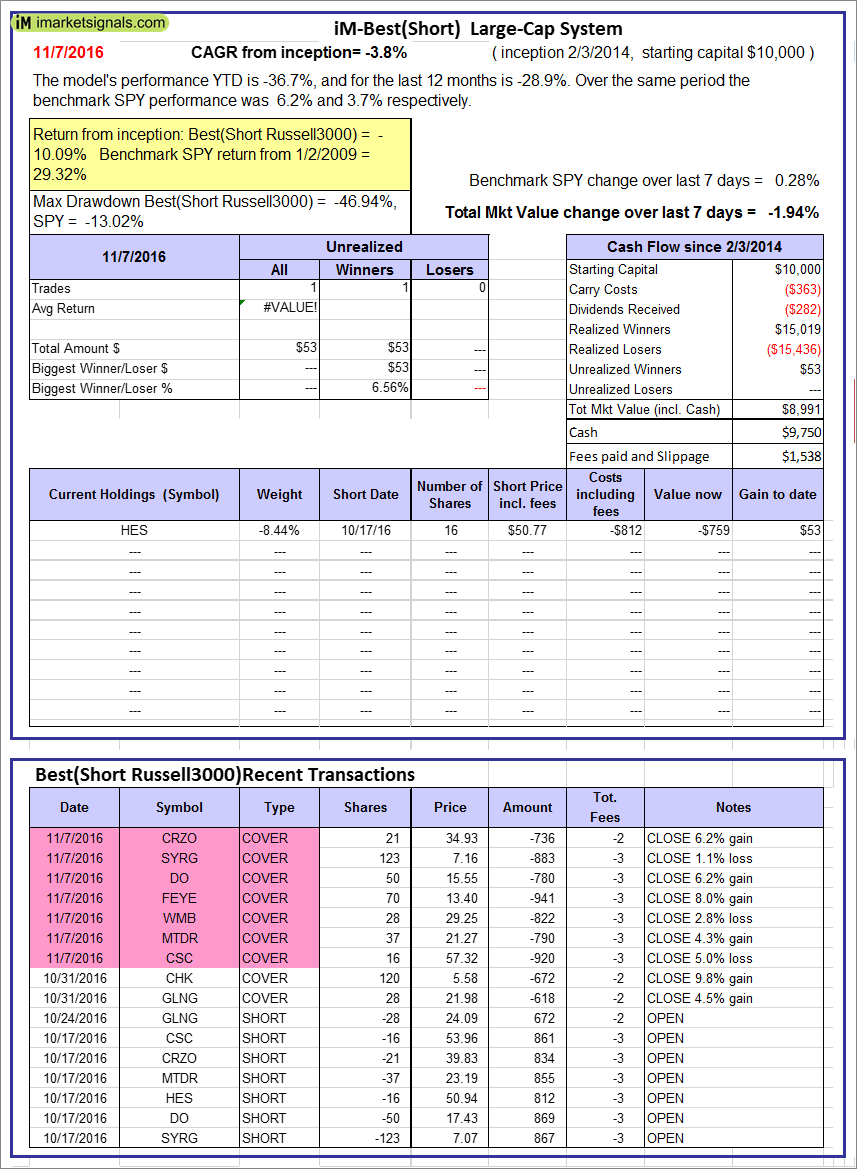
iM-Best10(Short Russell3000): The model’s performance YTD is -36.7%, and for the last 12 months is -28.9%. Over the same period the benchmark SPY performance was 6.2% and 3.7% respectively. Over the previous week the market value of iM-Best10(Short Russell3000) gained -1.94% at a time when SPY gained 0.28%. Over the period 2/3/2014 to 11/7/2016 the starting capital of $100,000 would have grown to $8,991 which includes $9,750 cash and excludes $1,538 spent on fees and slippage. |
|
|
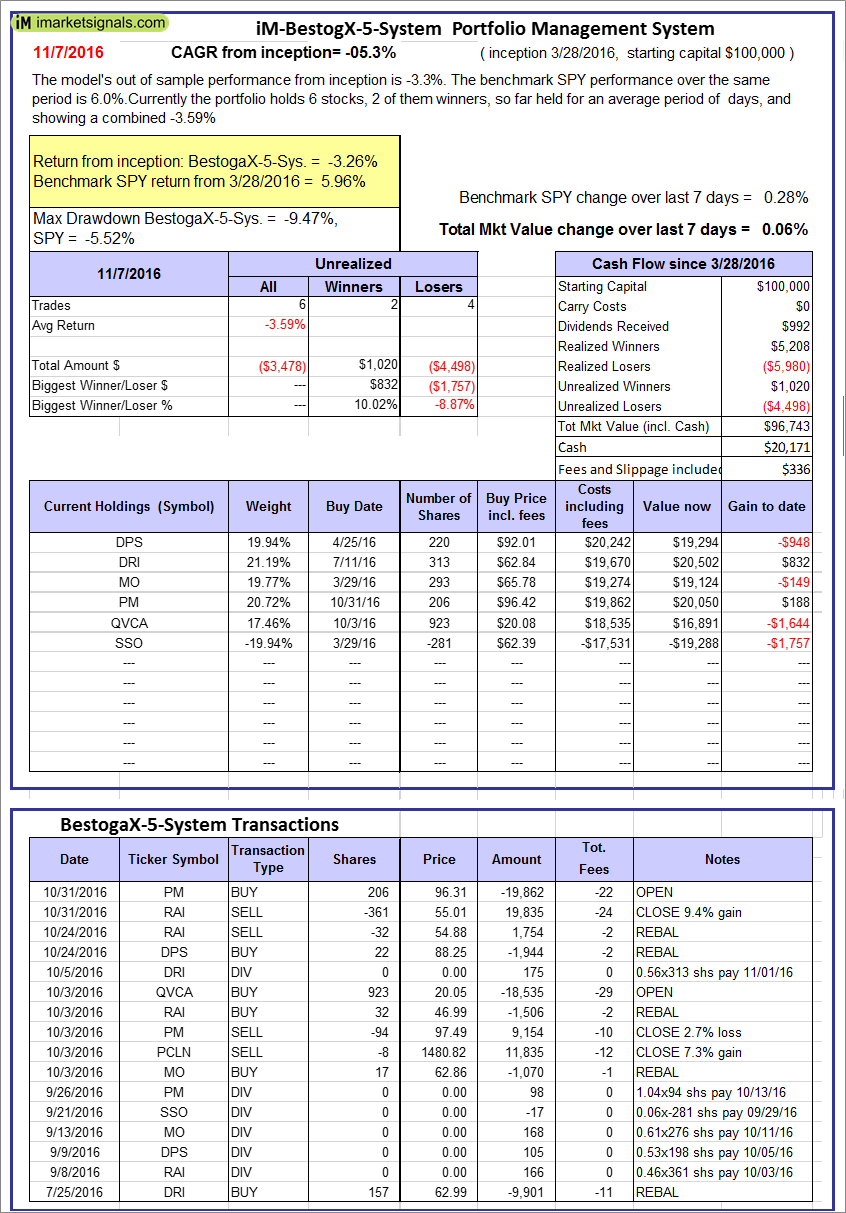
iM-BestogaX5-System: The model’s out of sample performance from inception is -3.3%. The benchmark SPY performance over the same period is 6.0%. Over the previous week the market value of iM-Best8(S&P 500)Tax-Eff. gained 0.06% at a time when SPY gained 0.28%. A starting capital of $100,000 at inception on 1/2/2009 would have grown to $96,743 which includes $20,171 cash and excludes $336 spent on fees and slippage. |
|
|
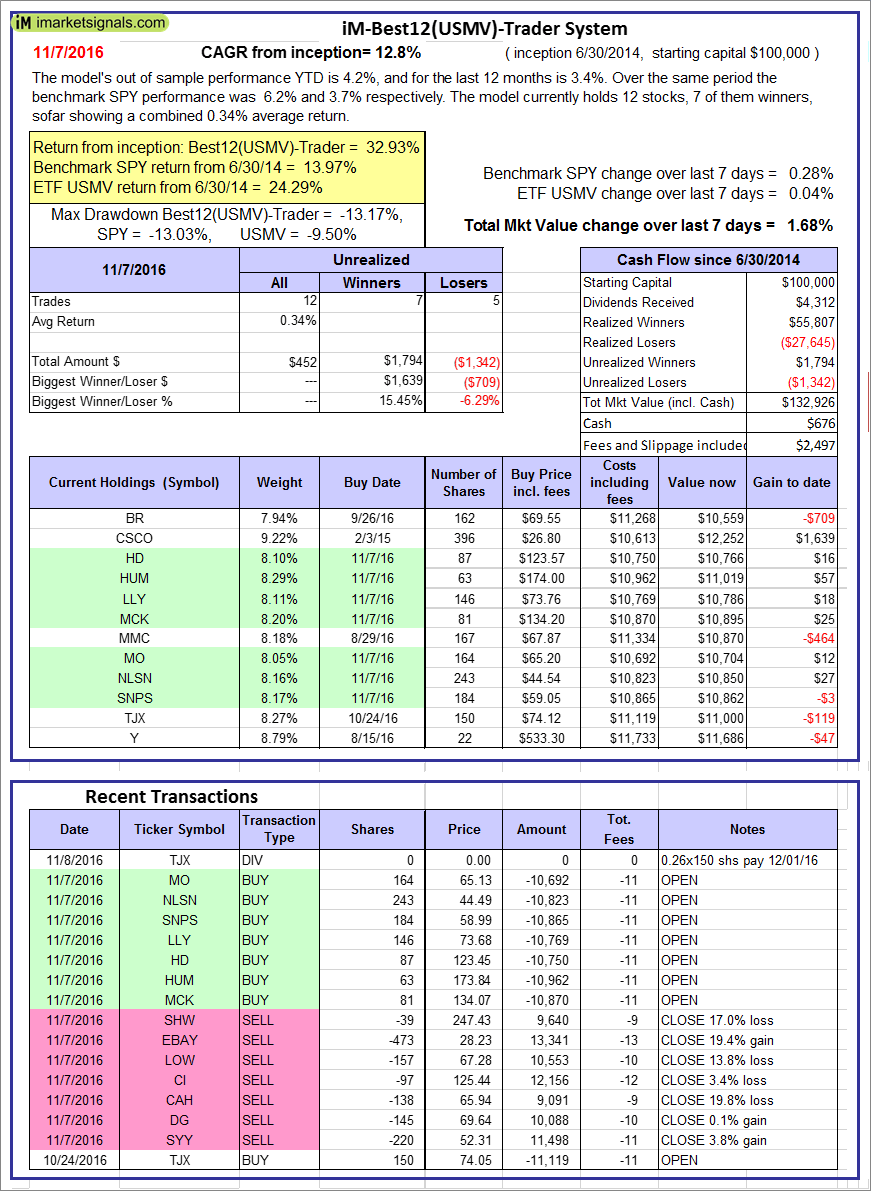
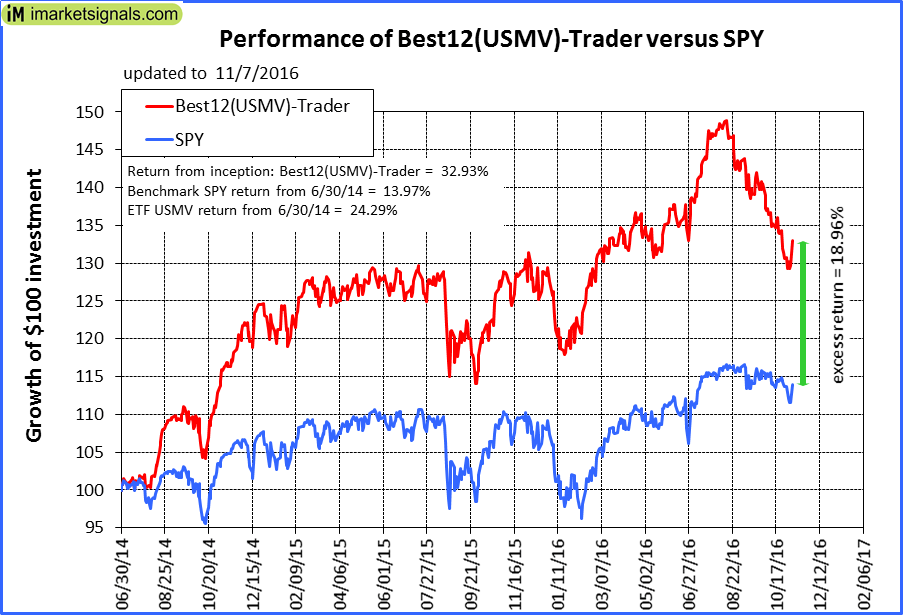
iM-Best12(USMV)-Trader: The model’s out of sample performance YTD is 4.2%, and for the last 12 months is 3.4%. Over the same period the benchmark SPY performance was 6.2% and 3.7% respectively. Since inception, on 7/1/2014, the model gained 32.93% while the benchmark SPY gained 13.97% and the ETF USMV gained 24.29% over the same period. Over the previous week the market value of iM-Best12(USMV)-Trader gained 1.68% at a time when SPY gained 0.28%. A starting capital of $100,000 at inception on 7/1/2014 would have grown to $132,926 which includes $676 cash and excludes $2,497 spent on fees and slippage. |
|
|
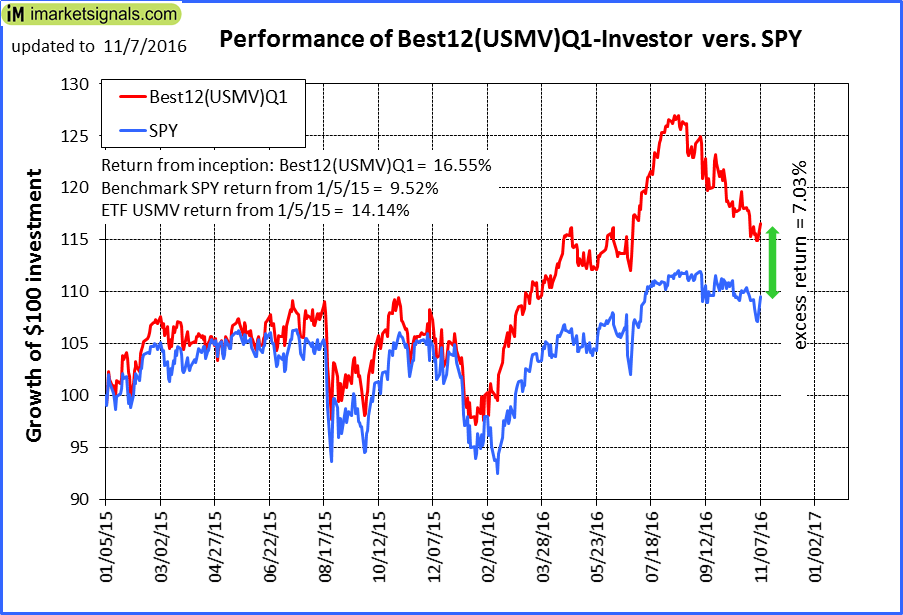
iM-Best12(USMV)Q1-Investor: The model’s out of sample performance YTD is 11.7%, and for the last 12 months is 8.8%. Over the same period the benchmark SPY performance was 6.2% and 3.7% respectively. Since inception, on 1/5/2015, the model gained 16.55% while the benchmark SPY gained 9.52% and the ETF USMV gained 14.14% over the same period. Over the previous week the market value of iM-Best12(USMV)Q1 gained 0.24% at a time when SPY gained 0.28%. A starting capital of $100,000 at inception on 1/5/2015 would have grown to $116,551 which includes -$439 cash and excludes $579 spent on fees and slippage. |
|
|
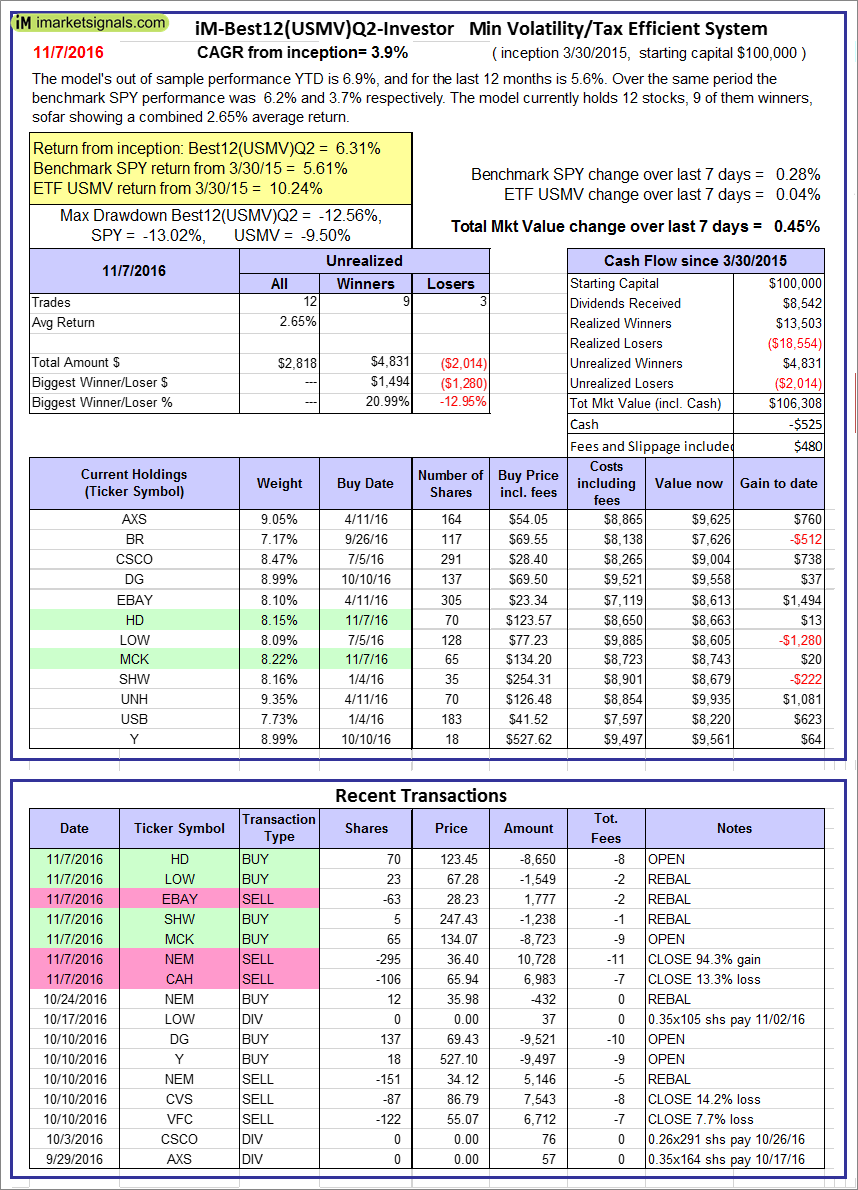
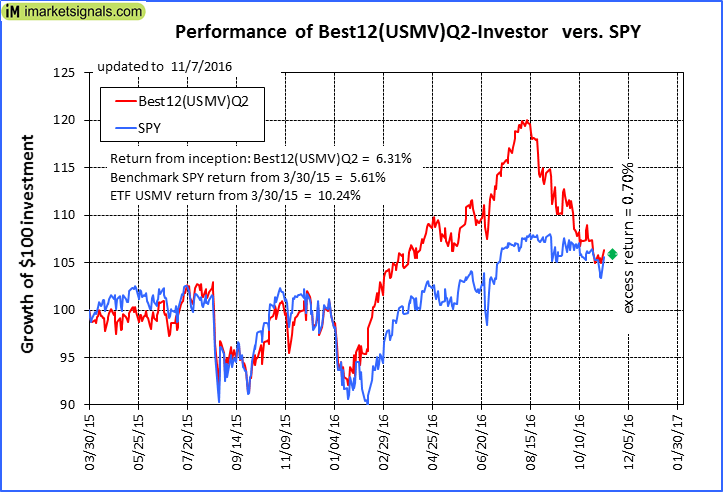
iM-Best12(USMV)Q2-Investor: The model’s out of sample performance YTD is 6.9%, and for the last 12 months is 5.6%. Over the same period the benchmark SPY performance was 6.2% and 3.7% respectively. Since inception, on 3/31/2015, the model gained 6.31% while the benchmark SPY gained 5.61% and the ETF USMV gained 10.24% over the same period. Over the previous week the market value of iM-Best12(USMV)Q2 gained 0.45% at a time when SPY gained 0.28%. A starting capital of $100,000 at inception on 3/31/2015 would have grown to $106,308 which includes -$525 cash and excludes $480 spent on fees and slippage. |
|
|
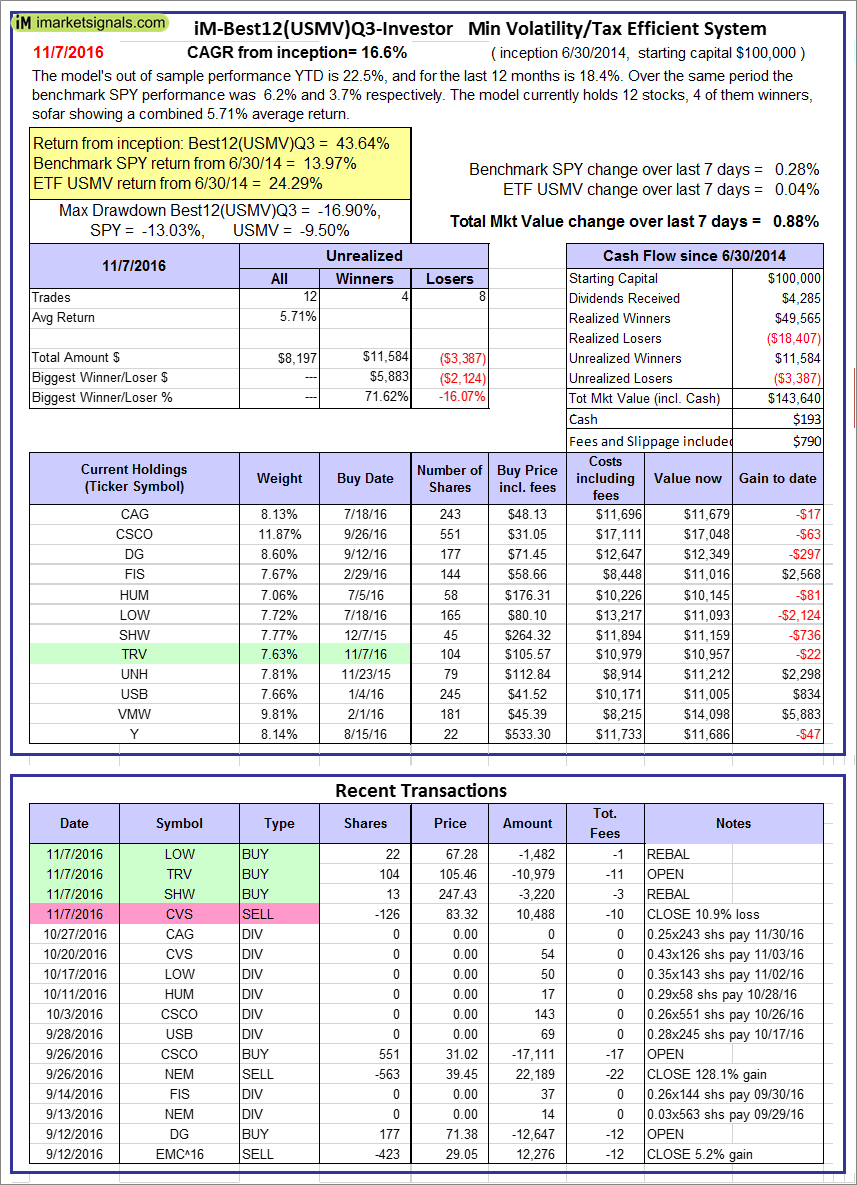
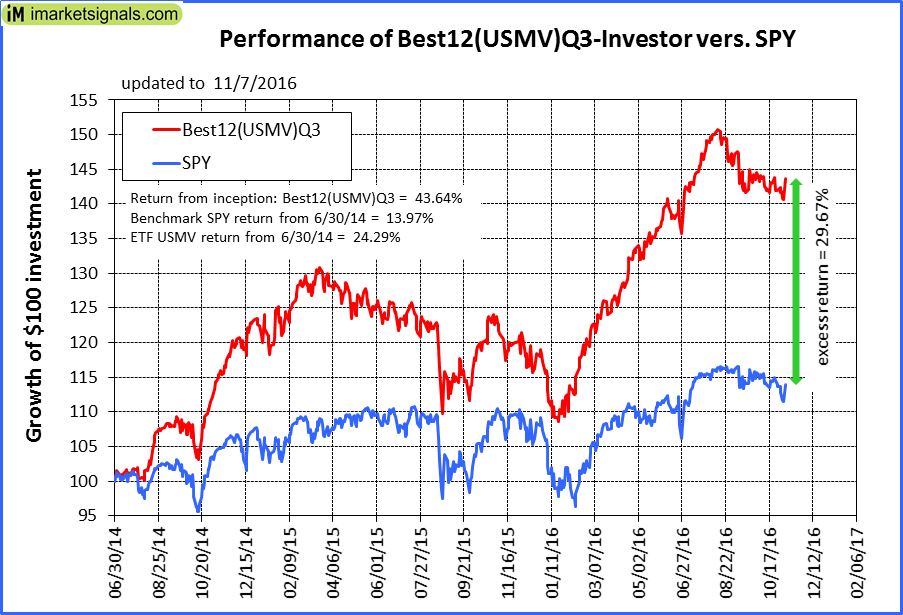
iM-Best12(USMV)Q3-Investor: The model’s out of sample performance YTD is 22.5%, and for the last 12 months is 18.4%. Over the same period the benchmark SPY performance was 6.2% and 3.7% respectively. Since inception, on 7/1/2014, the model gained 43.64% while the benchmark SPY gained 13.97% and the ETF USMV gained 24.29% over the same period. Over the previous week the market value of iM-Best12(USMV)Q3 gained 0.88% at a time when SPY gained 0.28%. A starting capital of $100,000 at inception on 7/1/2014 would have grown to $143,640 which includes $193 cash and excludes $790 spent on fees and slippage. |
|
|
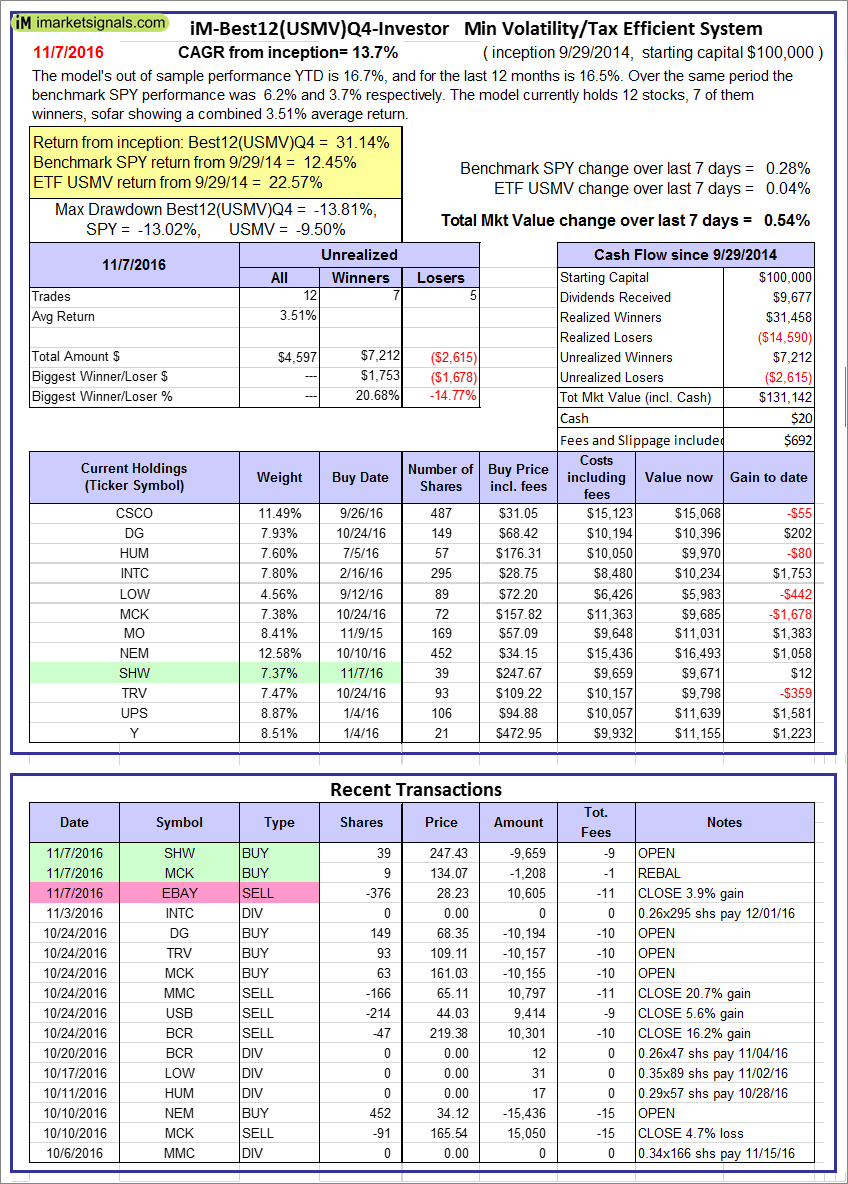
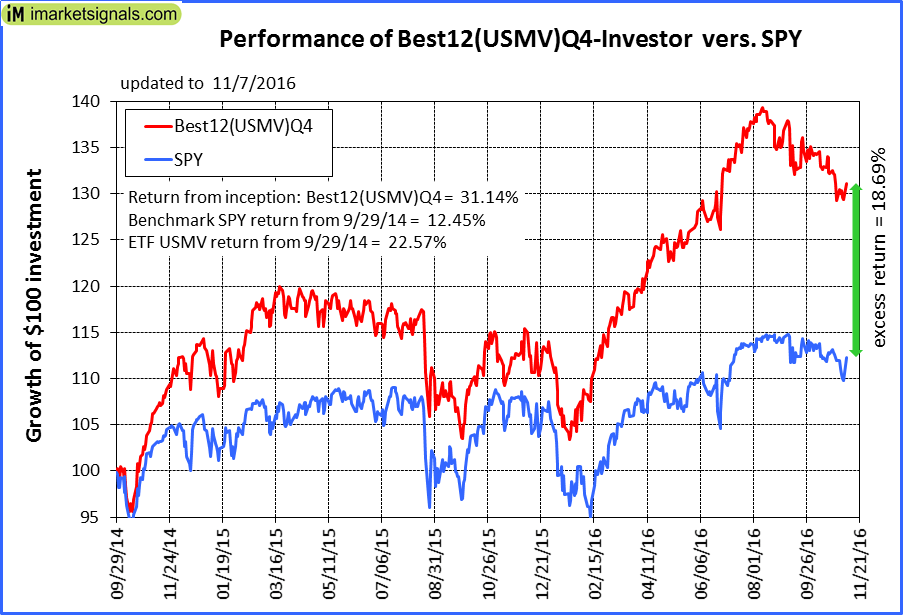
iM-Best12(USMV)Q4-Investor: Since inception, on 9/30/2014, the model gained 31.14% while the benchmark SPY gained 12.45% and the ETF USMV gained 22.57% over the same period. Over the previous week the market value of iM-Best12(USMV)Q4 gained 0.54% at a time when SPY gained 0.28%. A starting capital of $100,000 at inception on 9/30/2014 would have grown to $131,142 which includes $20 cash and excludes $692 spent on fees and slippage. |
|
|
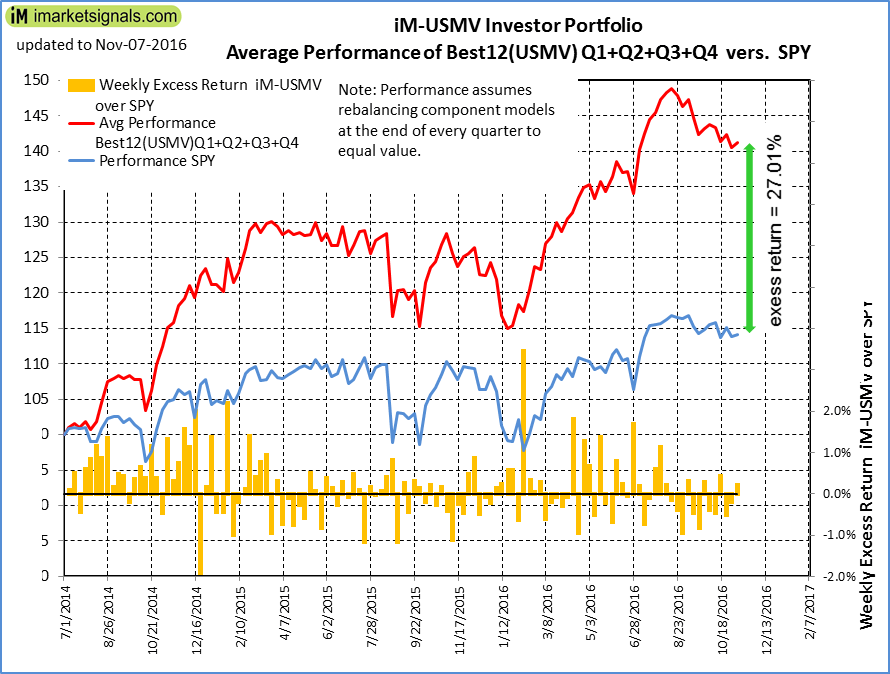
Average Performance of iM-Best12(USMV)Q1+Q2+Q3+Q4-Investor resulted in an excess return of 27.01% over SPY. (see iM-USMV Investor Portfolio) |
|
|
iM-Best(Short): The model’s out of sample performance YTD is -7.2%, and for the last 12 months is -3.7%. Over the same period the benchmark SPY performance was 6.2% and 3.7% respectively. Over the previous week the market value of iM-Best(Short) gained -0.19% at a time when SPY gained 0.28%. Over the period 1/2/2009 to 11/7/2016 the starting capital of $100,000 would have grown to $97,142 which includes $137,208 cash and excludes $20,585 spent on fees and slippage. |


Leave a Reply
You must be logged in to post a comment.