
  |
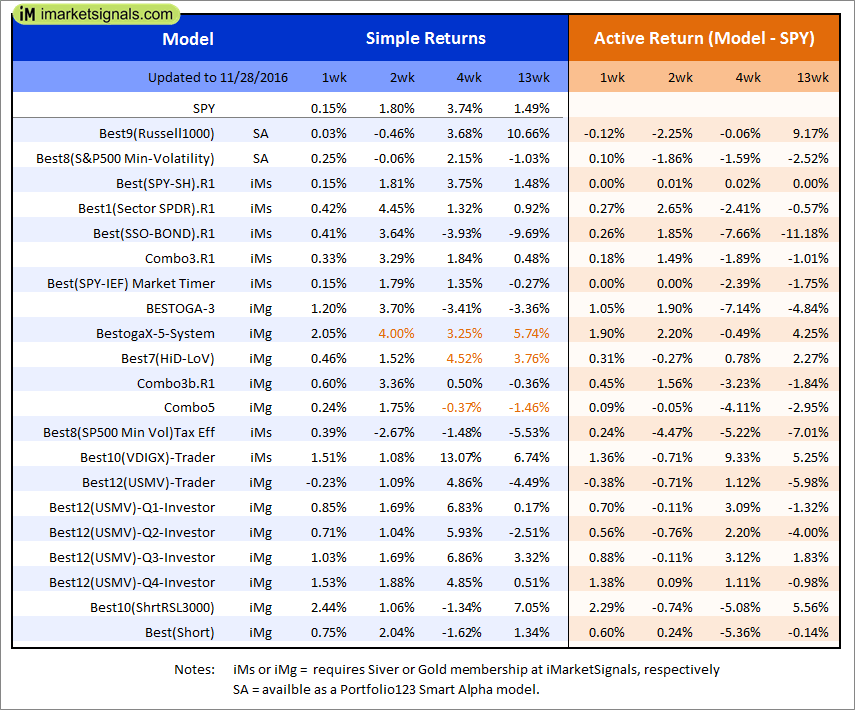
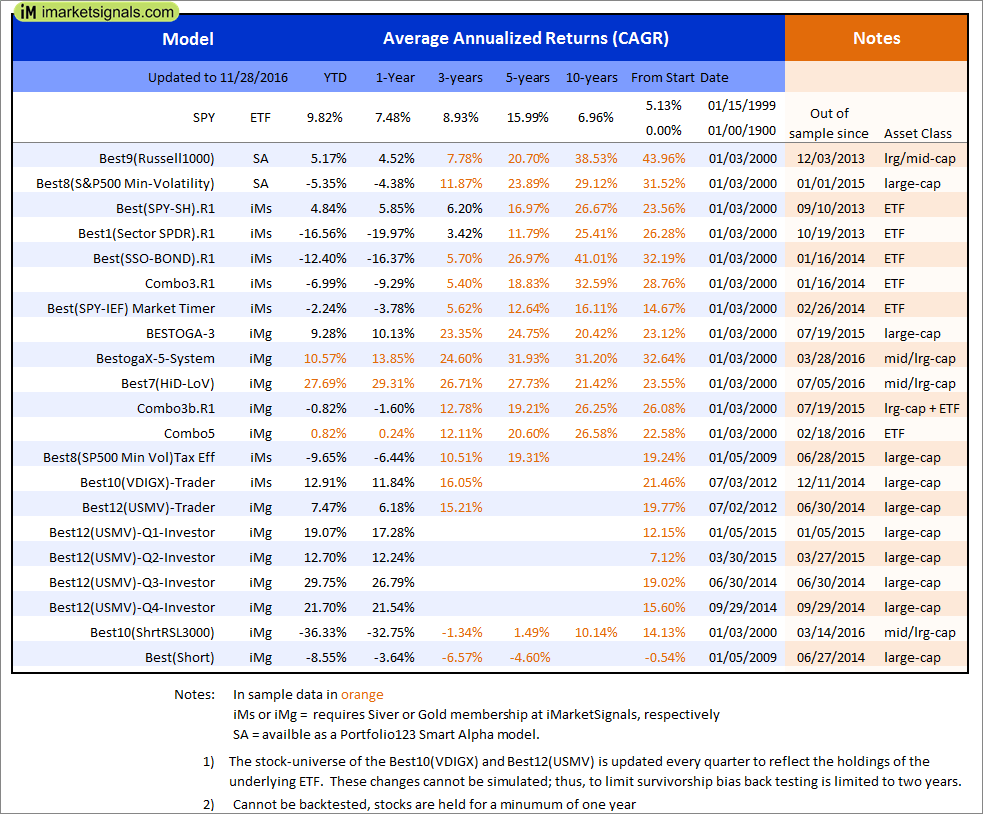
Out of sample performance summary of our models for the past 1, 2, 4 and 13 week periods. The active active return indicates how the models over- or underperformed the benchmark ETF SPY. Also the YTD, and the 1-, 3-, 5- and 10-year annualized returns are shown in the second table |
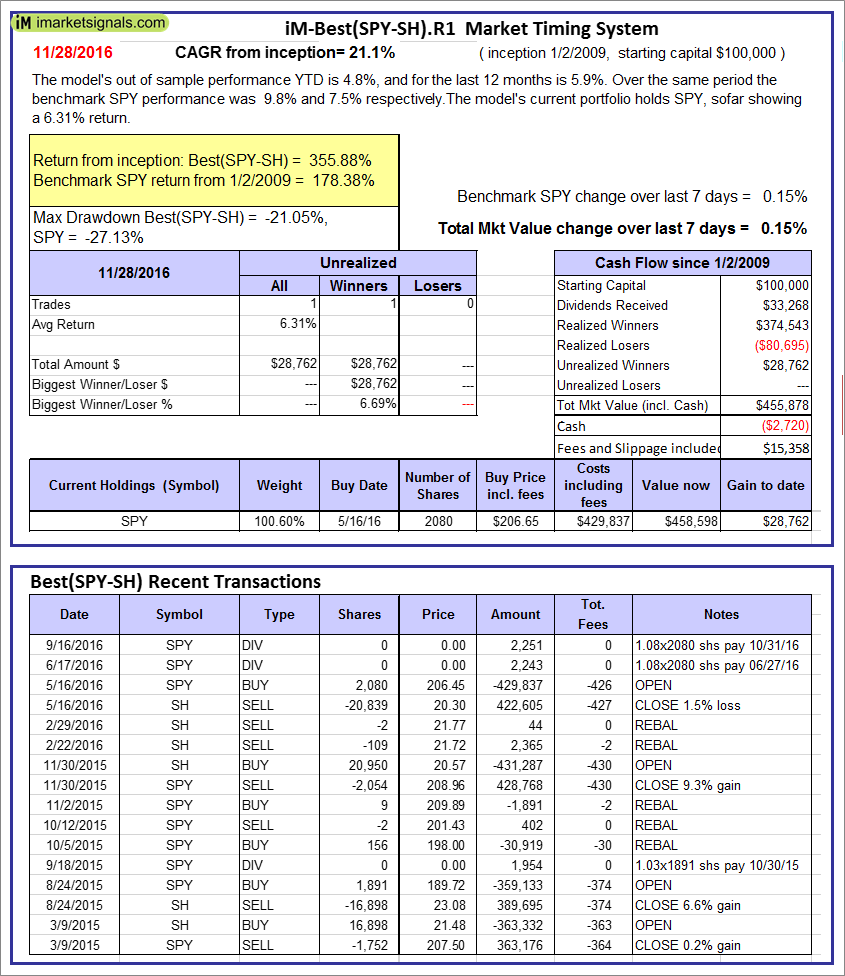 |
iM-Best(SPY-SH).R1: The model’s out of sample performance YTD is 4.8%, and for the last 12 months is 5.9%. Over the same period the benchmark SPY performance was 9.8% and 7.5% respectively. Over the previous week the market value of Best(SPY-SH) gained 0.15% at a time when SPY gained 0.15%. A starting capital of $100,000 at inception on 1/2/2009 would have grown to $455,878 which includes -$2,720 cash and excludes $15,358 spent on fees and slippage. |
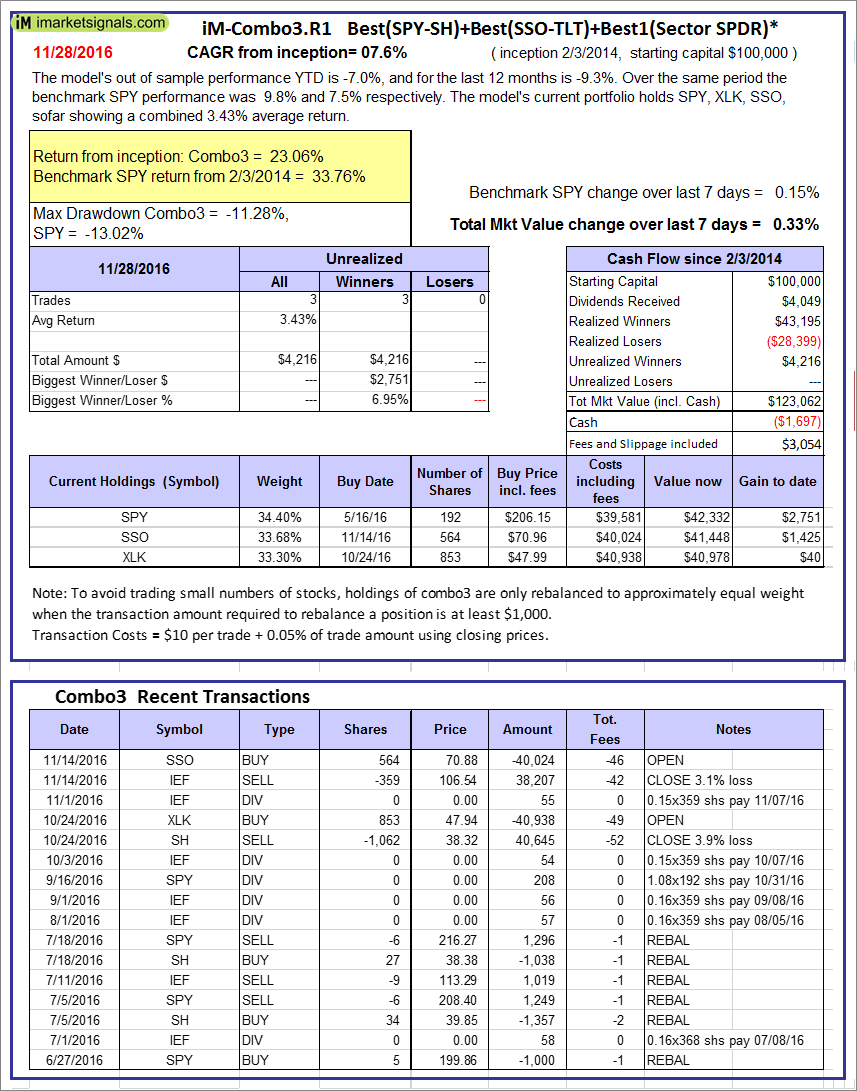 |
iM-Combo3.R1: The model’s out of sample performance YTD is -7.0%, and for the last 12 months is -9.3%. Over the same period the benchmark SPY performance was 9.8% and 7.5% respectively. Over the previous week the market value of iM-Combo3.R1 gained 0.33% at a time when SPY gained 0.15%. A starting capital of $100,000 at inception on 2/3/2014 would have grown to $123,062 which includes -$1,697 cash and excludes $3,054 spent on fees and slippage. |
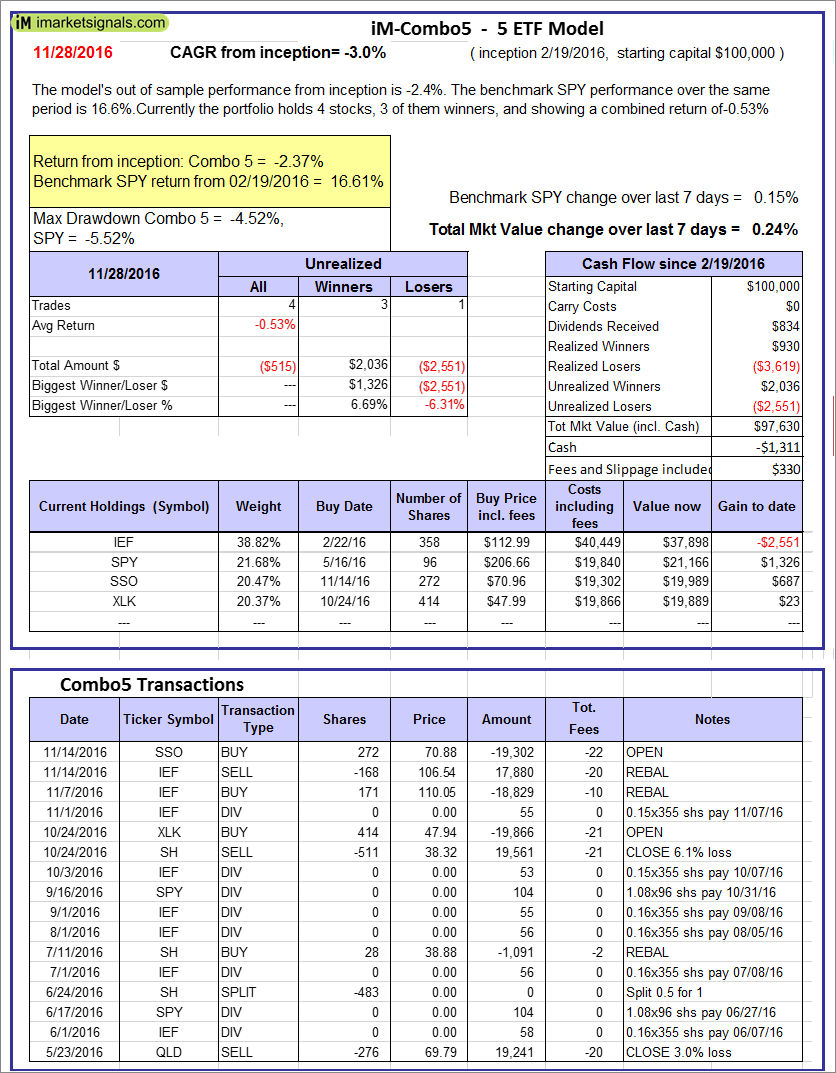 |
iM-Combo5: The model’s out of sample performance from inception is -2.4%. The benchmark SPY performance over the same period is 16.6%. Over the previous week the market value of iM-Combo5 gained 0.24% at a time when SPY gained 0.15%. A starting capital of $100,000 at inception on 2/22/2016 would have grown to $97,630 which includes -$1,311 cash and excludes $330 spent on fees and slippage. |
 |
The iM-Best8(S&P500 Min Vol)Tax-Efficient The model’s out of sample performance YTD is -9.6%, and for the last 12 months is -6.4%. Over the same period the benchmark SPY performance was 9.8% and 7.5% respectively. Over the previous week the market value of iM-Best8(S&P 500)Tax-Eff. gained 0.39% at a time when SPY gained 0.15%. A starting capital of $100,000 at inception on 1/2/2009 would have grown to $402,392 which includes $191,016 cash and excludes $7,763 spent on fees and slippage. |
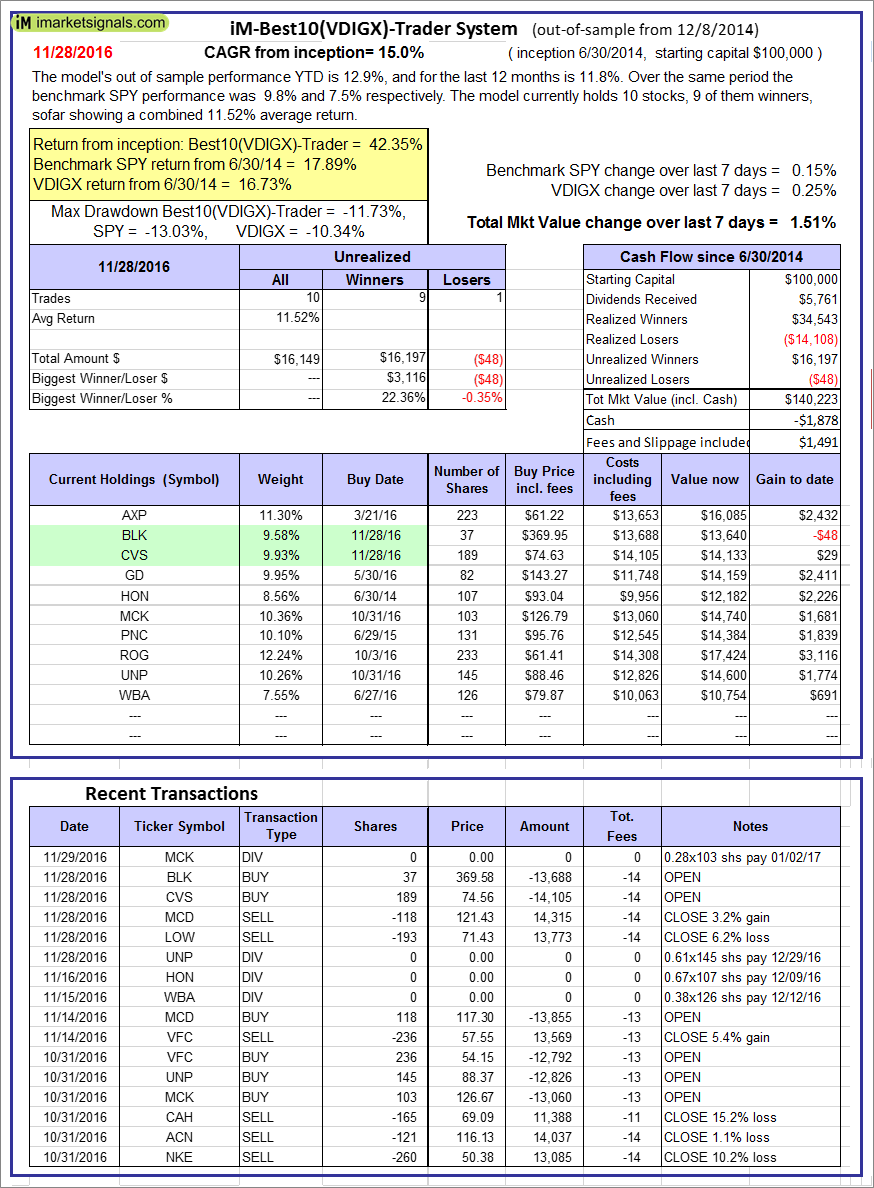 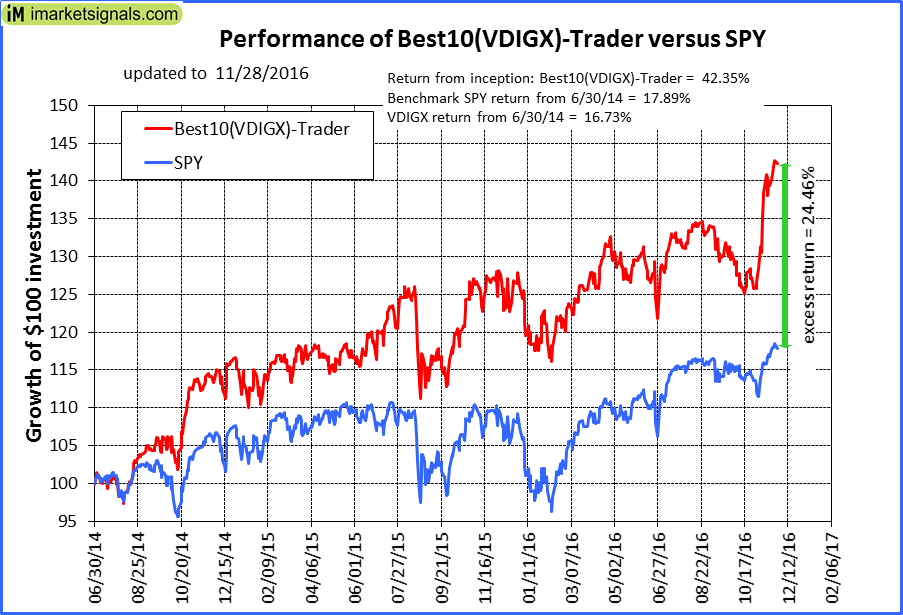 |
iM-Best10(VDIGX)-Trader: The model’s out of sample performance YTD is 12.9%, and for the last 12 months is 11.8%. Over the same period the benchmark SPY performance was 9.8% and 7.5% respectively. Since inception, on 7/1/2014, the model gained 42.35% while the benchmark SPY gained 17.89% and the ETF VDIGX gained 16.73% over the same period. Over the previous week the market value of iM-Best10(VDIGX) gained 1.51% at a time when SPY gained 0.15%. A starting capital of $100,000 at inception on 7/1/2014 would have grown to $140,223 which includes -$1,878 cash and excludes $1,491 spent on fees and slippage. |
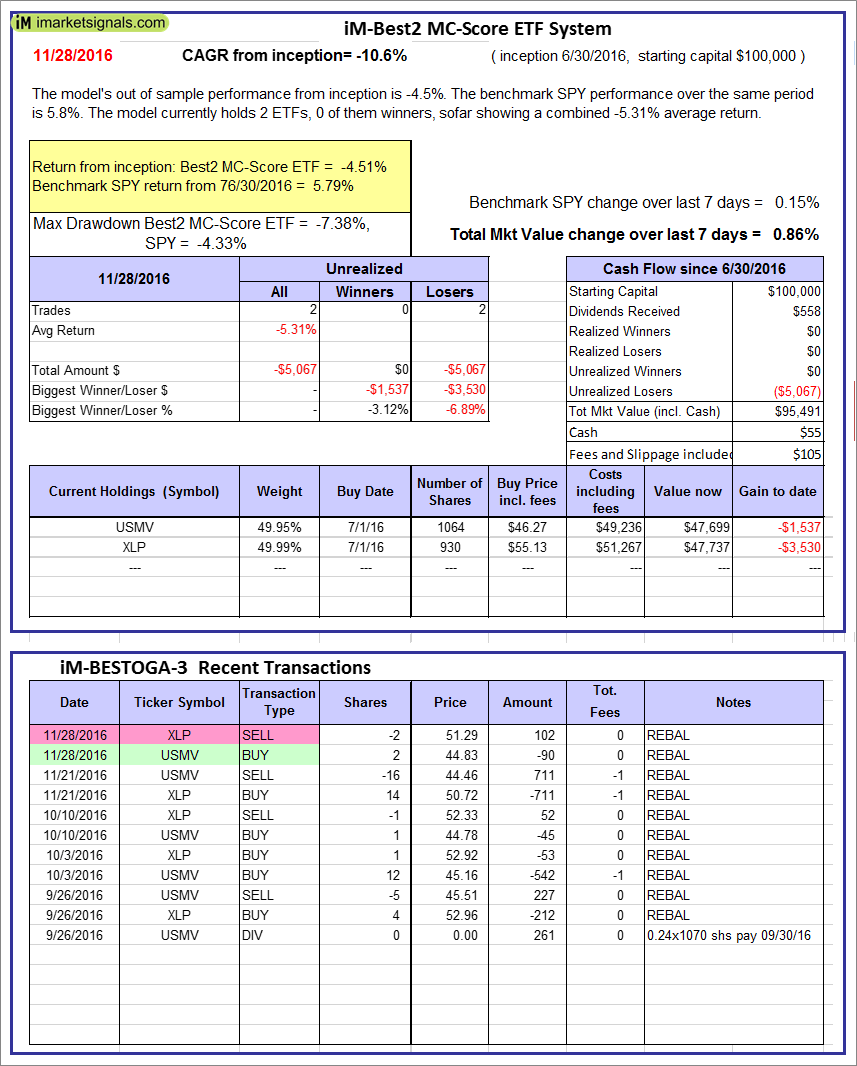 |
iM-Best2 MC-Score ETF System: The model’s out of sample performance from inception is -4.5%. The benchmark SPY performance over the same period is 5.8%. Over the previous week the market value of iM-BESTOGA-3 gained 0.86% at a time when SPY gained 0.15%. A starting capital of $100,000 at inception on 2/3/2014 would have grown to $55 which includes $105 cash and excludes Gain to date spent on fees and slippage. |
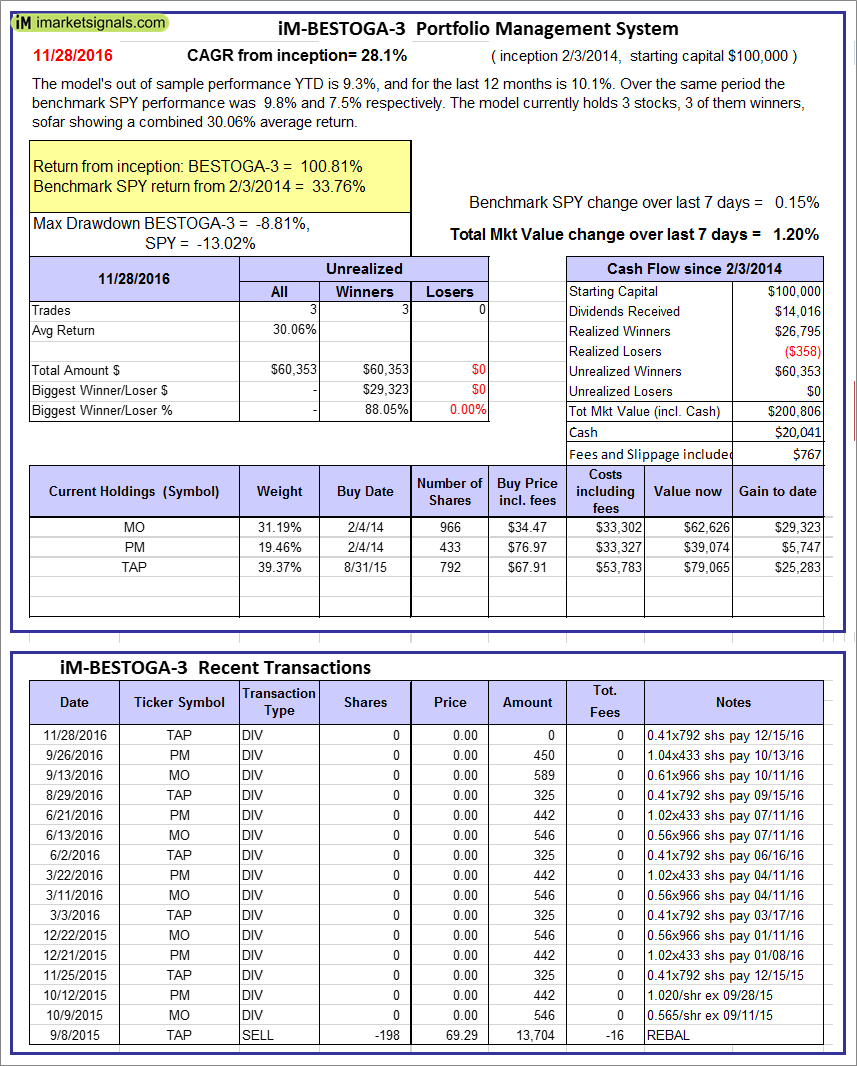 |
iM-BESTOGA-3: The model’s out of sample performance YTD is 9.3%, and for the last 12 months is 10.1%. Over the same period the benchmark SPY performance was 9.8% and 7.5% respectively. Over the previous week the market value of iM-BESTOGA-3 gained 1.20% at a time when SPY gained 0.15%. A starting capital of $100,000 at inception on 2/3/2014 would have grown to $200,806 which includes $20,041 cash and excludes $767 spent on fees and slippage. |
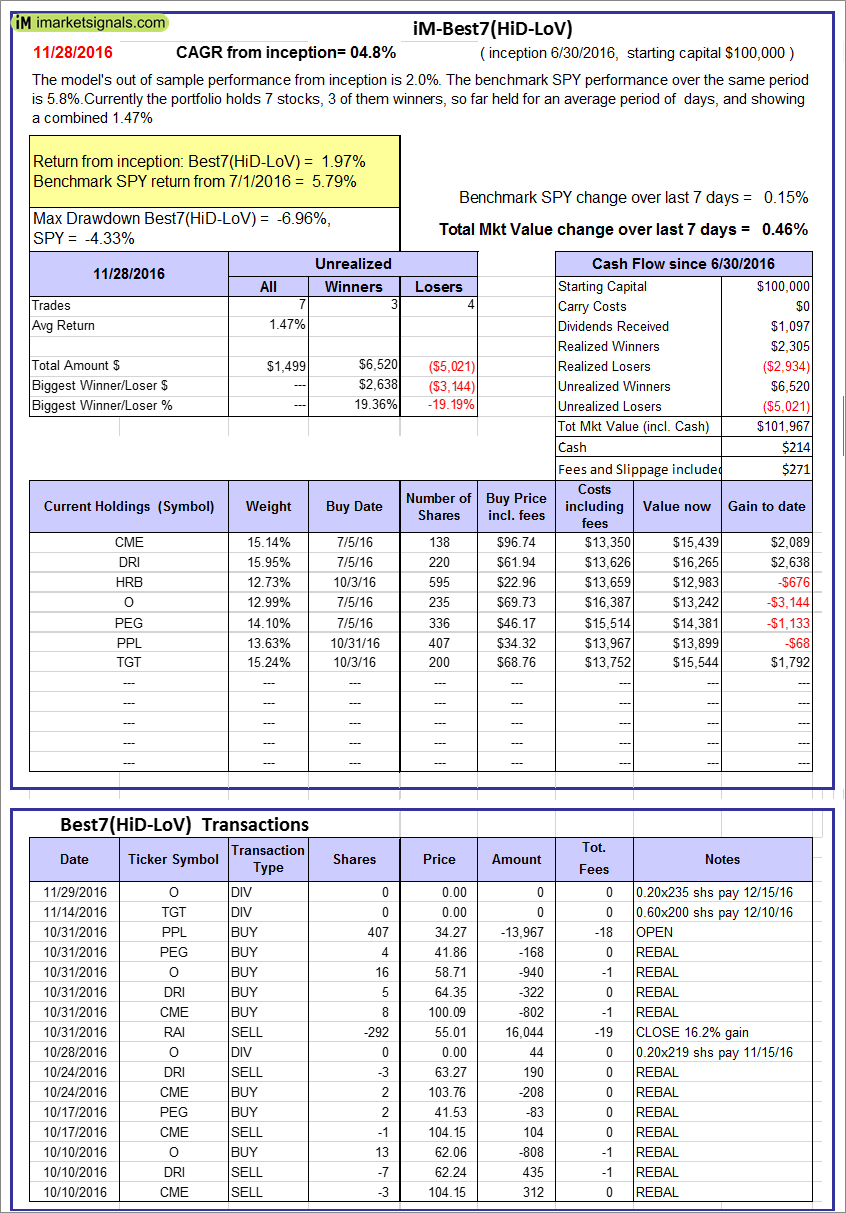 |
iM-Best7(HiD-LoV): The model’s out of sample performance from inception is 2.0%. The benchmark SPY performance over the same period is 5.8%. Over the previous week the market value of iM-BESTOGA-3 gained 0.46% at a time when SPY gained 0.15%. A starting capital of $100,000 at inception on 2/3/2014 would have grown to $101,967 which includes $214 cash and excludes $271 spent on fees and slippage. |
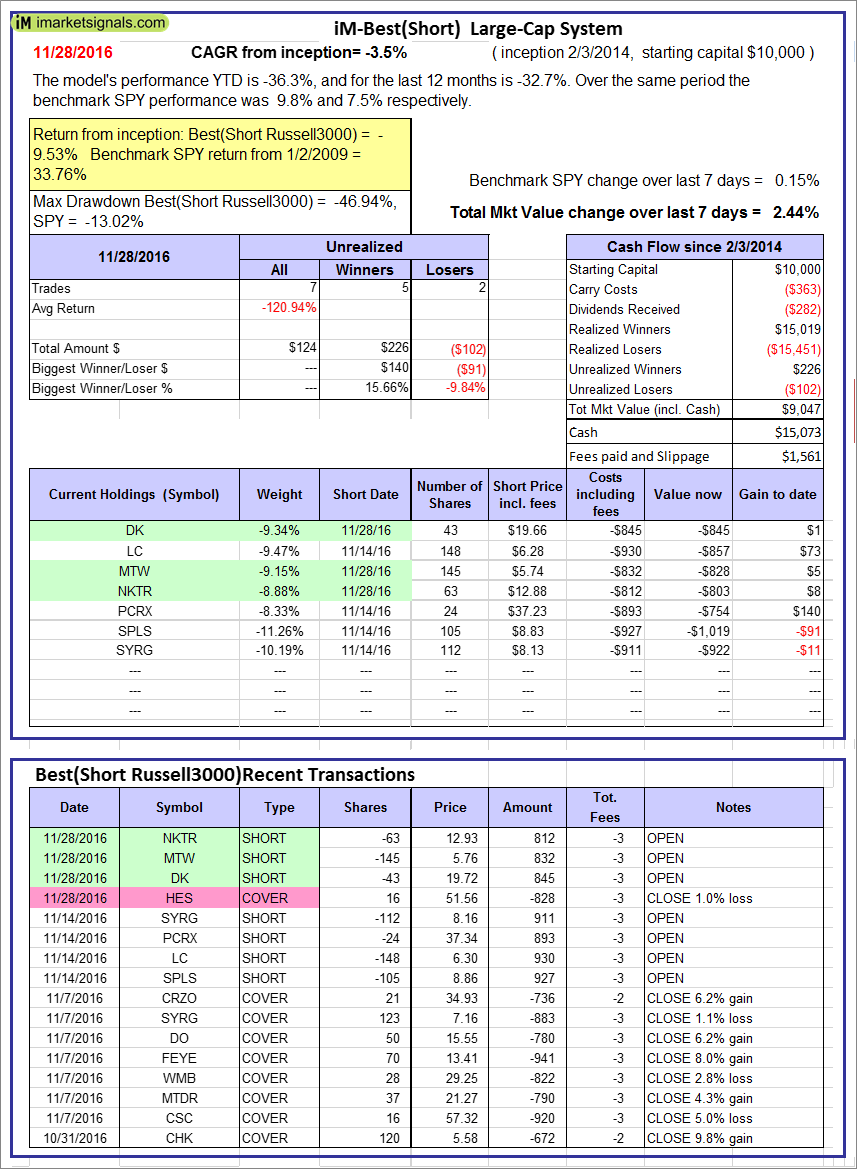 |
iM-Best10(Short Russell3000): The model’s performance YTD is -36.3%, and for the last 12 months is -32.7%. Over the same period the benchmark SPY performance was 9.8% and 7.5% respectively. Over the previous week the market value of iM-Best10(Short Russell3000) gained 2.44% at a time when SPY gained 0.15%. Over the period 2/3/2014 to 11/28/2016 the starting capital of $100,000 would have grown to $9,047 which includes $15,073 cash and excludes $1,561 spent on fees and slippage. |
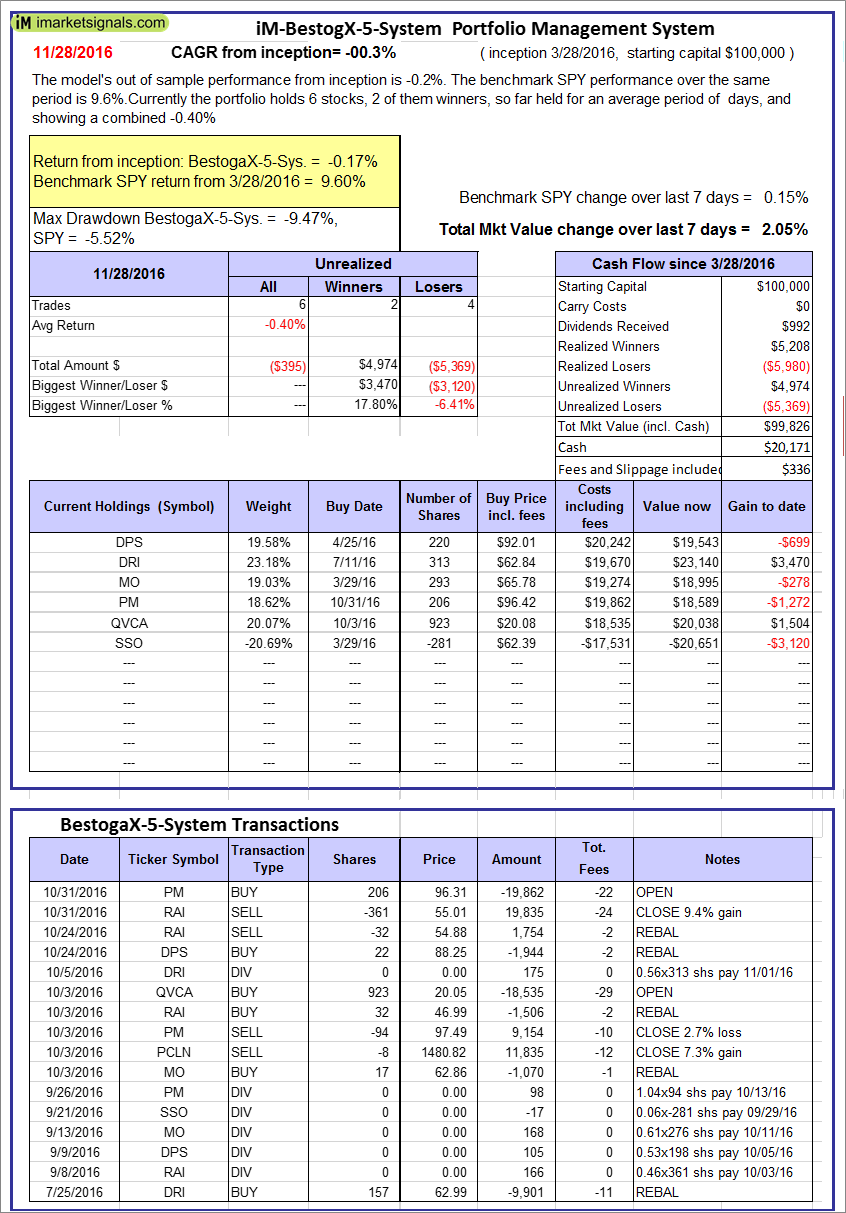 |
iM-BestogaX5-System: The model’s out of sample performance from inception is -0.2%. The benchmark SPY performance over the same period is 9.6%. Over the previous week the market value of iM-Best8(S&P 500)Tax-Eff. gained 2.05% at a time when SPY gained 0.15%. A starting capital of $100,000 at inception on 1/2/2009 would have grown to $99,826 which includes $20,171 cash and excludes $336 spent on fees and slippage. |
 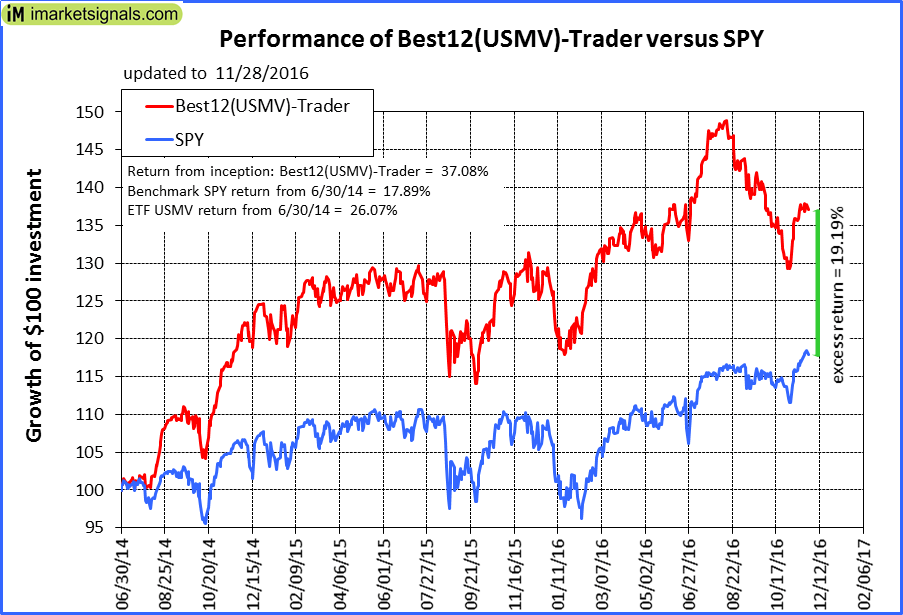 |
iM-Best12(USMV)-Trader: The model’s out of sample performance YTD is 7.5%, and for the last 12 months is 6.2%. Over the same period the benchmark SPY performance was 9.8% and 7.5% respectively. Since inception, on 7/1/2014, the model gained 37.08% while the benchmark SPY gained 17.89% and the ETF USMV gained 26.07% over the same period. Over the previous week the market value of iM-Best12(USMV)-Trader gained -0.23% at a time when SPY gained 0.15%. A starting capital of $100,000 at inception on 7/1/2014 would have grown to $137,077 which includes $34 cash and excludes $2,587 spent on fees and slippage. |
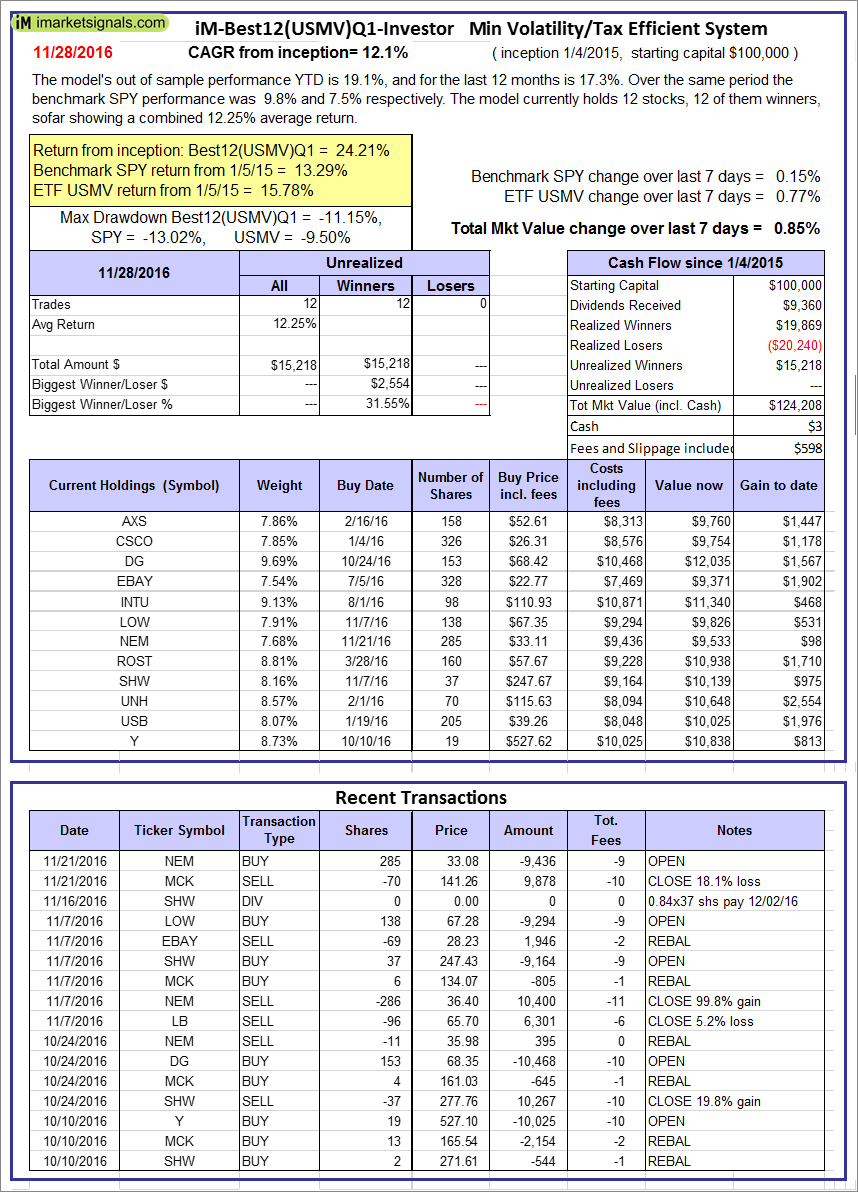 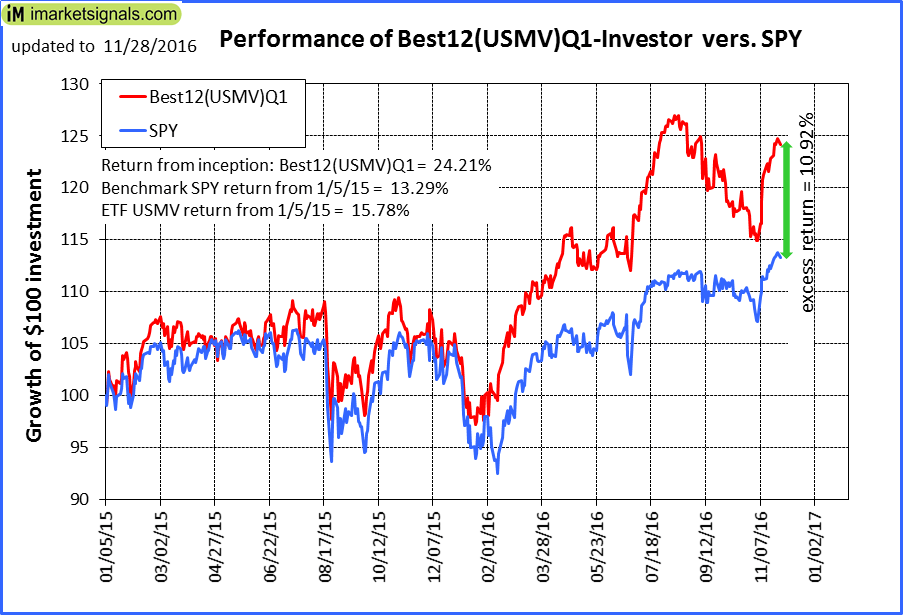 |
iM-Best12(USMV)Q1-Investor: The model’s out of sample performance YTD is 19.1%, and for the last 12 months is 17.3%. Over the same period the benchmark SPY performance was 9.8% and 7.5% respectively. Since inception, on 1/5/2015, the model gained 24.21% while the benchmark SPY gained 13.29% and the ETF USMV gained 15.78% over the same period. Over the previous week the market value of iM-Best12(USMV)Q1 gained 0.85% at a time when SPY gained 0.15%. A starting capital of $100,000 at inception on 1/5/2015 would have grown to $124,208 which includes $3 cash and excludes $598 spent on fees and slippage. |
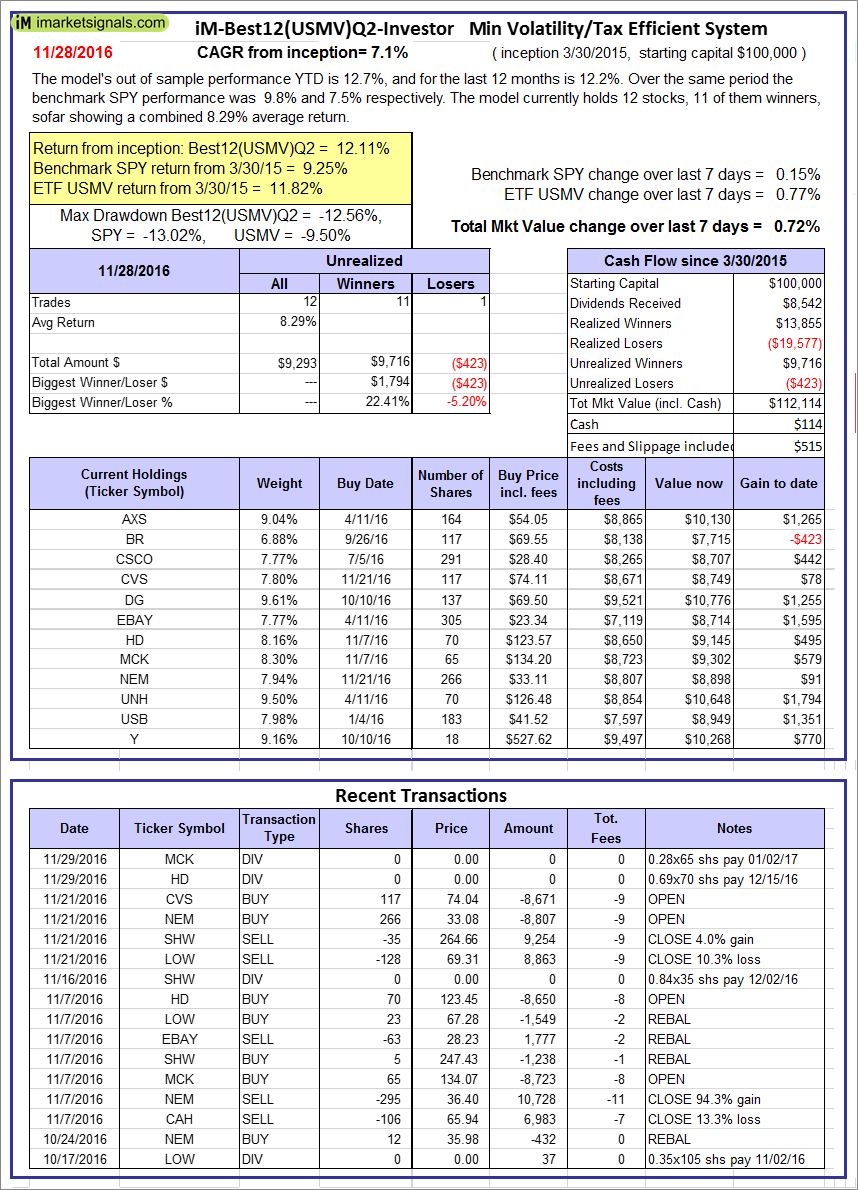 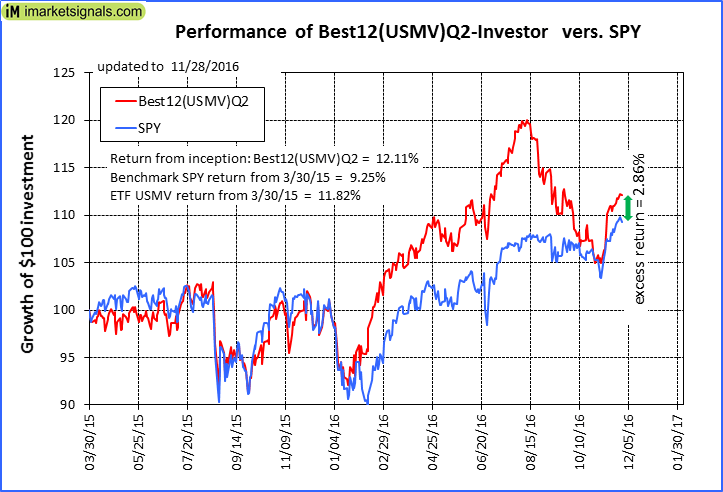 |
iM-Best12(USMV)Q2-Investor: The model’s out of sample performance YTD is 12.7%, and for the last 12 months is 12.2%. Over the same period the benchmark SPY performance was 9.8% and 7.5% respectively. Since inception, on 3/31/2015, the model gained 12.11% while the benchmark SPY gained 9.25% and the ETF USMV gained 11.82% over the same period. Over the previous week the market value of iM-Best12(USMV)Q2 gained 0.72% at a time when SPY gained 0.15%. A starting capital of $100,000 at inception on 3/31/2015 would have grown to $112,114 which includes $114 cash and excludes $515 spent on fees and slippage. |
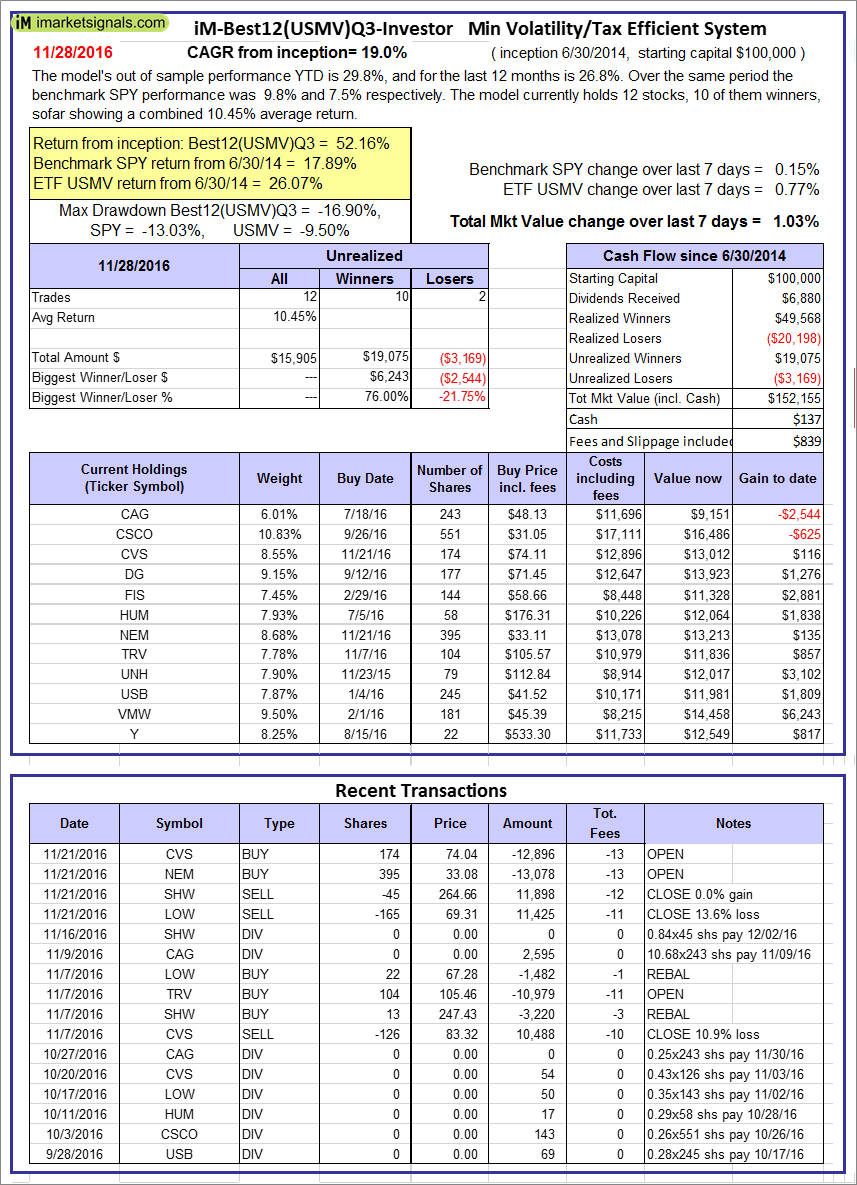 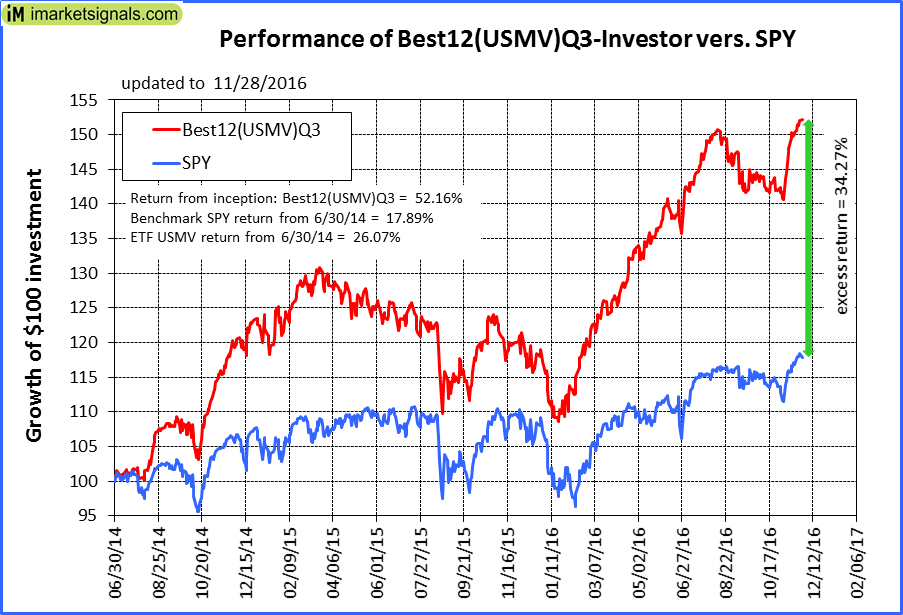 |
iM-Best12(USMV)Q3-Investor: The model’s out of sample performance YTD is 29.8%, and for the last 12 months is 26.8%. Over the same period the benchmark SPY performance was 9.8% and 7.5% respectively. Since inception, on 7/1/2014, the model gained 52.16% while the benchmark SPY gained 17.89% and the ETF USMV gained 26.07% over the same period. Over the previous week the market value of iM-Best12(USMV)Q3 gained 1.03% at a time when SPY gained 0.15%. A starting capital of $100,000 at inception on 7/1/2014 would have grown to $152,155 which includes $137 cash and excludes $839 spent on fees and slippage. |
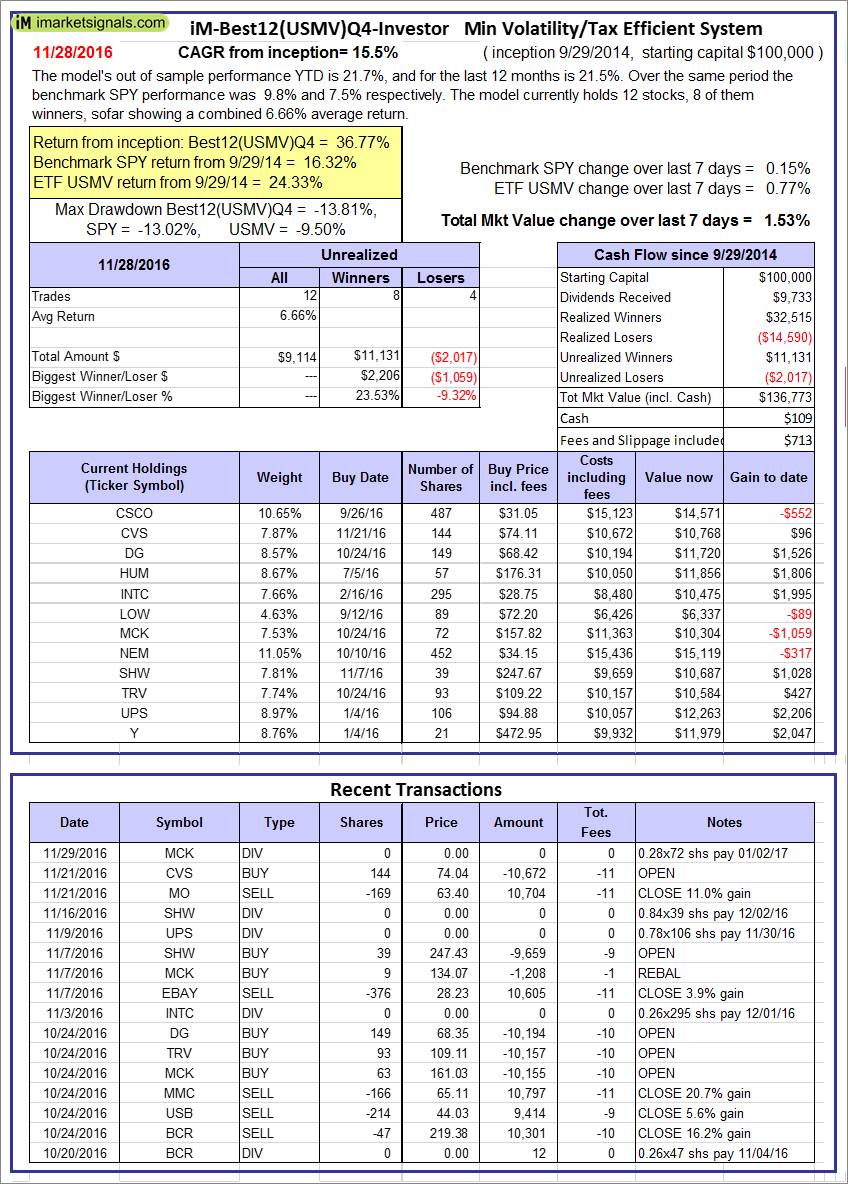 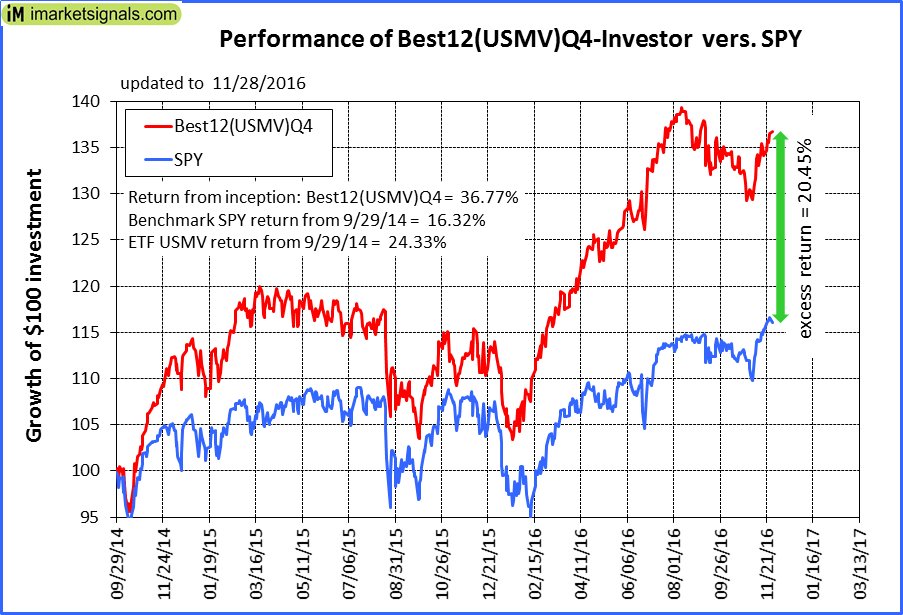 |
iM-Best12(USMV)Q4-Investor: Since inception, on 9/30/2014, the model gained 36.77% while the benchmark SPY gained 16.32% and the ETF USMV gained 24.33% over the same period. Over the previous week the market value of iM-Best12(USMV)Q4 gained 1.53% at a time when SPY gained 0.15%. A starting capital of $100,000 at inception on 9/30/2014 would have grown to $136,773 which includes $109 cash and excludes $713 spent on fees and slippage. |
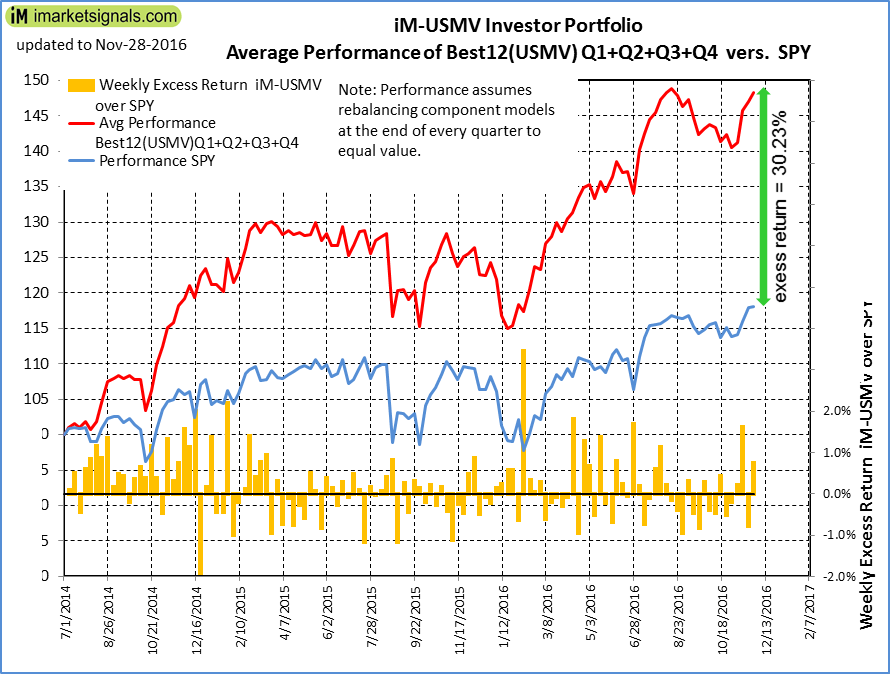 |
Average Performance of iM-Best12(USMV)Q1+Q2+Q3+Q4-Investor resulted in an excess return of 30.23% over SPY. (see iM-USMV Investor Portfolio) |
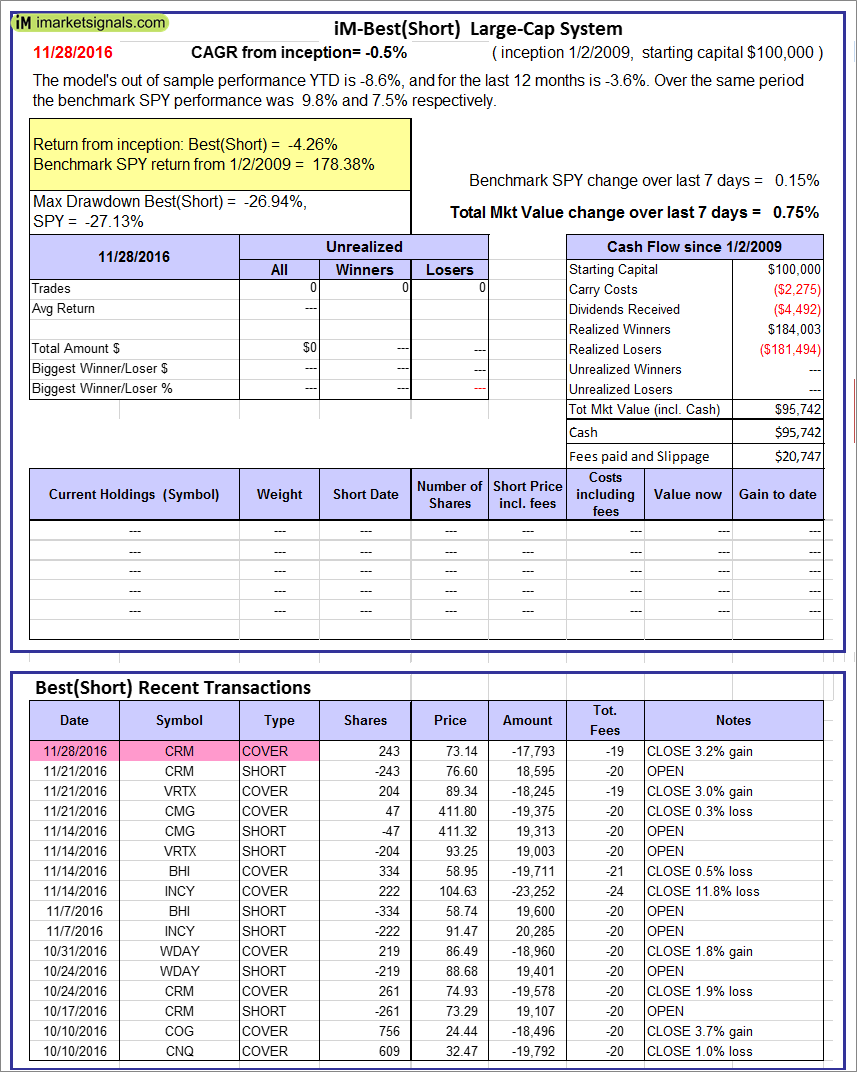 |
iM-Best(Short): The model’s out of sample performance YTD is -8.6%, and for the last 12 months is -3.6%. Over the same period the benchmark SPY performance was 9.8% and 7.5% respectively. Over the previous week the market value of iM-Best(Short) gained 0.75% at a time when SPY gained 0.15%. Over the period 1/2/2009 to 11/28/2016 the starting capital of $100,000 would have grown to $95,742 which includes $95,742 cash and excludes $20,747 spent on fees and slippage. |
iM-Best Reports – 11/28/2016
Posted in pmp SPY-SH
Leave a Reply
You must be logged in to post a comment.