
  |
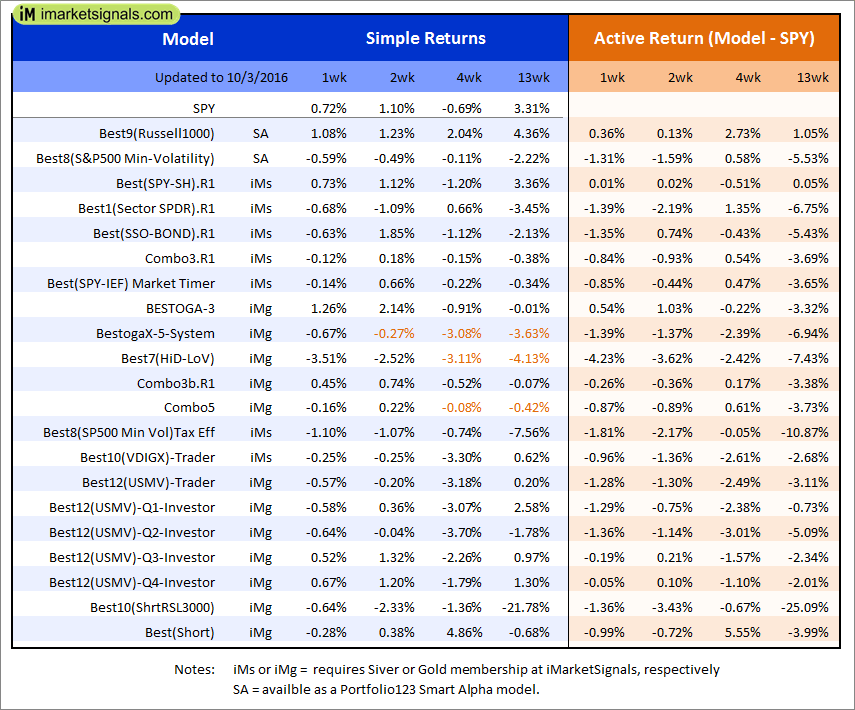
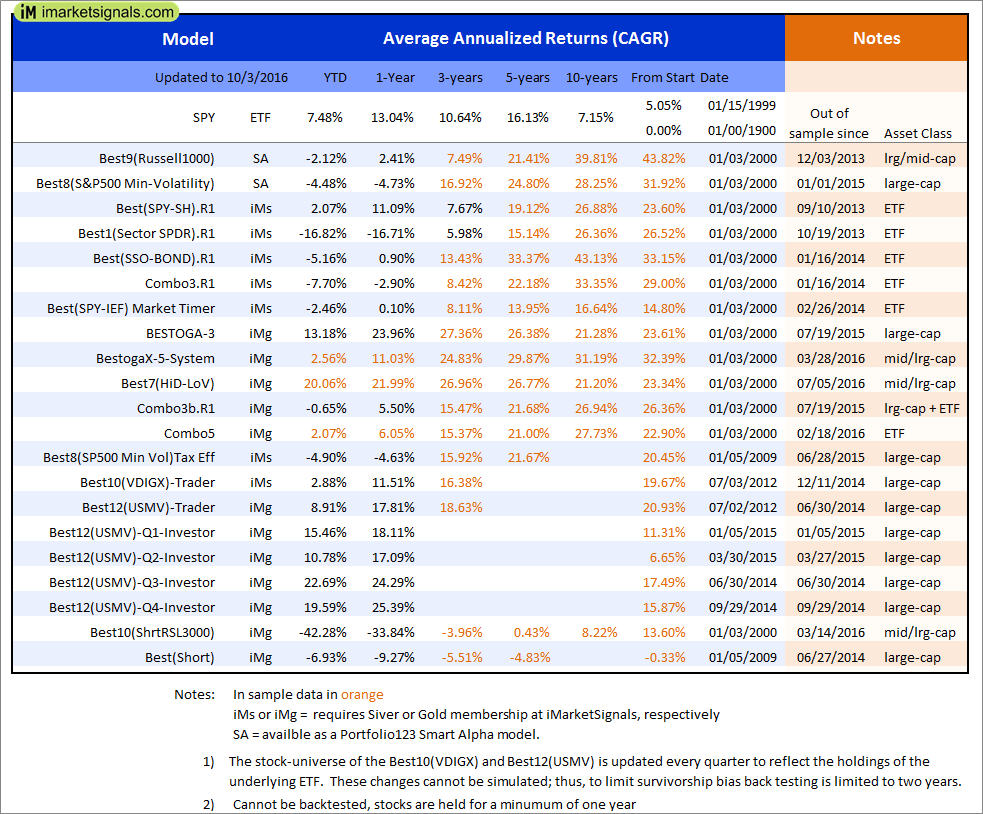
Out of sample performance summary of our models for the past 1, 2, 4 and 13 week periods. The active active return indicates how the models over- or underperformed the benchmark ETF SPY. Also the YTD, and the 1-, 3-, 5- and 10-year annualized returns are shown in the second table |
 |
iM-Best(SPY-SH).R1: The model’s out of sample performance YTD is 2.1%, and for the last 12 months is 11.1%. Over the same period the benchmark SPY performance was 7.5% and 13.0% respectively. Over the previous week the market value of Best(SPY-SH) gained 0.73% at a time when SPY gained 0.72%. A starting capital of $100,000 at inception on 1/2/2009 would have grown to $443,851 which includes -$4,971 cash and excludes $15,358 spent on fees and slippage. |
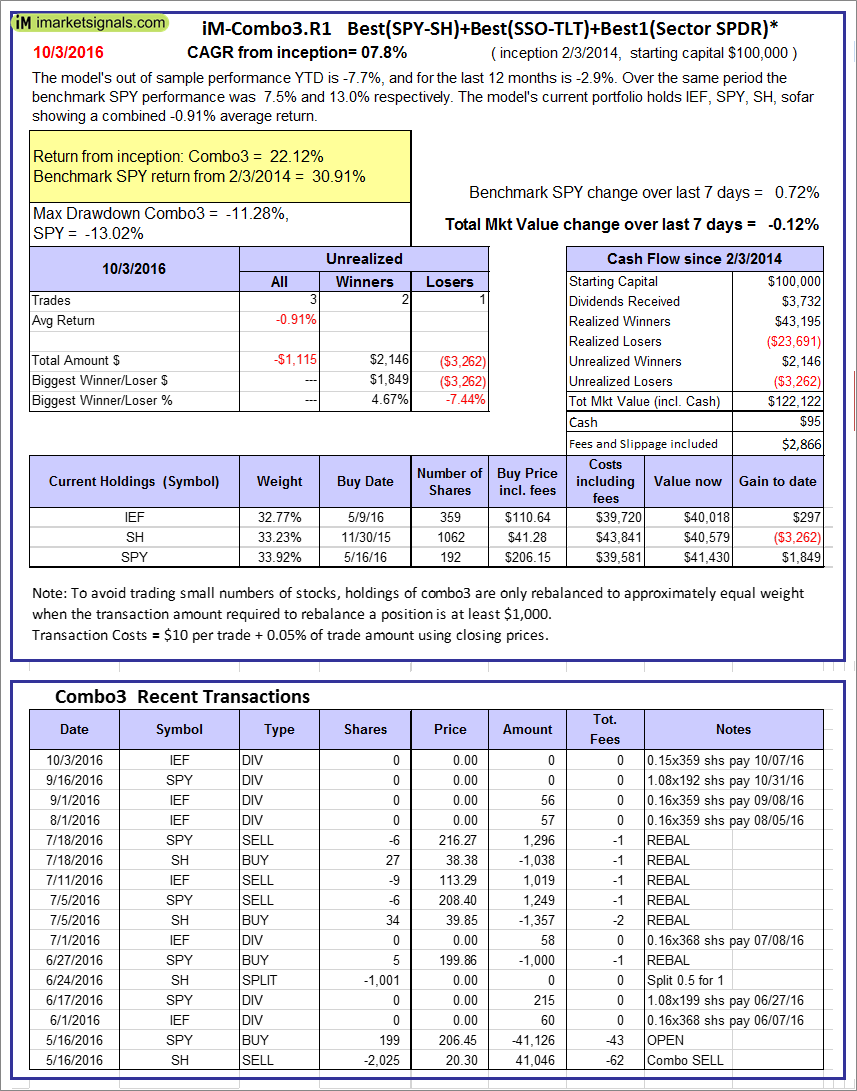 |
iM-Combo3.R1: The model’s out of sample performance YTD is -7.7%, and for the last 12 months is -2.9%. Over the same period the benchmark SPY performance was 7.5% and 13.0% respectively. Over the previous week the market value of iM-Combo3.R1 gained -0.12% at a time when SPY gained 0.72%. A starting capital of $100,000 at inception on 2/3/2014 would have grown to $122,122 which includes $95 cash and excludes $2,866 spent on fees and slippage. |
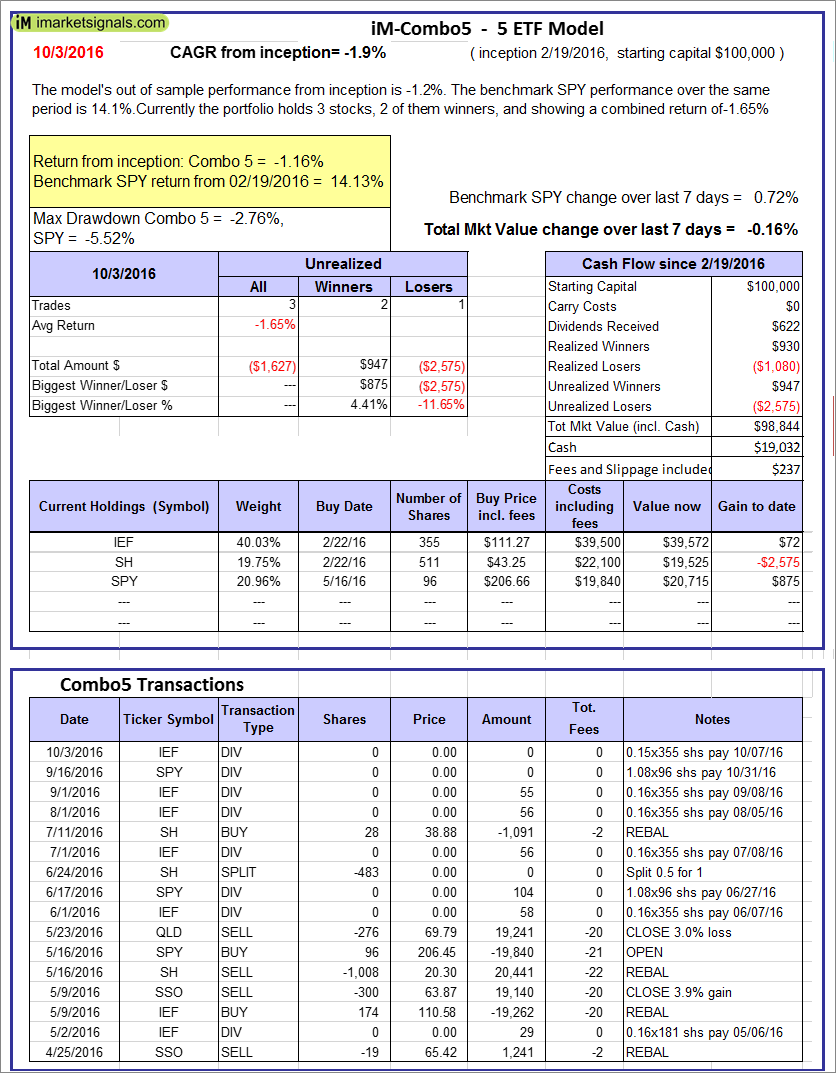 |
iM-Combo5: The model’s out of sample performance from inception is -1.2%. The benchmark SPY performance over the same period is 14.1%. Over the previous week the market value of iM-Combo5 gained -0.16% at a time when SPY gained 0.72%. A starting capital of $100,000 at inception on 2/22/2016 would have grown to $98,844 which includes $19,032 cash and excludes $237 spent on fees and slippage. |
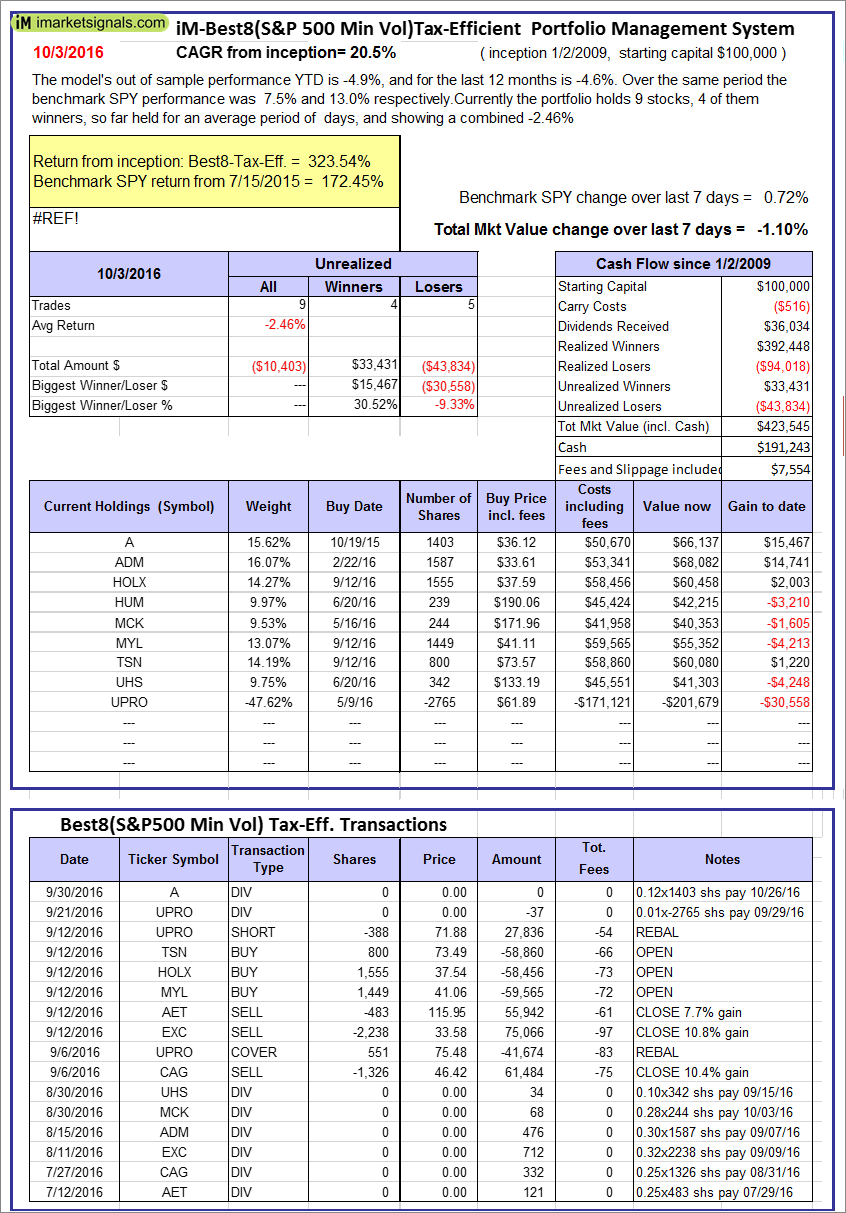 |
The iM-Best8(S&P500 Min Vol)Tax-Efficient The model’s out of sample performance YTD is -4.9%, and for the last 12 months is -4.6%. Over the same period the benchmark SPY performance was 7.5% and 13.0% respectively. Over the previous week the market value of iM-Best8(S&P 500)Tax-Eff. gained -1.10% at a time when SPY gained 0.72%. A starting capital of $100,000 at inception on 1/2/2009 would have grown to $423,545 which includes $191,243 cash and excludes $7,554 spent on fees and slippage. |
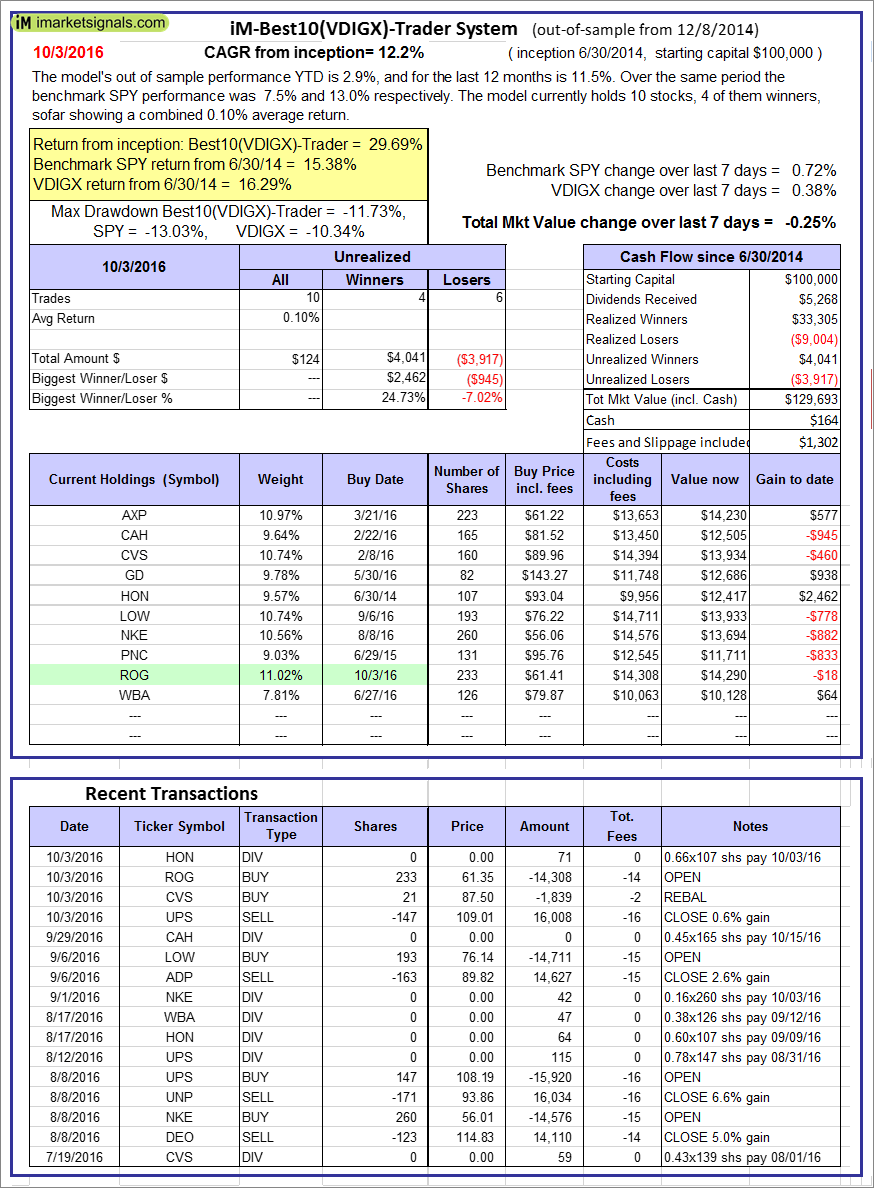  |
iM-Best10(VDIGX)-Trader: The model’s out of sample performance YTD is 2.9%, and for the last 12 months is 11.5%. Over the same period the benchmark SPY performance was 7.5% and 13.0% respectively. Since inception, on 7/1/2014, the model gained 29.69% while the benchmark SPY gained 15.38% and the ETF VDIGX gained 16.29% over the same period. Over the previous week the market value of iM-Best10(VDIGX) gained -0.25% at a time when SPY gained 0.72%. A starting capital of $100,000 at inception on 7/1/2014 would have grown to $129,693 which includes $164 cash and excludes $1,302 spent on fees and slippage. |
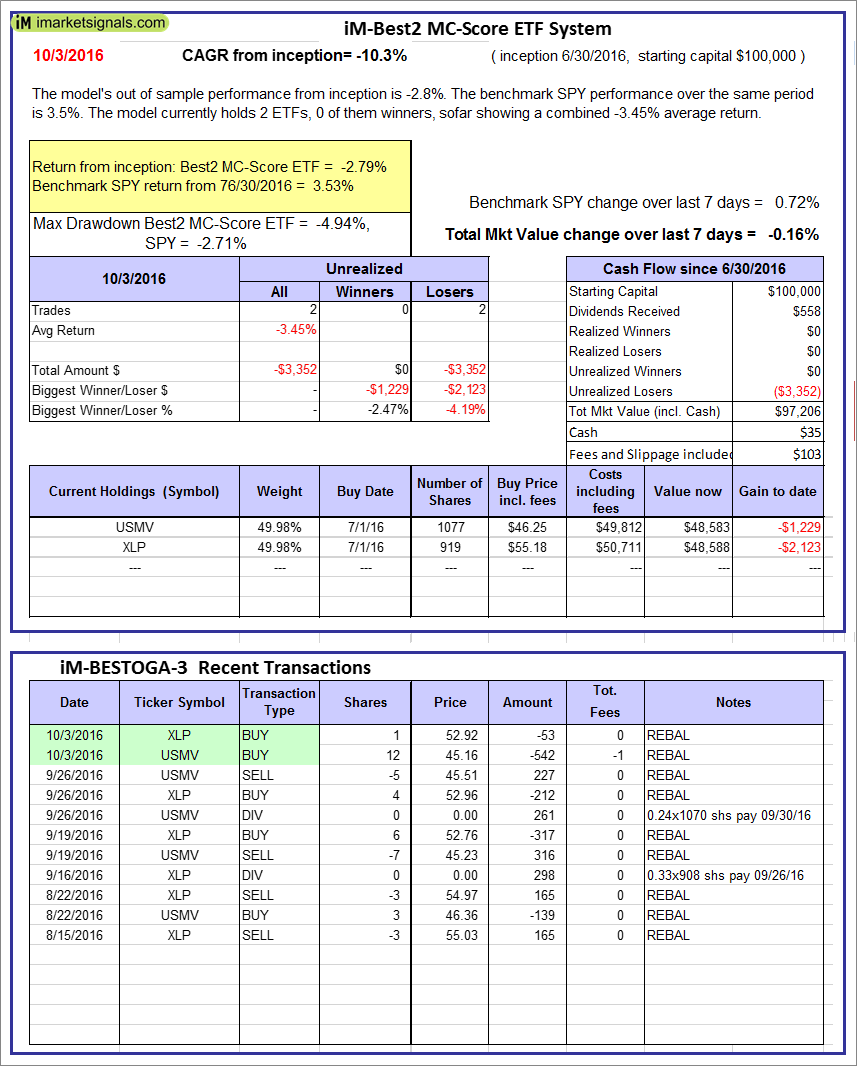 |
iM-Best2 MC-Score ETF System: The model’s out of sample performance from inception is -2.8%. The benchmark SPY performance over the same period is 3.5%. Over the previous week the market value of iM-BESTOGA-3 gained -0.16% at a time when SPY gained 0.72%. A starting capital of $100,000 at inception on 2/3/2014 would have grown to $35 which includes $103 cash and excludes Gain to date spent on fees and slippage. |
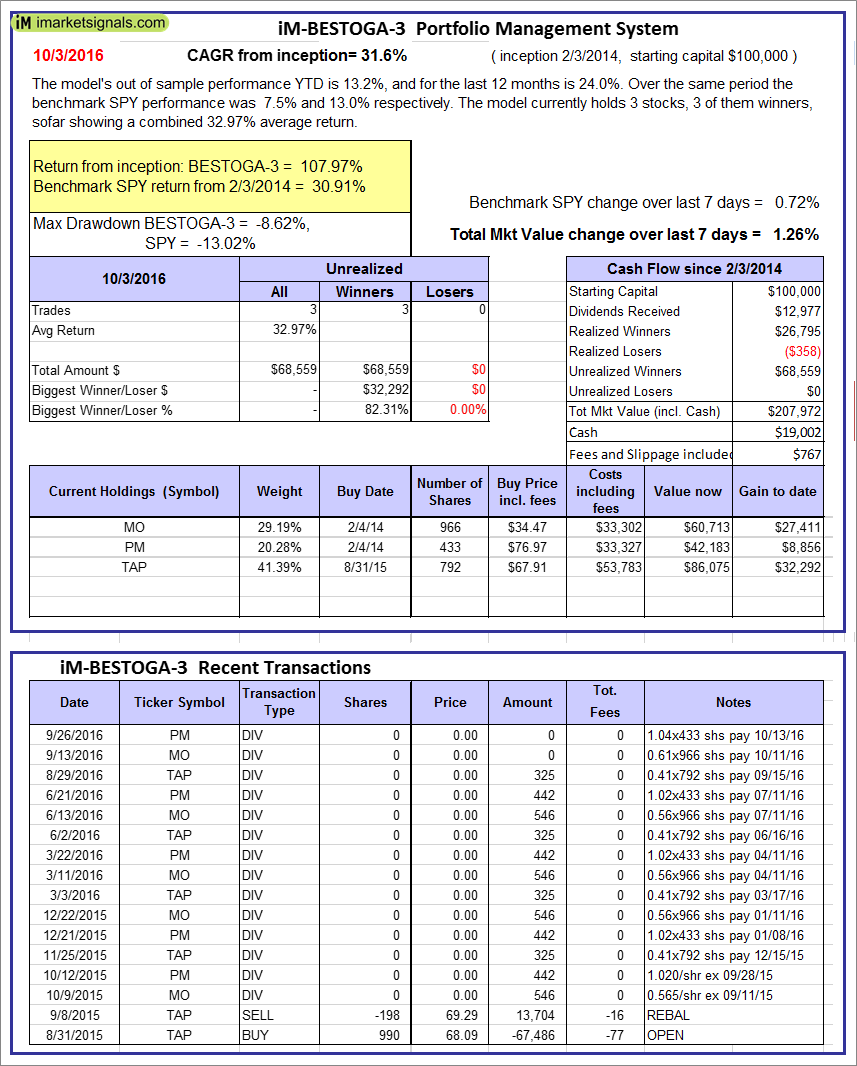 |
iM-BESTOGA-3: The model’s out of sample performance YTD is 13.2%, and for the last 12 months is 24.0%. Over the same period the benchmark SPY performance was 7.5% and 13.0% respectively. Over the previous week the market value of iM-BESTOGA-3 gained 1.26% at a time when SPY gained 0.72%. A starting capital of $100,000 at inception on 2/3/2014 would have grown to $207,972 which includes $19,002 cash and excludes $767 spent on fees and slippage. |
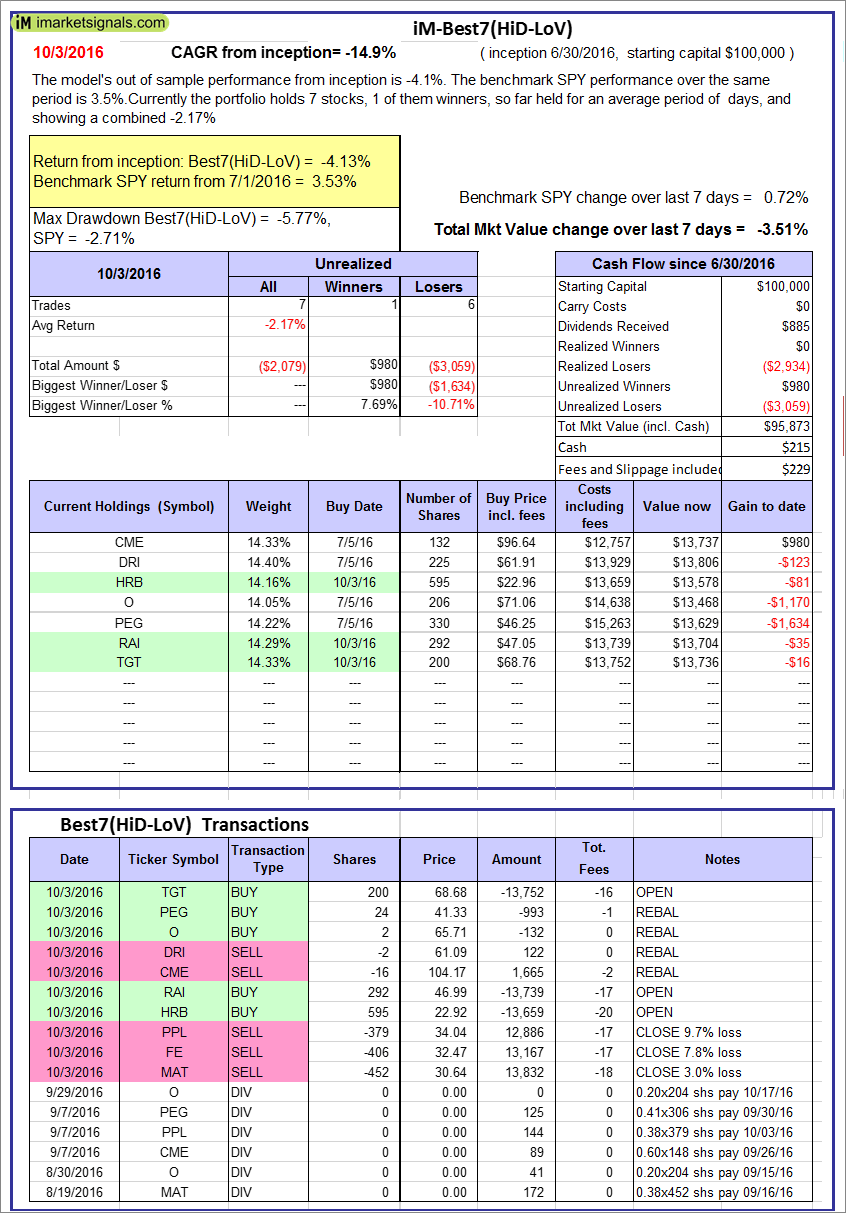 |
iM-Best7(HiD-LoV): The model’s out of sample performance from inception is -4.1%. The benchmark SPY performance over the same period is 3.5%. Over the previous week the market value of iM-BESTOGA-3 gained -3.51% at a time when SPY gained 0.72%. A starting capital of $100,000 at inception on 2/3/2014 would have grown to $95,873 which includes $215 cash and excludes $229 spent on fees and slippage. |
 |
iM-Best10(Short Russell3000): The model’s performance YTD is -42.3%, and for the last 12 months is -33.8%. Over the same period the benchmark SPY performance was 7.5% and 13.0% respectively. Over the previous week the market value of iM-Best10(Short Russell3000) gained -0.64% at a time when SPY gained 0.72%. Over the period 2/3/2014 to 10/3/2016 the starting capital of $100,000 would have grown to $8,201 which includes $15,589 cash and excludes $1,482 spent on fees and slippage. |
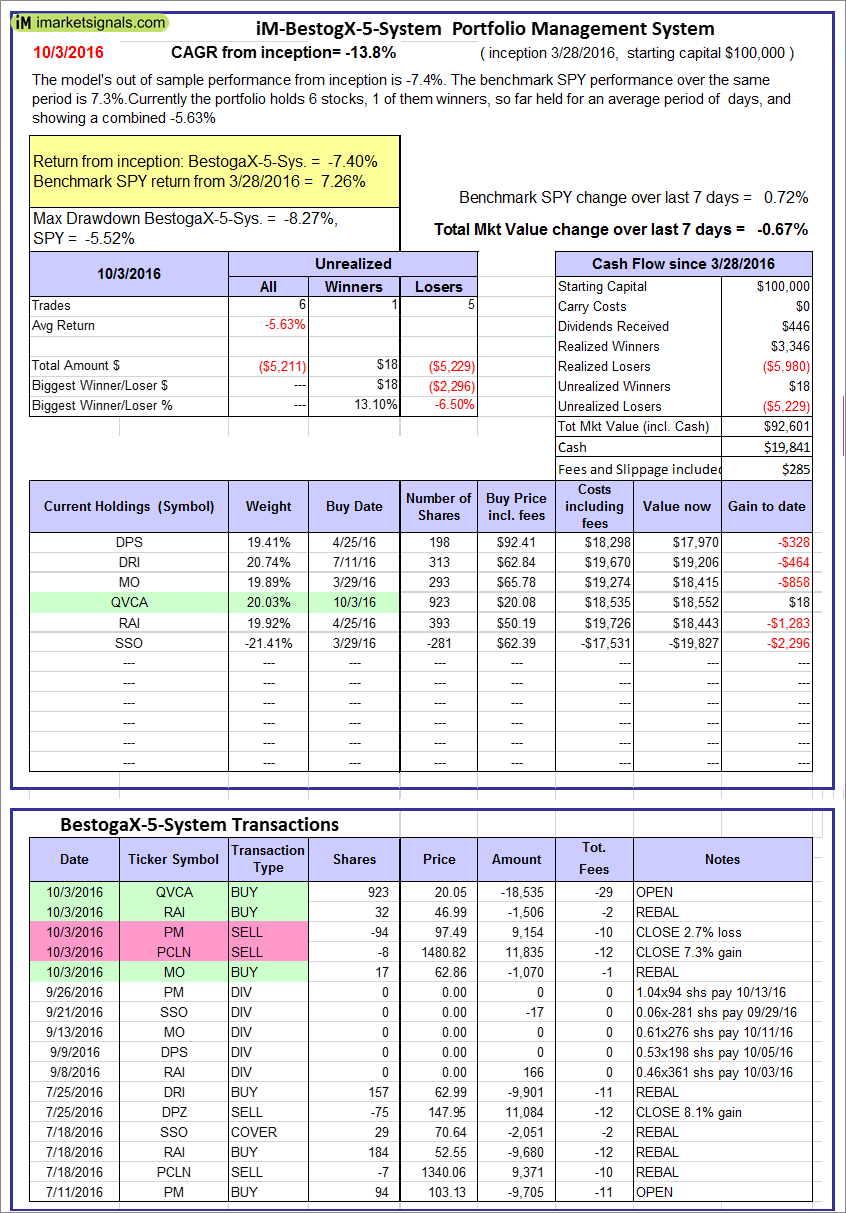 |
iM-BestogaX5-System: The model’s out of sample performance from inception is -7.4%. The benchmark SPY performance over the same period is 7.3%. Over the previous week the market value of iM-Best8(S&P 500)Tax-Eff. gained -0.67% at a time when SPY gained 0.72%. A starting capital of $100,000 at inception on 1/2/2009 would have grown to $92,601 which includes $19,841 cash and excludes $285 spent on fees and slippage. |
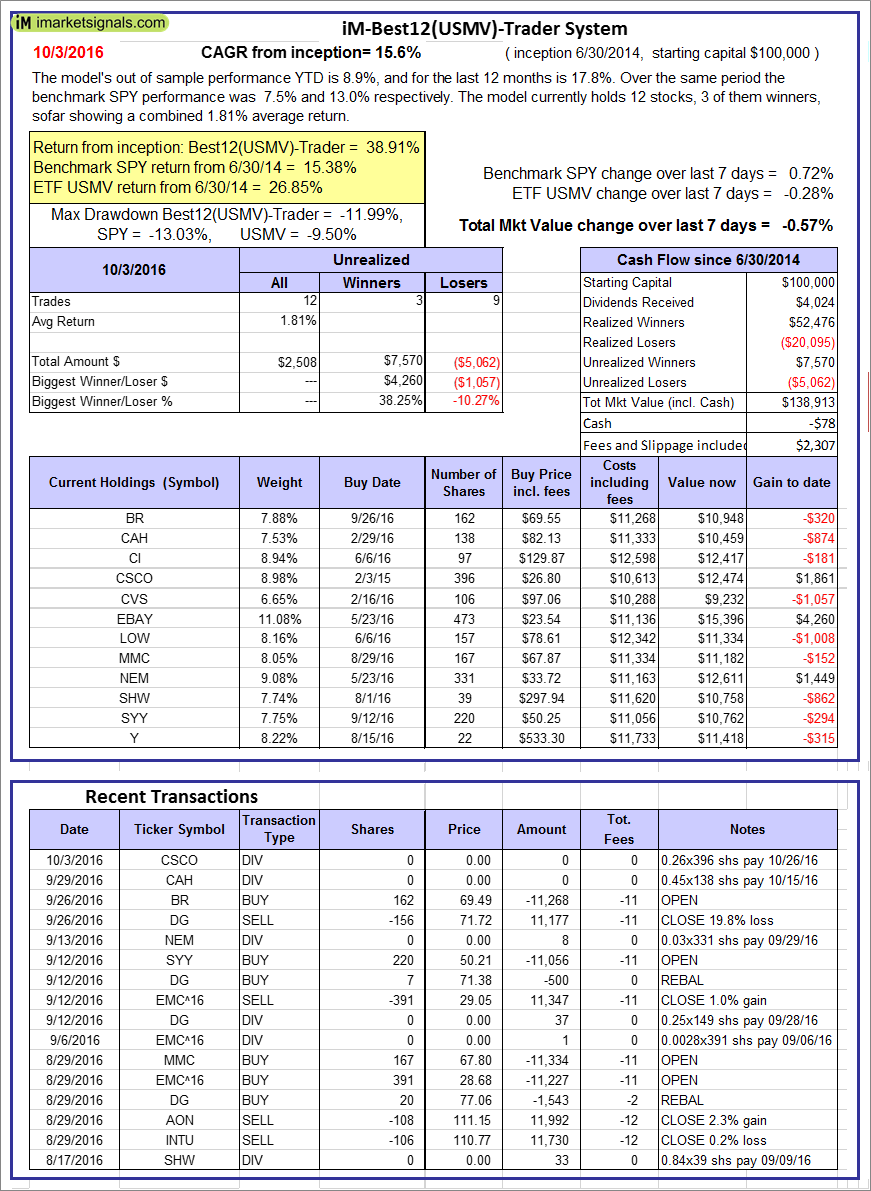 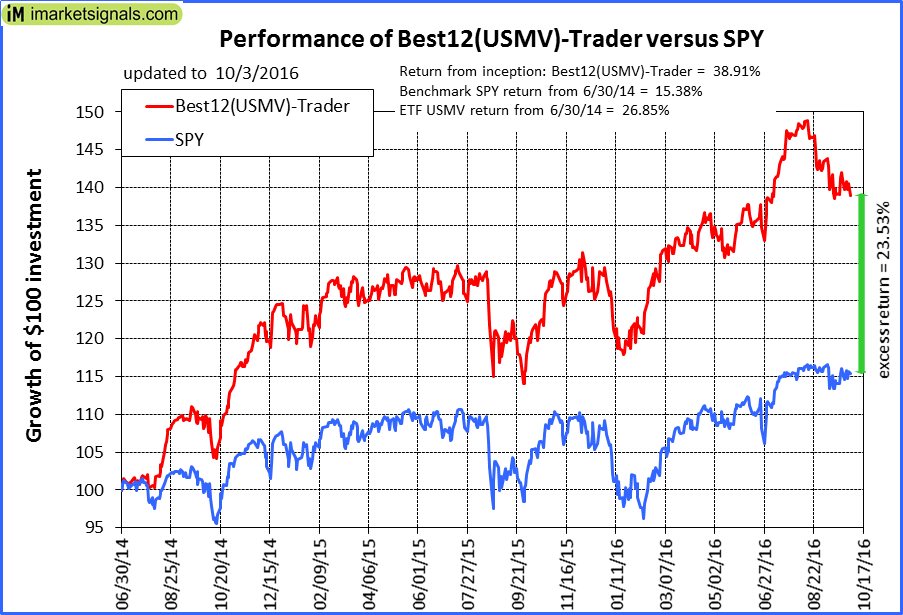 |
iM-Best12(USMV)-Trader: The model’s out of sample performance YTD is 8.9%, and for the last 12 months is 17.8%. Over the same period the benchmark SPY performance was 7.5% and 13.0% respectively. Since inception, on 7/1/2014, the model gained 38.91% while the benchmark SPY gained 15.38% and the ETF USMV gained 26.85% over the same period. Over the previous week the market value of iM-Best12(USMV)-Trader gained -0.57% at a time when SPY gained 0.72%. A starting capital of $100,000 at inception on 7/1/2014 would have grown to $138,913 which includes -$78 cash and excludes $2,307 spent on fees and slippage. |
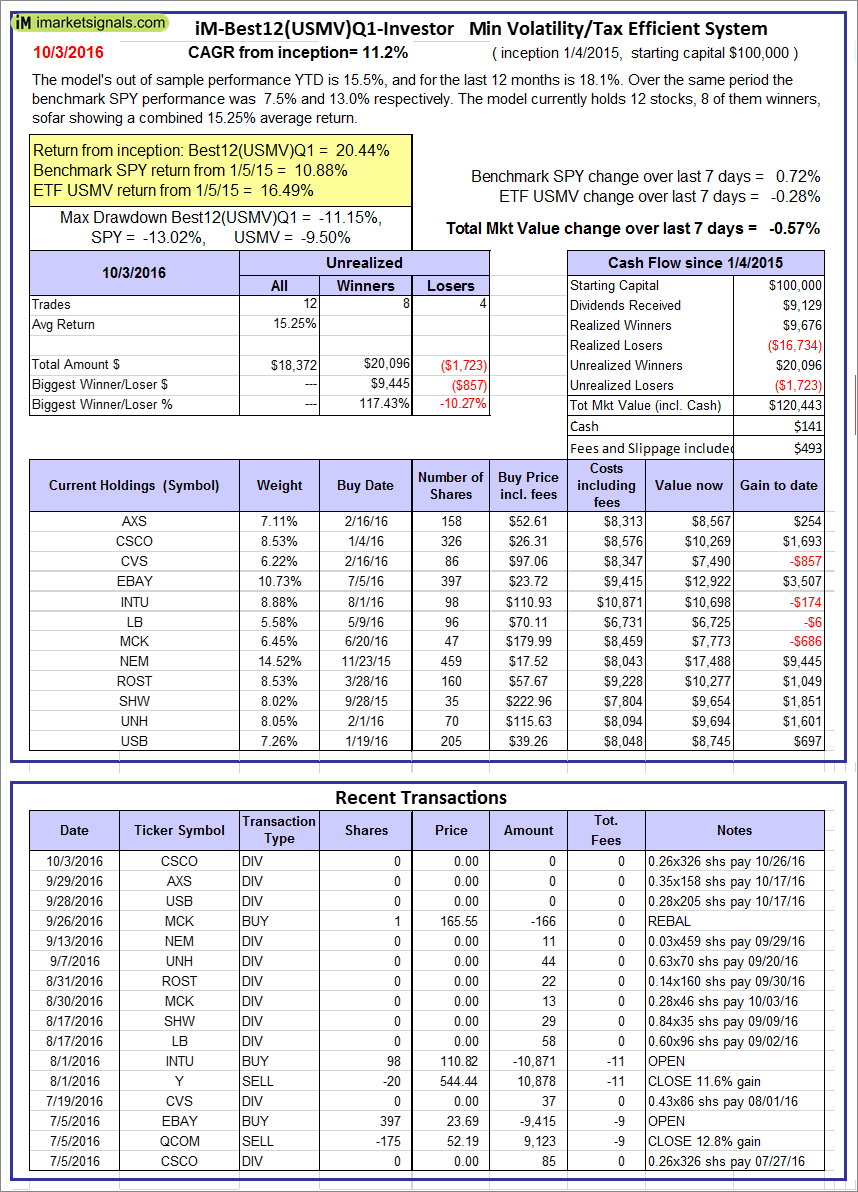  |
iM-Best12(USMV)Q1-Investor: The model’s out of sample performance YTD is 15.5%, and for the last 12 months is 18.1%. Over the same period the benchmark SPY performance was 7.5% and 13.0% respectively. Since inception, on 1/5/2015, the model gained 20.44% while the benchmark SPY gained 10.88% and the ETF USMV gained 16.49% over the same period. Over the previous week the market value of iM-Best12(USMV)Q1 gained -0.57% at a time when SPY gained 0.72%. A starting capital of $100,000 at inception on 1/5/2015 would have grown to $120,443 which includes $141 cash and excludes $493 spent on fees and slippage. |
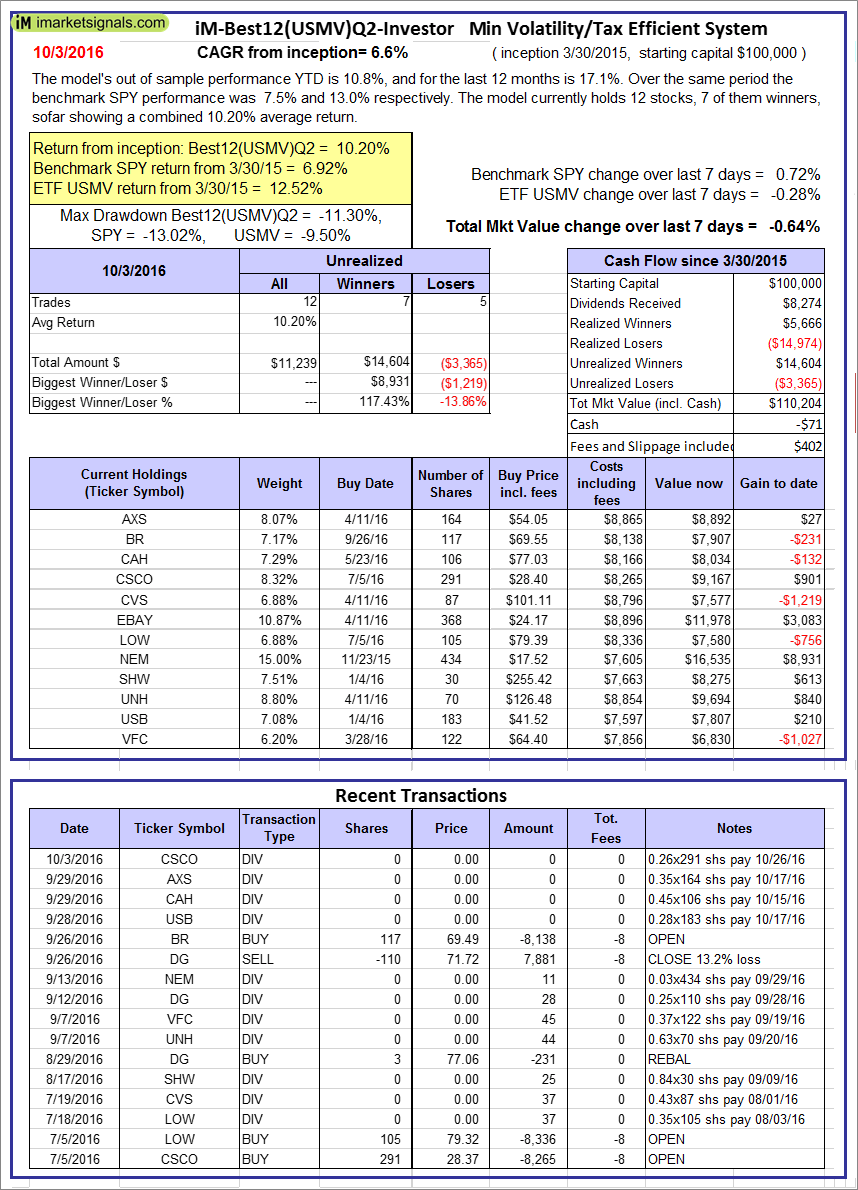 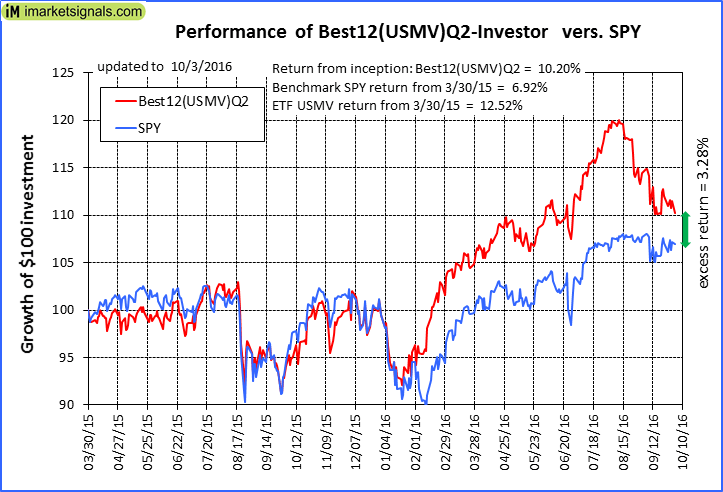 |
iM-Best12(USMV)Q2-Investor: The model’s out of sample performance YTD is 10.8%, and for the last 12 months is 17.1%. Over the same period the benchmark SPY performance was 7.5% and 13.0% respectively. Since inception, on 3/31/2015, the model gained 10.20% while the benchmark SPY gained 6.92% and the ETF USMV gained 12.52% over the same period. Over the previous week the market value of iM-Best12(USMV)Q2 gained -0.64% at a time when SPY gained 0.72%. A starting capital of $100,000 at inception on 3/31/2015 would have grown to $110,204 which includes -$71 cash and excludes $402 spent on fees and slippage. |
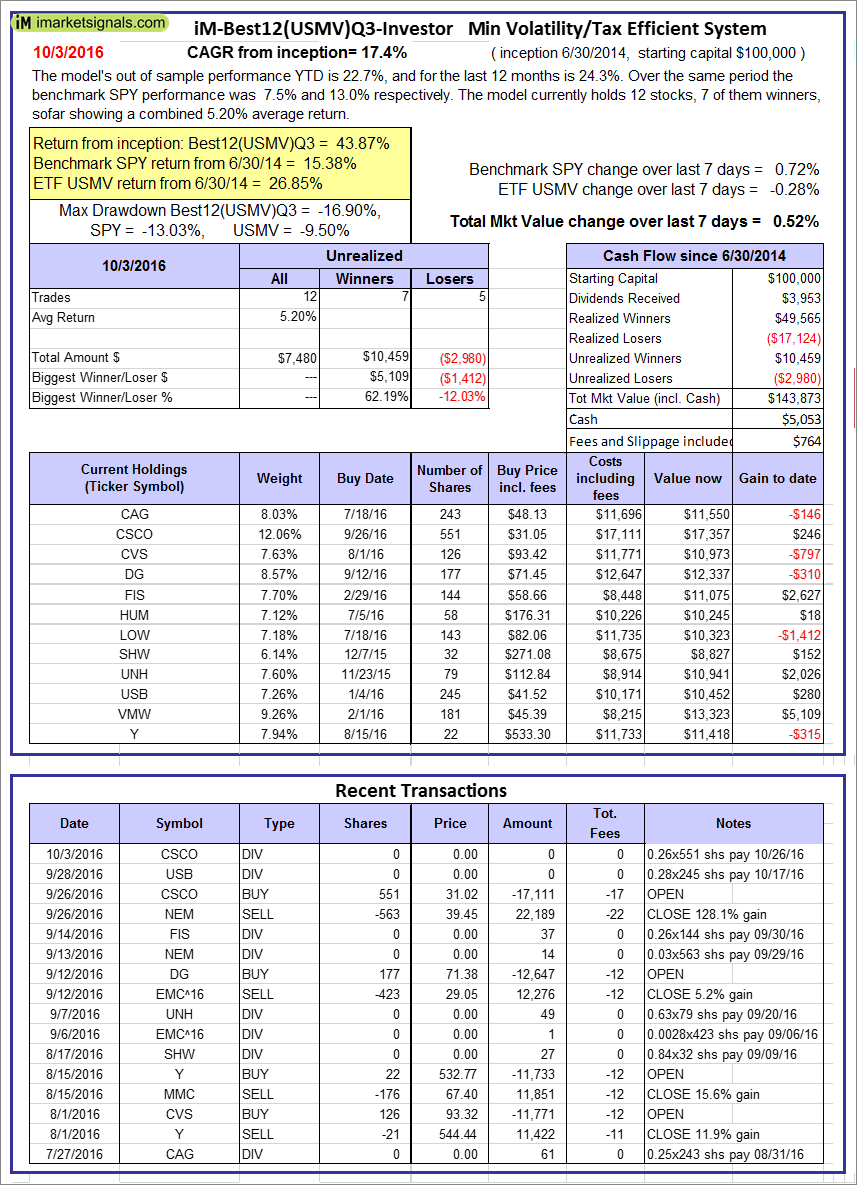  |
iM-Best12(USMV)Q3-Investor: The model’s out of sample performance YTD is 22.7%, and for the last 12 months is 24.3%. Over the same period the benchmark SPY performance was 7.5% and 13.0% respectively. Since inception, on 7/1/2014, the model gained 43.87% while the benchmark SPY gained 15.38% and the ETF USMV gained 26.85% over the same period. Over the previous week the market value of iM-Best12(USMV)Q3 gained 0.52% at a time when SPY gained 0.72%. A starting capital of $100,000 at inception on 7/1/2014 would have grown to $143,873 which includes $5,053 cash and excludes $764 spent on fees and slippage. |
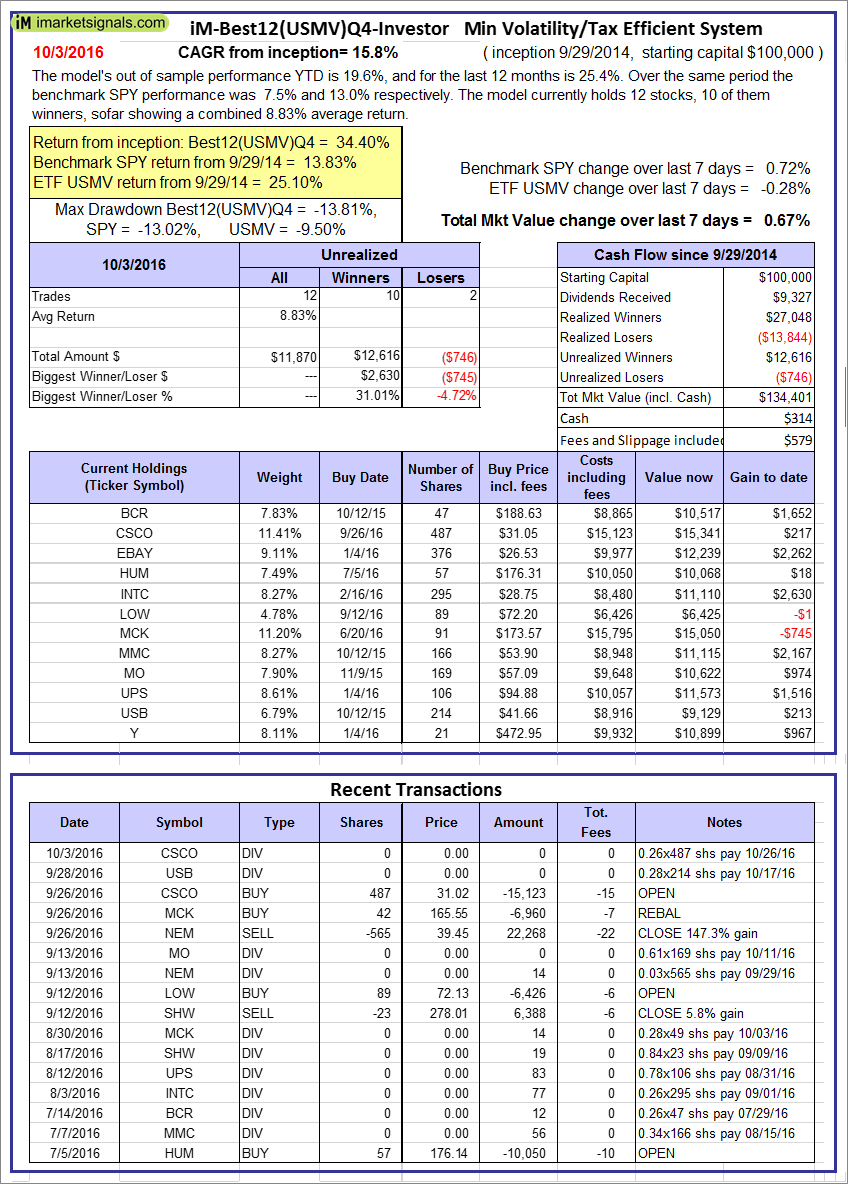 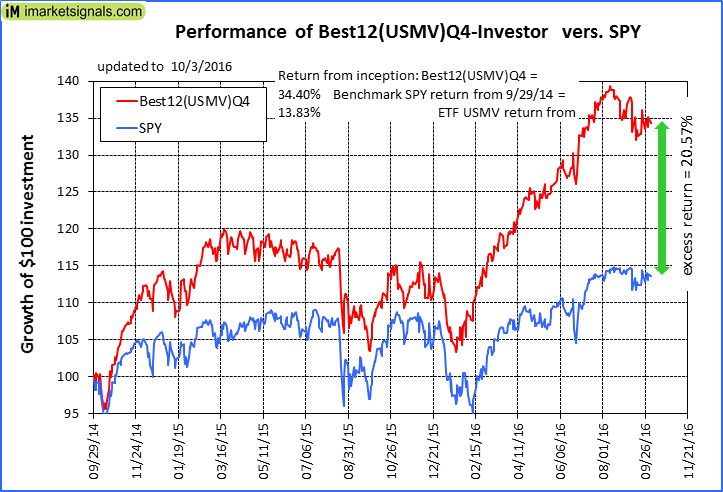 |
iM-Best12(USMV)Q4-Investor: Since inception, on 9/30/2014, the model gained 34.40% while the benchmark SPY gained 13.83% and the ETF USMV gained 25.10% over the same period. Over the previous week the market value of iM-Best12(USMV)Q4 gained 0.67% at a time when SPY gained 0.72%. A starting capital of $100,000 at inception on 9/30/2014 would have grown to $134,401 which includes $314 cash and excludes $579 spent on fees and slippage. |
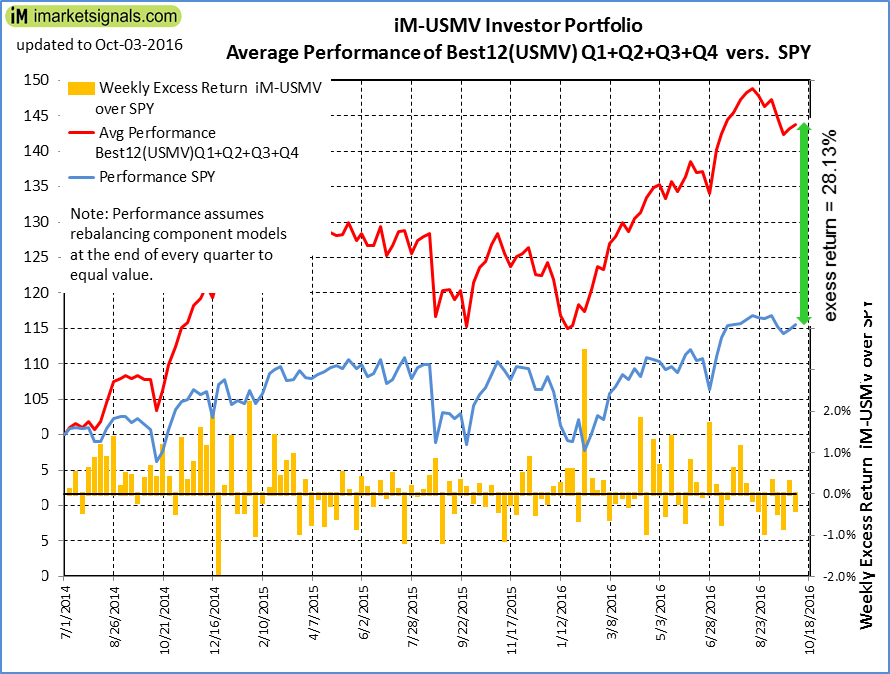 |
Average Performance of iM-Best12(USMV)Q1+Q2+Q3+Q4-Investor resulted in an excess return of 28.13% over SPY. (see iM-USMV Investor Portfolio) |
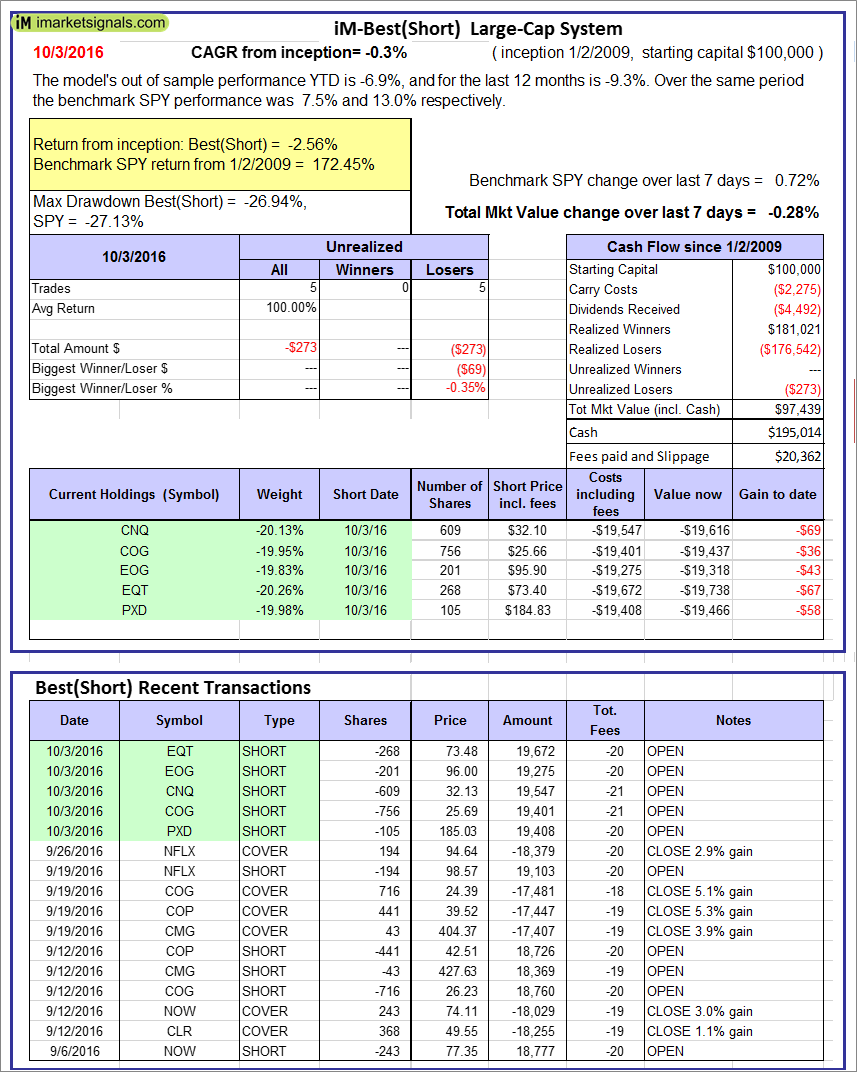 |
iM-Best(Short): The model’s out of sample performance YTD is -6.9%, and for the last 12 months is -9.3%. Over the same period the benchmark SPY performance was 7.5% and 13.0% respectively. Over the previous week the market value of iM-Best(Short) gained -0.28% at a time when SPY gained 0.72%. Over the period 1/2/2009 to 10/3/2016 the starting capital of $100,000 would have grown to $97,439 which includes $195,014 cash and excludes $20,362 spent on fees and slippage. |
iM-Best Reports – 10/3/2016
Posted in pmp SPY-SH
Leave a Reply
You must be logged in to post a comment.