
  |
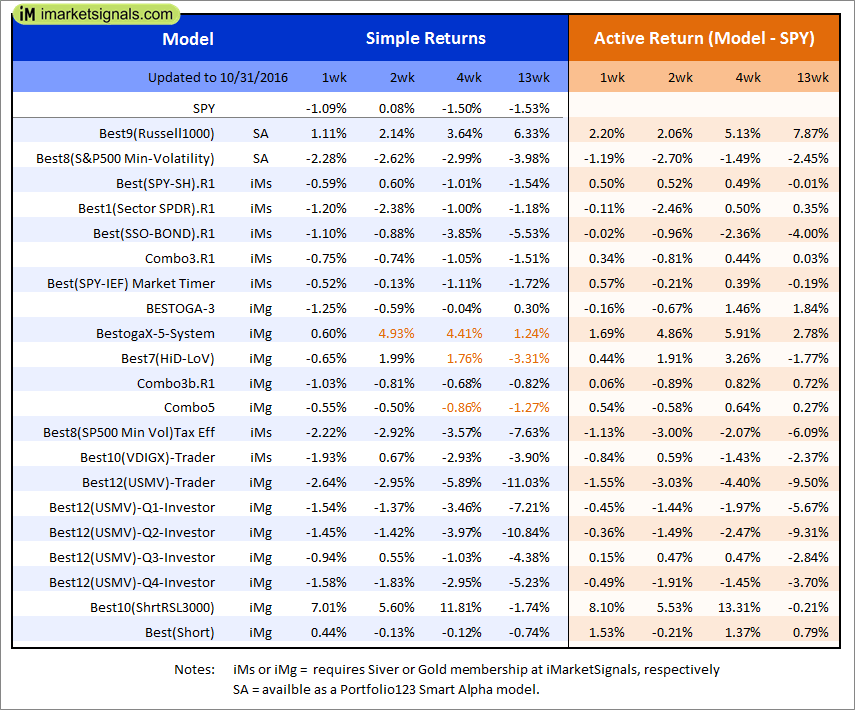
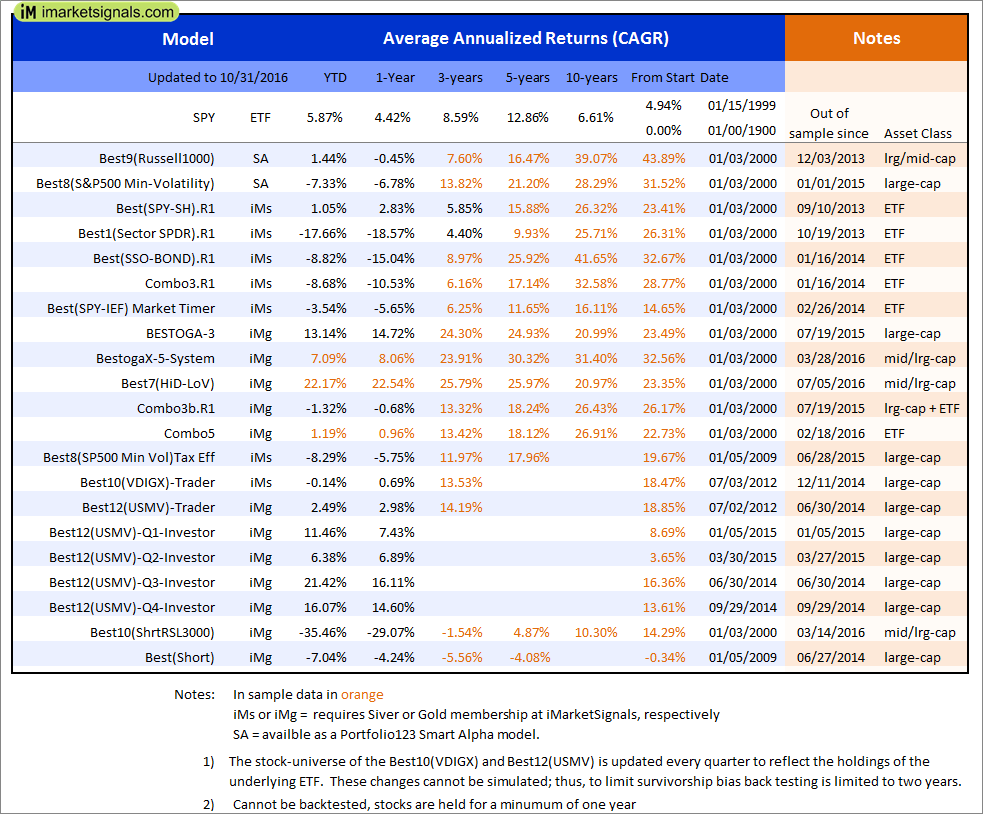
Out of sample performance summary of our models for the past 1, 2, 4 and 13 week periods. The active active return indicates how the models over- or underperformed the benchmark ETF SPY. Also the YTD, and the 1-, 3-, 5- and 10-year annualized returns are shown in the second table |
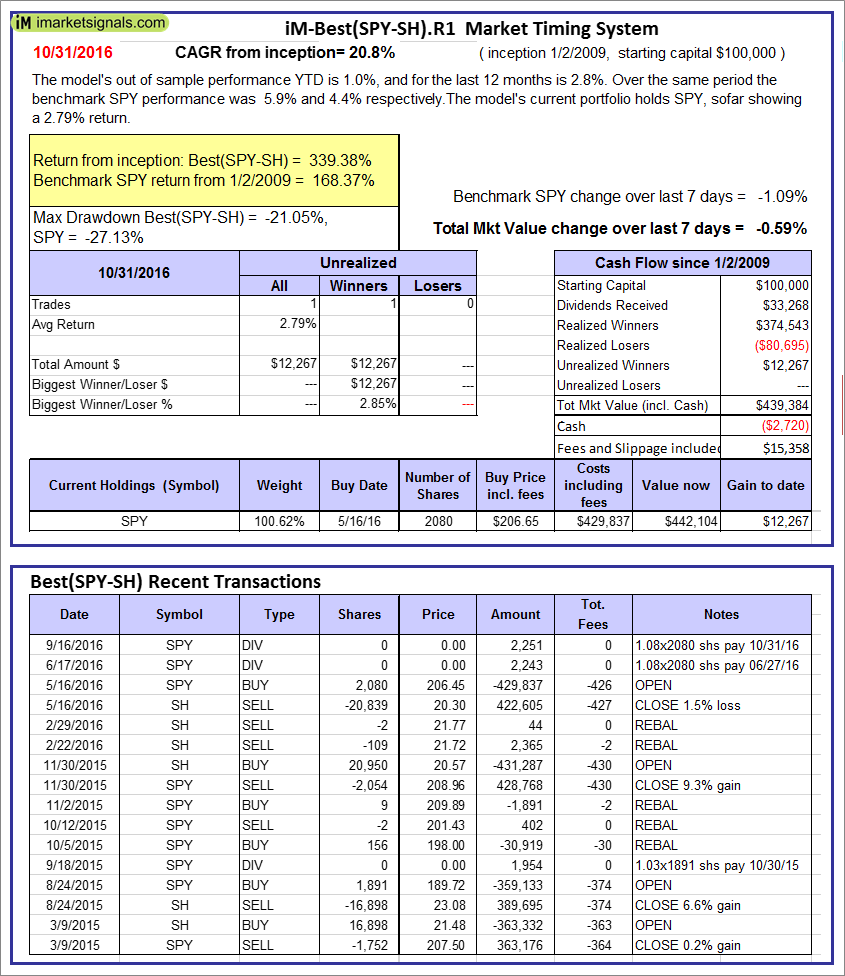 |
iM-Best(SPY-SH).R1: The model’s out of sample performance YTD is 1.0%, and for the last 12 months is 2.8%. Over the same period the benchmark SPY performance was 5.9% and 4.4% respectively. Over the previous week the market value of Best(SPY-SH) gained -0.59% at a time when SPY gained -1.09%. A starting capital of $100,000 at inception on 1/2/2009 would have grown to $439,384 which includes -$2,720 cash and excludes $15,358 spent on fees and slippage. |
 |
iM-Combo3.R1: The model’s out of sample performance YTD is -8.7%, and for the last 12 months is -10.5%. Over the same period the benchmark SPY performance was 5.9% and 4.4% respectively. Over the previous week the market value of iM-Combo3.R1 gained -0.75% at a time when SPY gained -1.09%. A starting capital of $100,000 at inception on 2/3/2014 would have grown to $120,835 which includes $64 cash and excludes $2,966 spent on fees and slippage. |
 |
iM-Combo5: The model’s out of sample performance from inception is -2.0%. The benchmark SPY performance over the same period is 12.4%. Over the previous week the market value of iM-Combo5 gained -0.55% at a time when SPY gained -1.09%. A starting capital of $100,000 at inception on 2/22/2016 would have grown to $97,993 which includes $18,885 cash and excludes $278 spent on fees and slippage. |
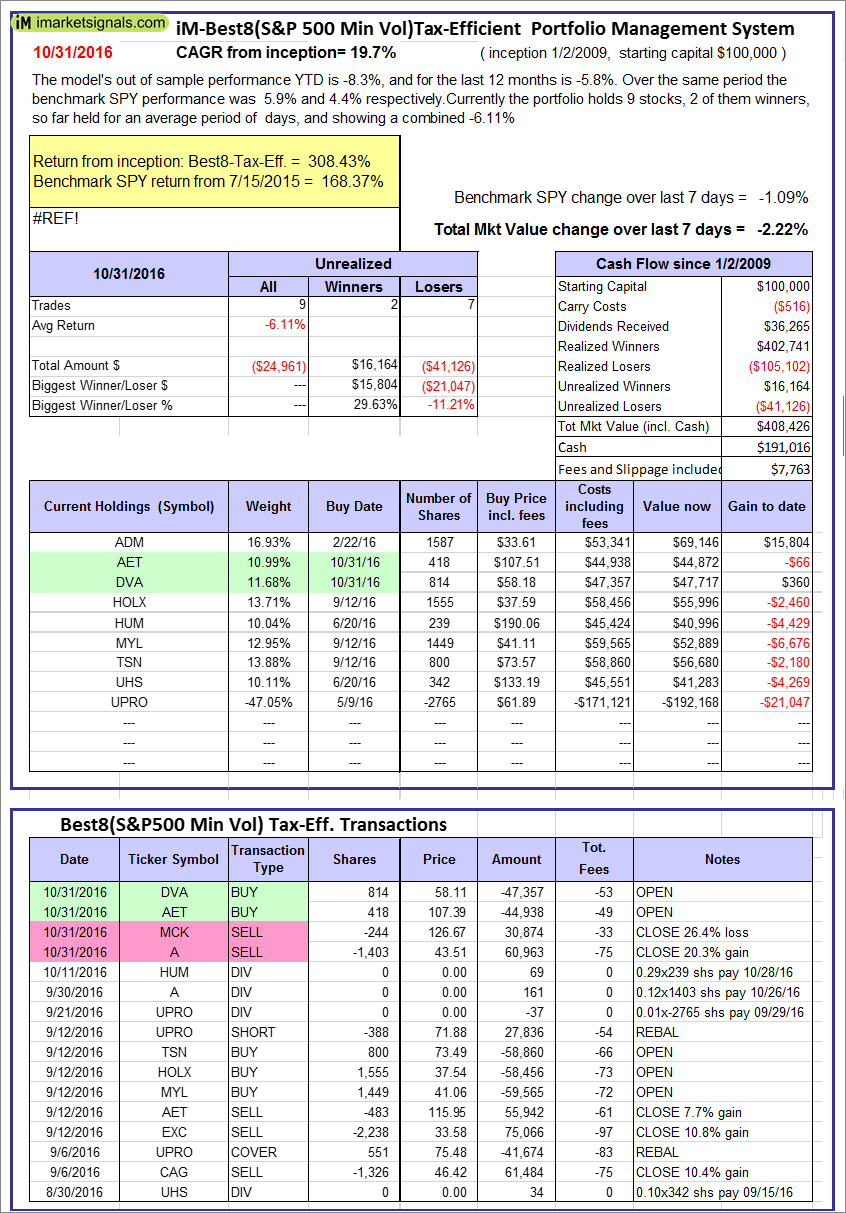 |
The iM-Best8(S&P500 Min Vol)Tax-Efficient The model’s out of sample performance YTD is -8.3%, and for the last 12 months is -5.8%. Over the same period the benchmark SPY performance was 5.9% and 4.4% respectively. Over the previous week the market value of iM-Best8(S&P 500)Tax-Eff. gained -2.22% at a time when SPY gained -1.09%. A starting capital of $100,000 at inception on 1/2/2009 would have grown to $408,426 which includes $191,016 cash and excludes $7,763 spent on fees and slippage. |
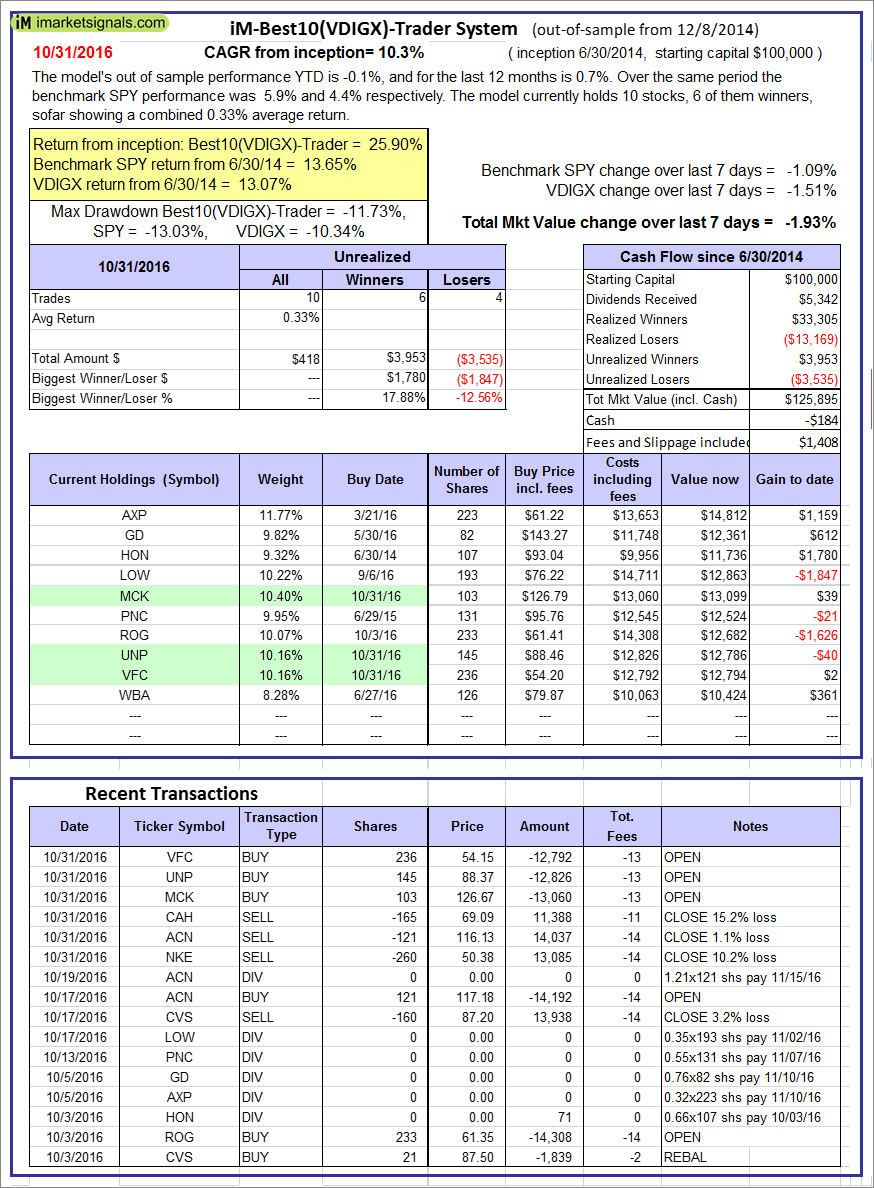 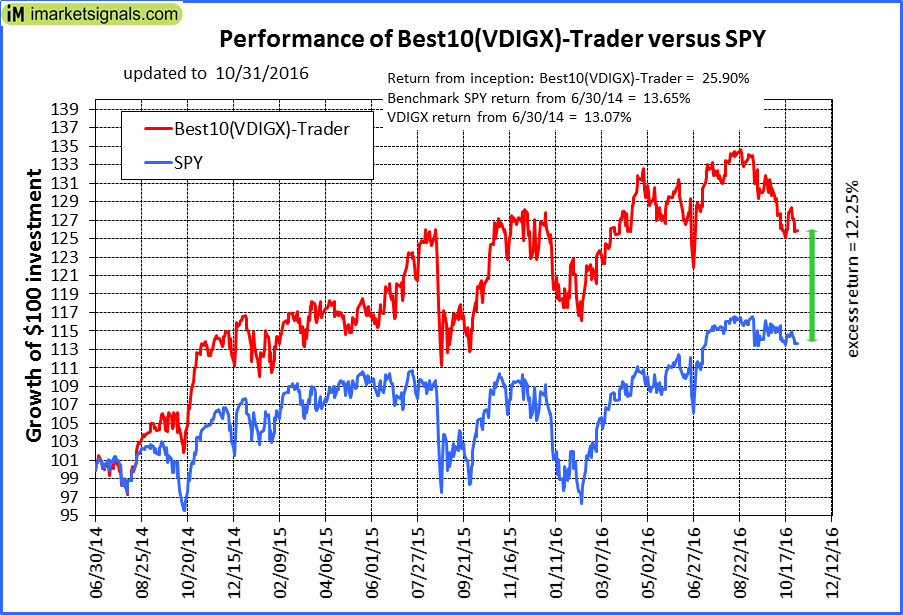 |
iM-Best10(VDIGX)-Trader: The model’s out of sample performance YTD is -0.1%, and for the last 12 months is 0.7%. Over the same period the benchmark SPY performance was 5.9% and 4.4% respectively. Since inception, on 7/1/2014, the model gained 25.90% while the benchmark SPY gained 13.65% and the ETF VDIGX gained 13.07% over the same period. Over the previous week the market value of iM-Best10(VDIGX) gained -1.93% at a time when SPY gained -1.09%. A starting capital of $100,000 at inception on 7/1/2014 would have grown to $125,895 which includes -$184 cash and excludes $1,408 spent on fees and slippage. |
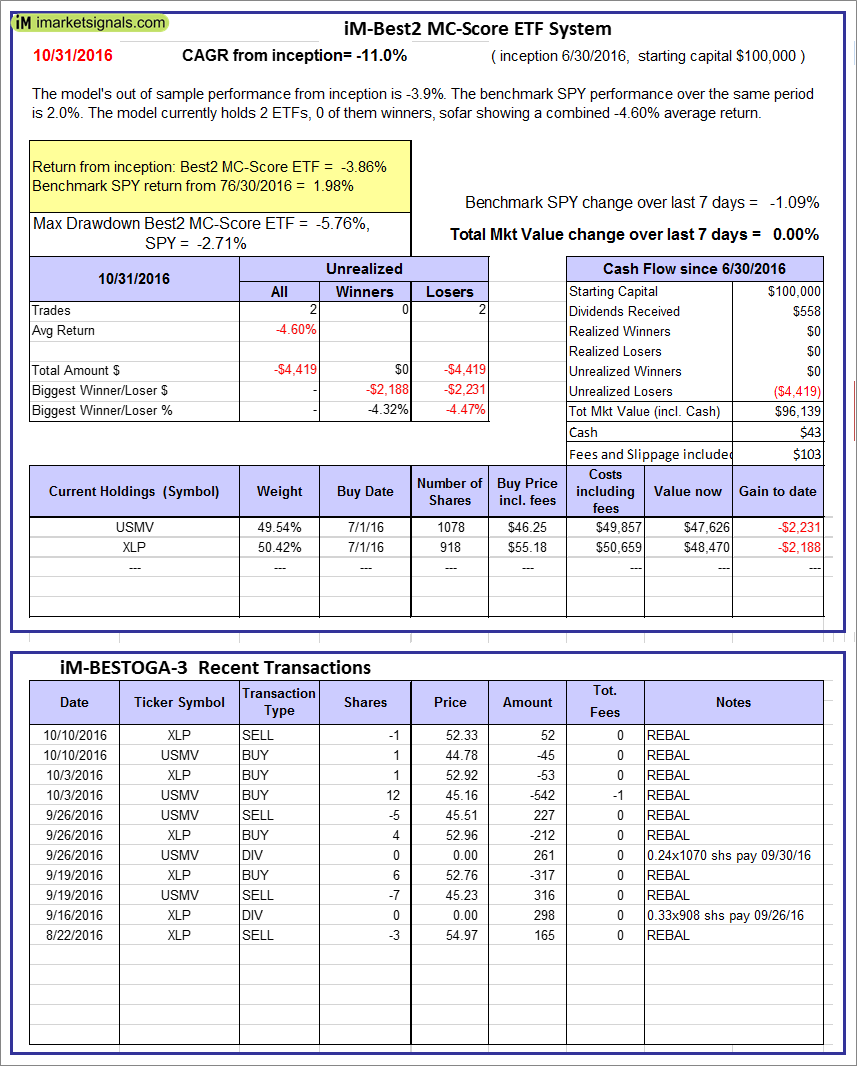 |
iM-Best2 MC-Score ETF System: The model’s out of sample performance from inception is -3.9%. The benchmark SPY performance over the same period is 2.0%. Over the previous week the market value of iM-BESTOGA-3 gained 0.00% at a time when SPY gained -1.09%. A starting capital of $100,000 at inception on 2/3/2014 would have grown to $43 which includes $103 cash and excludes Gain to date spent on fees and slippage. |
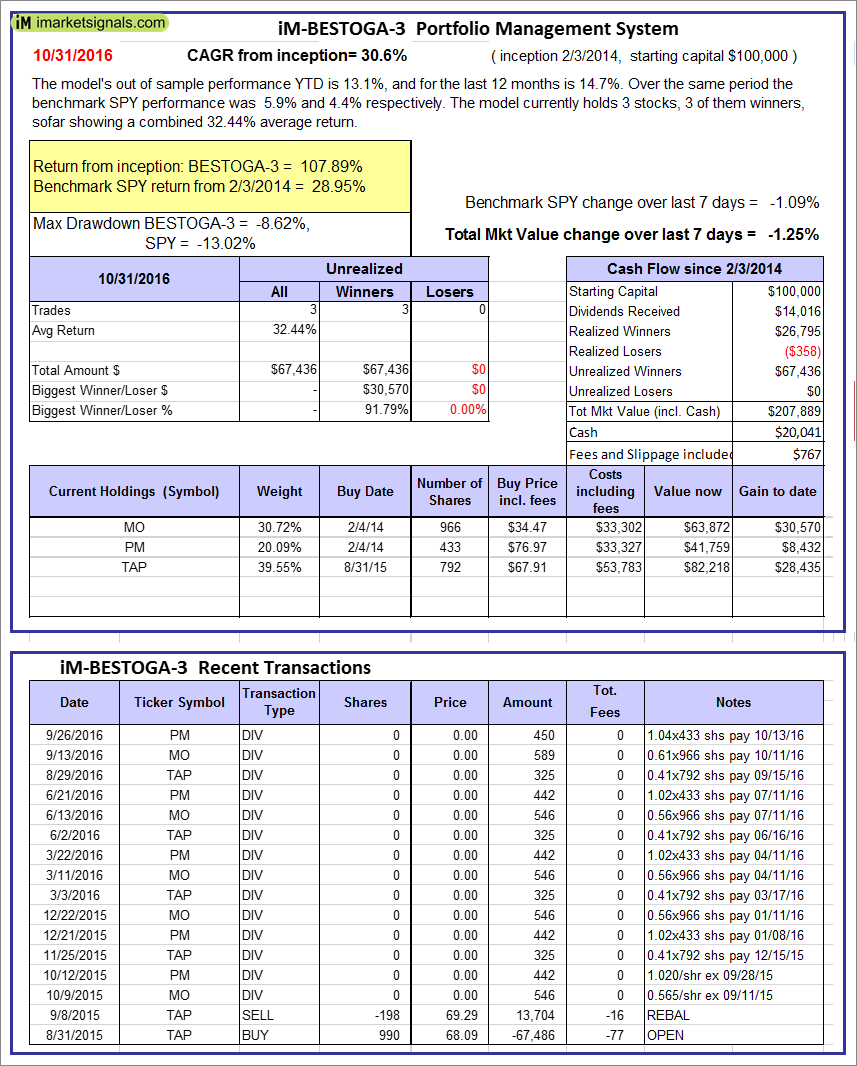 |
iM-BESTOGA-3: The model’s out of sample performance YTD is 13.1%, and for the last 12 months is 14.7%. Over the same period the benchmark SPY performance was 5.9% and 4.4% respectively. Over the previous week the market value of iM-BESTOGA-3 gained -1.25% at a time when SPY gained -1.09%. A starting capital of $100,000 at inception on 2/3/2014 would have grown to $207,889 which includes $20,041 cash and excludes $767 spent on fees and slippage. |
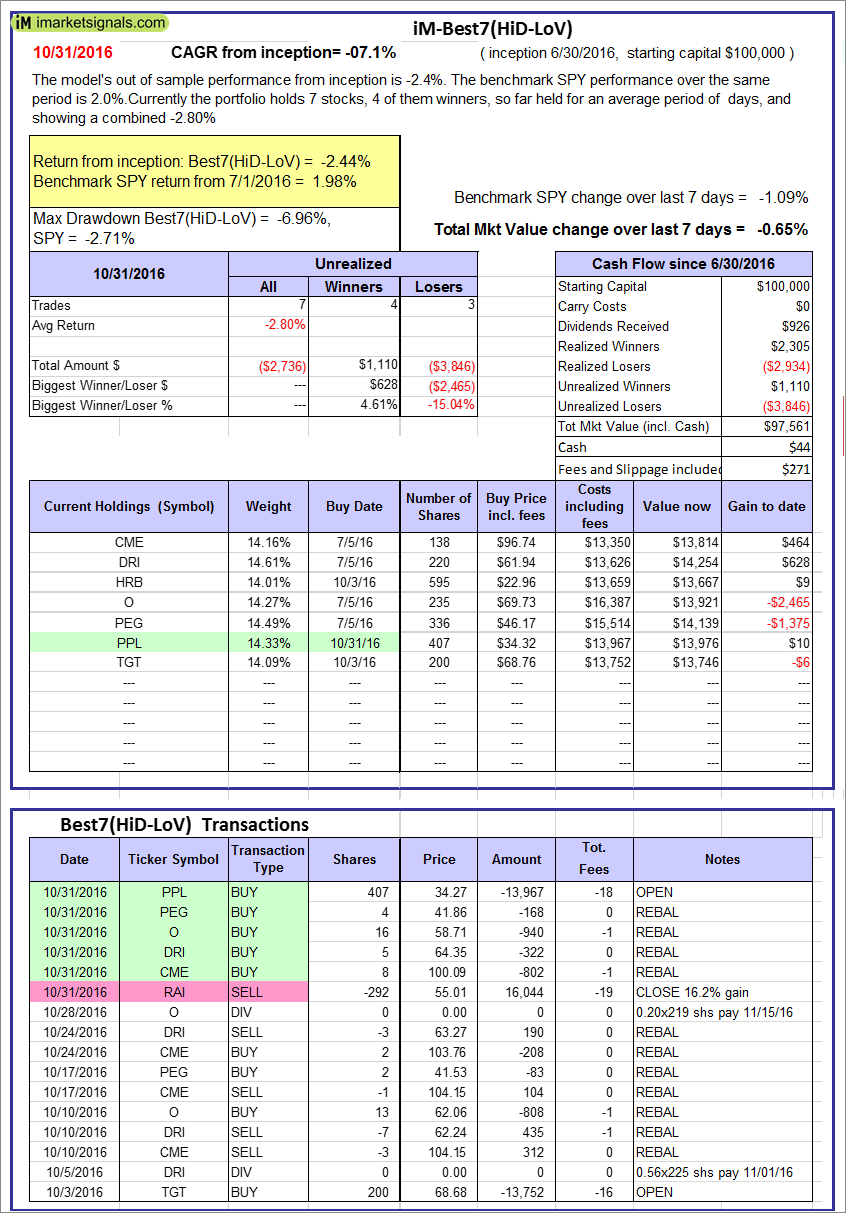 |
iM-Best7(HiD-LoV): The model’s out of sample performance from inception is -2.4%. The benchmark SPY performance over the same period is 2.0%. Over the previous week the market value of iM-BESTOGA-3 gained -0.65% at a time when SPY gained -1.09%. A starting capital of $100,000 at inception on 2/3/2014 would have grown to $97,561 which includes $44 cash and excludes $271 spent on fees and slippage. |
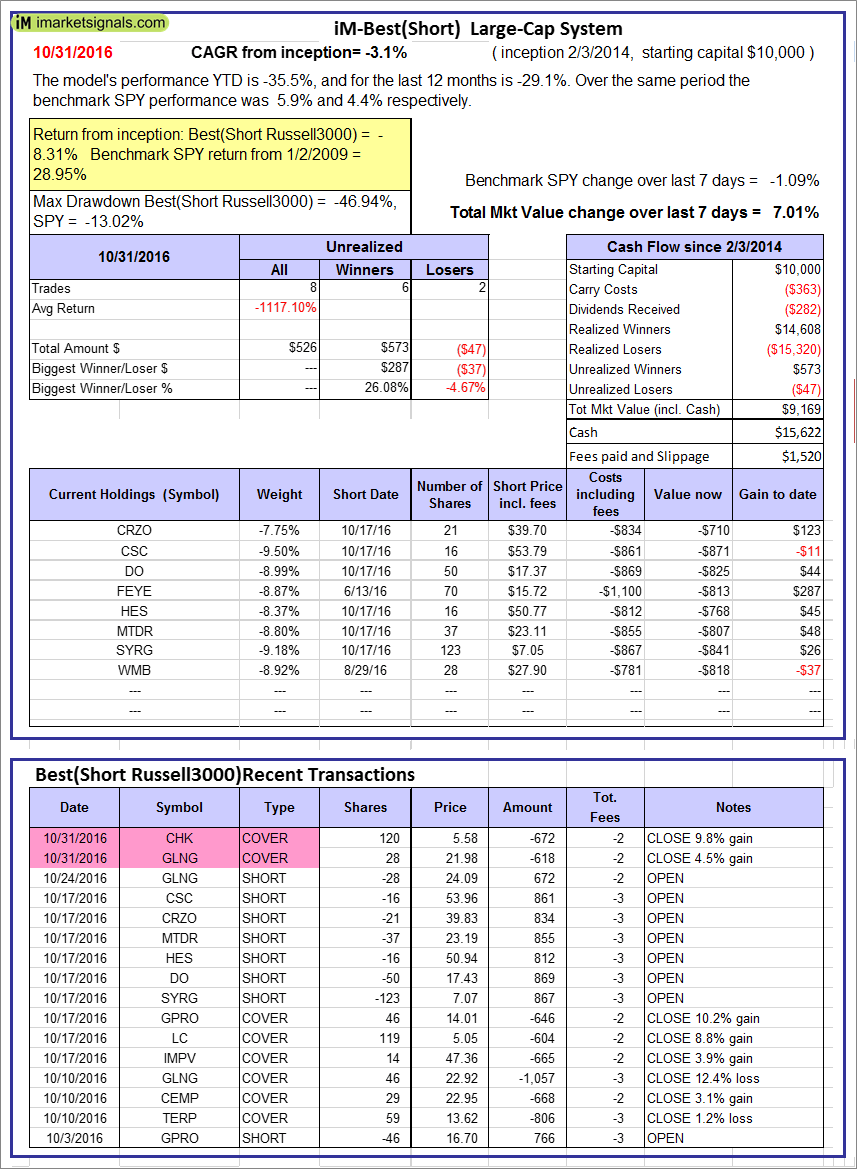 |
iM-Best10(Short Russell3000): The model’s performance YTD is -35.5%, and for the last 12 months is -29.1%. Over the same period the benchmark SPY performance was 5.9% and 4.4% respectively. Over the previous week the market value of iM-Best10(Short Russell3000) gained 7.01% at a time when SPY gained -1.09%. Over the period 2/3/2014 to 10/31/2016 the starting capital of $100,000 would have grown to $9,169 which includes $15,622 cash and excludes $1,520 spent on fees and slippage. |
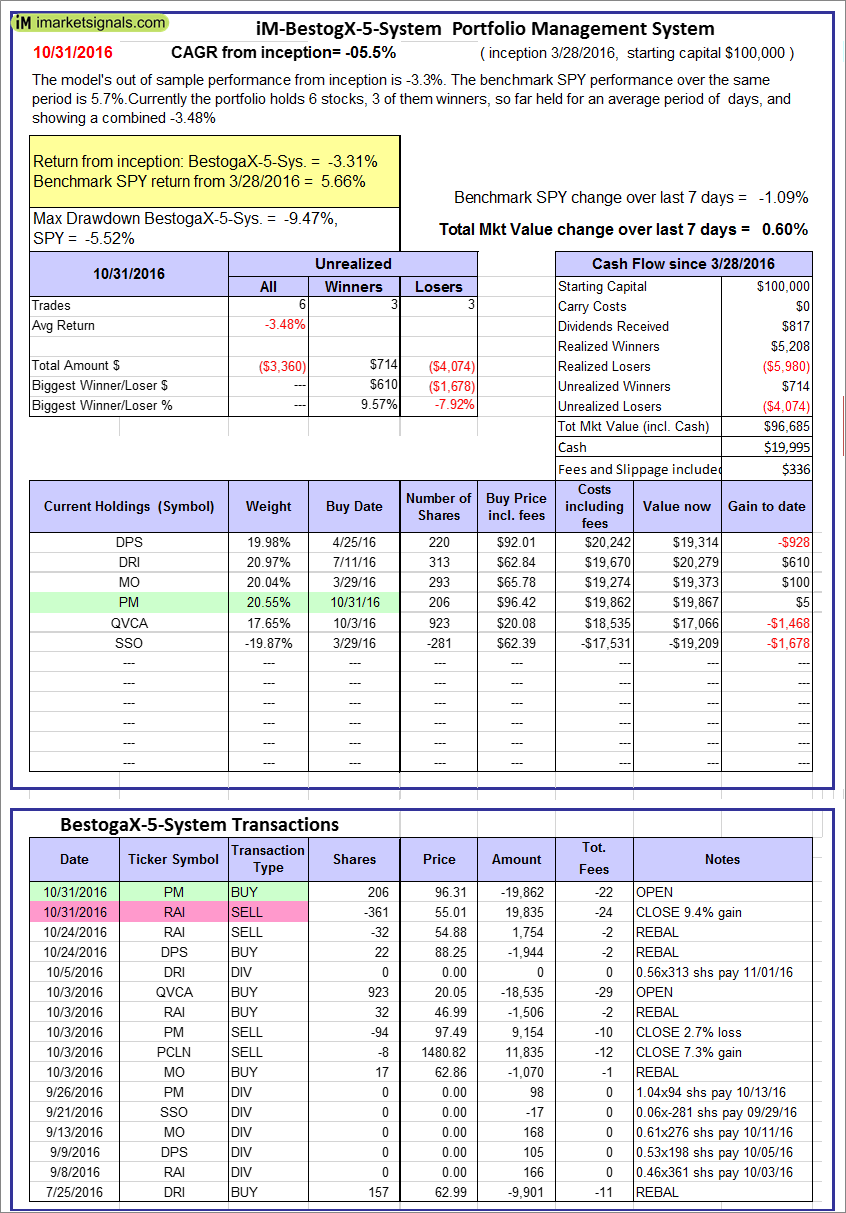 |
iM-BestogaX5-System: The model’s out of sample performance from inception is -3.3%. The benchmark SPY performance over the same period is 5.7%. Over the previous week the market value of iM-Best8(S&P 500)Tax-Eff. gained 0.60% at a time when SPY gained -1.09%. A starting capital of $100,000 at inception on 1/2/2009 would have grown to $96,685 which includes $19,995 cash and excludes $336 spent on fees and slippage. |
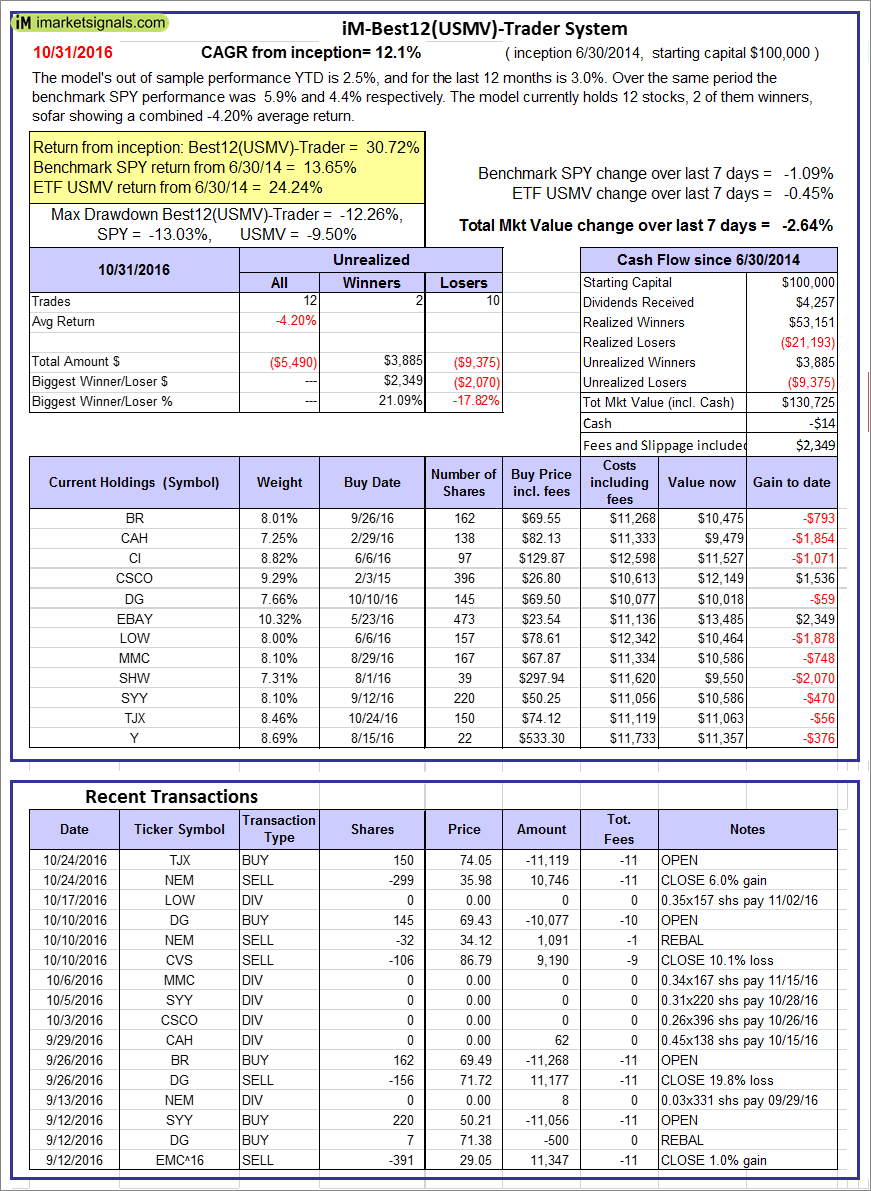 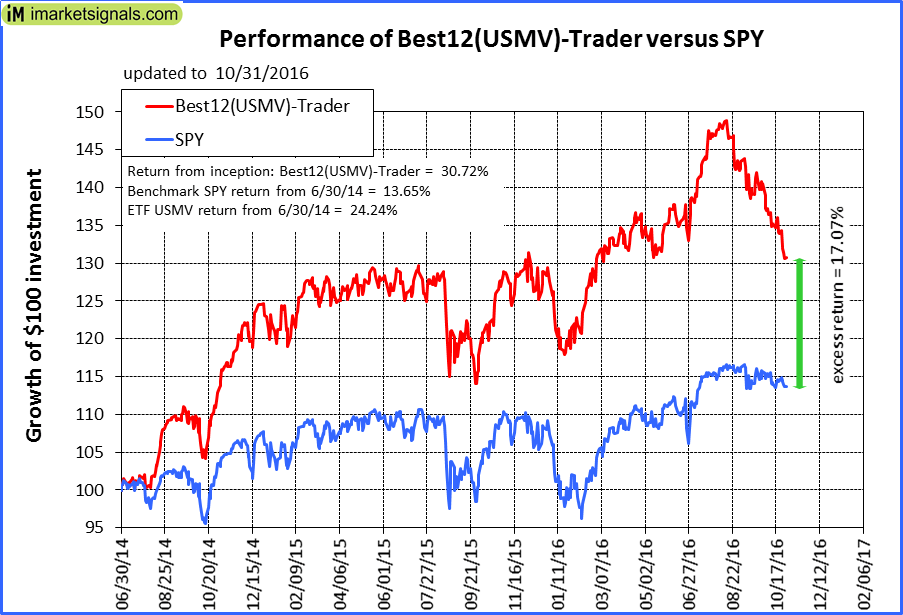 |
iM-Best12(USMV)-Trader: The model’s out of sample performance YTD is 2.5%, and for the last 12 months is 3.0%. Over the same period the benchmark SPY performance was 5.9% and 4.4% respectively. Since inception, on 7/1/2014, the model gained 30.72% while the benchmark SPY gained 13.65% and the ETF USMV gained 24.24% over the same period. Over the previous week the market value of iM-Best12(USMV)-Trader gained -2.64% at a time when SPY gained -1.09%. A starting capital of $100,000 at inception on 7/1/2014 would have grown to $130,725 which includes -$14 cash and excludes $2,349 spent on fees and slippage. |
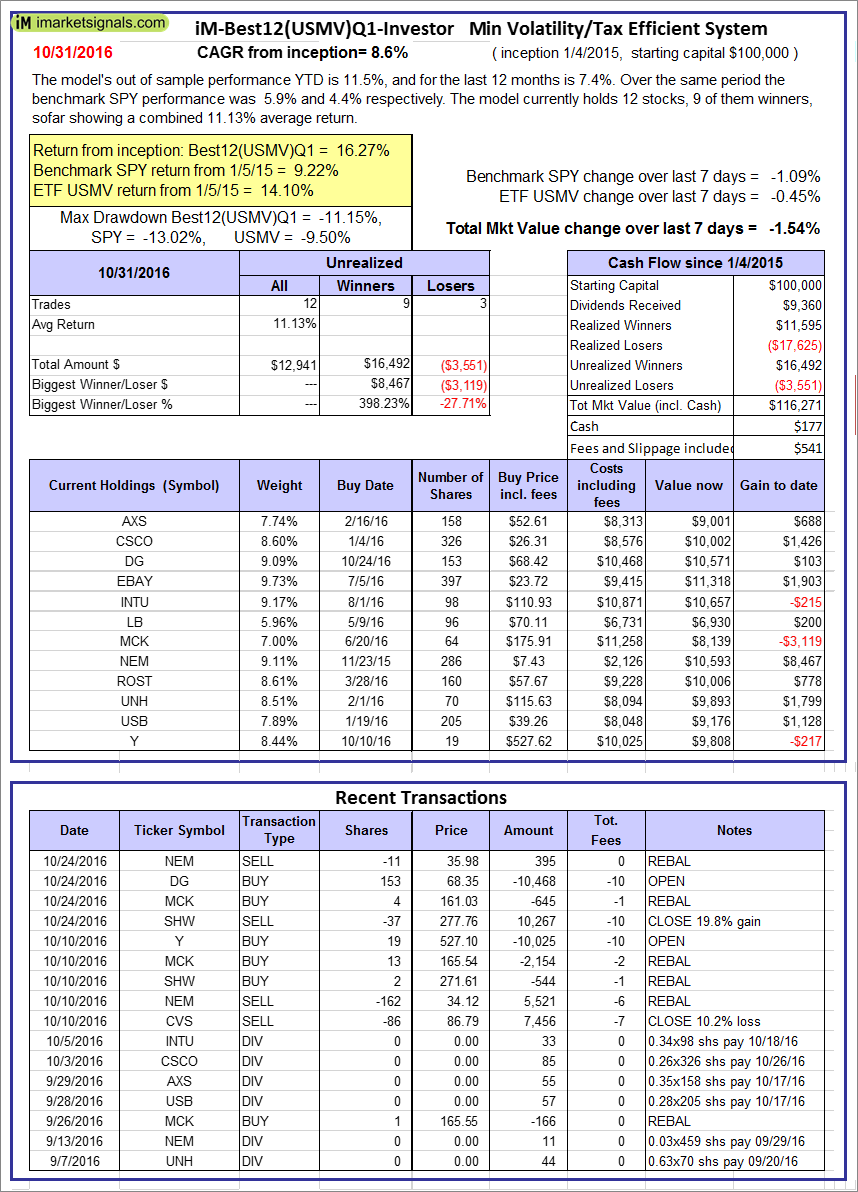 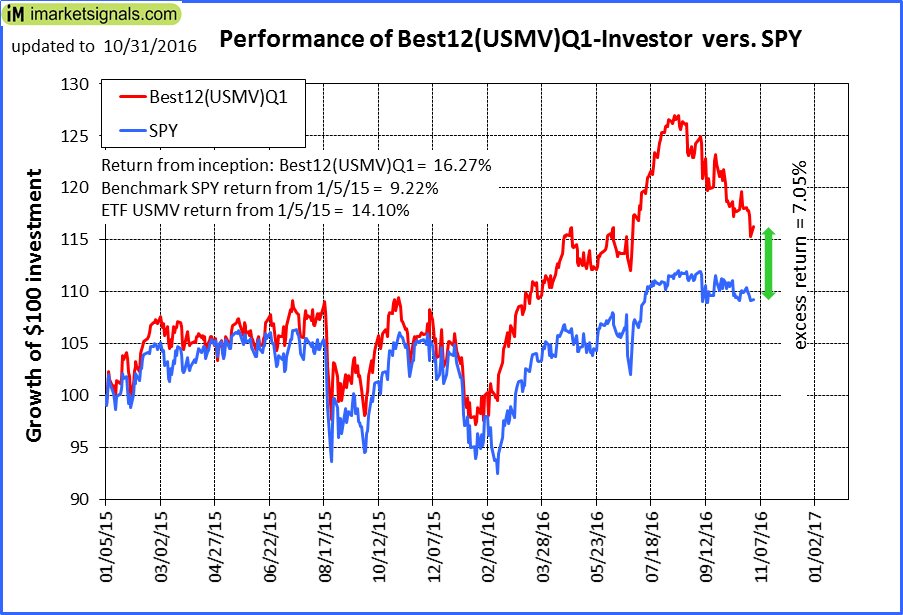 |
iM-Best12(USMV)Q1-Investor: The model’s out of sample performance YTD is 11.5%, and for the last 12 months is 7.4%. Over the same period the benchmark SPY performance was 5.9% and 4.4% respectively. Since inception, on 1/5/2015, the model gained 16.27% while the benchmark SPY gained 9.22% and the ETF USMV gained 14.10% over the same period. Over the previous week the market value of iM-Best12(USMV)Q1 gained -1.54% at a time when SPY gained -1.09%. A starting capital of $100,000 at inception on 1/5/2015 would have grown to $116,271 which includes $177 cash and excludes $541 spent on fees and slippage. |
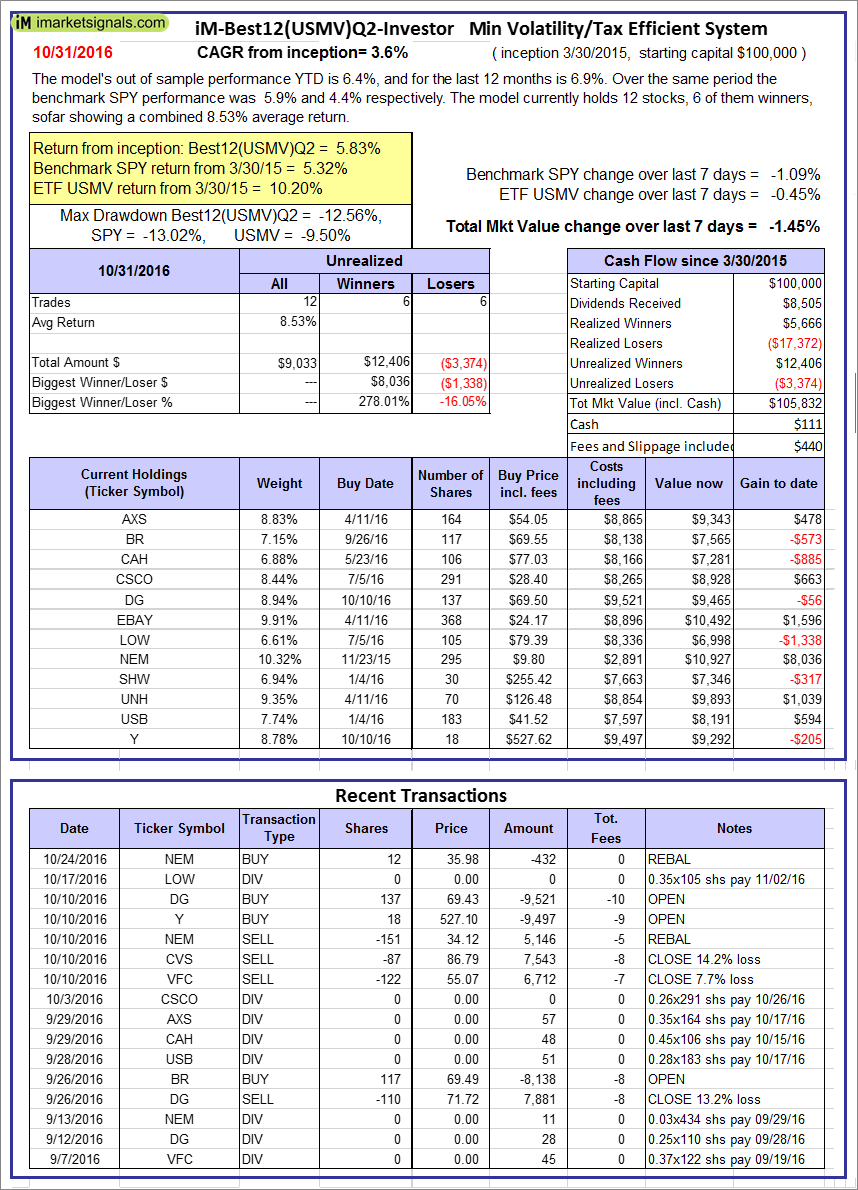 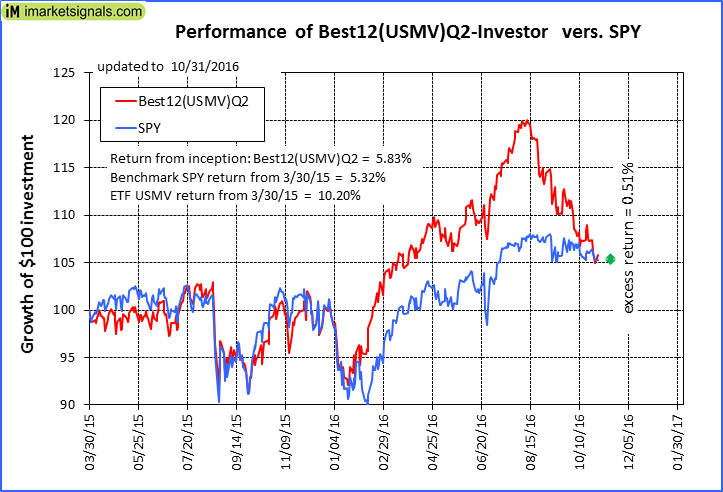 |
iM-Best12(USMV)Q2-Investor: The model’s out of sample performance YTD is 6.4%, and for the last 12 months is 6.9%. Over the same period the benchmark SPY performance was 5.9% and 4.4% respectively. Since inception, on 3/31/2015, the model gained 5.83% while the benchmark SPY gained 5.32% and the ETF USMV gained 10.20% over the same period. Over the previous week the market value of iM-Best12(USMV)Q2 gained -1.45% at a time when SPY gained -1.09%. A starting capital of $100,000 at inception on 3/31/2015 would have grown to $105,832 which includes $111 cash and excludes $440 spent on fees and slippage. |
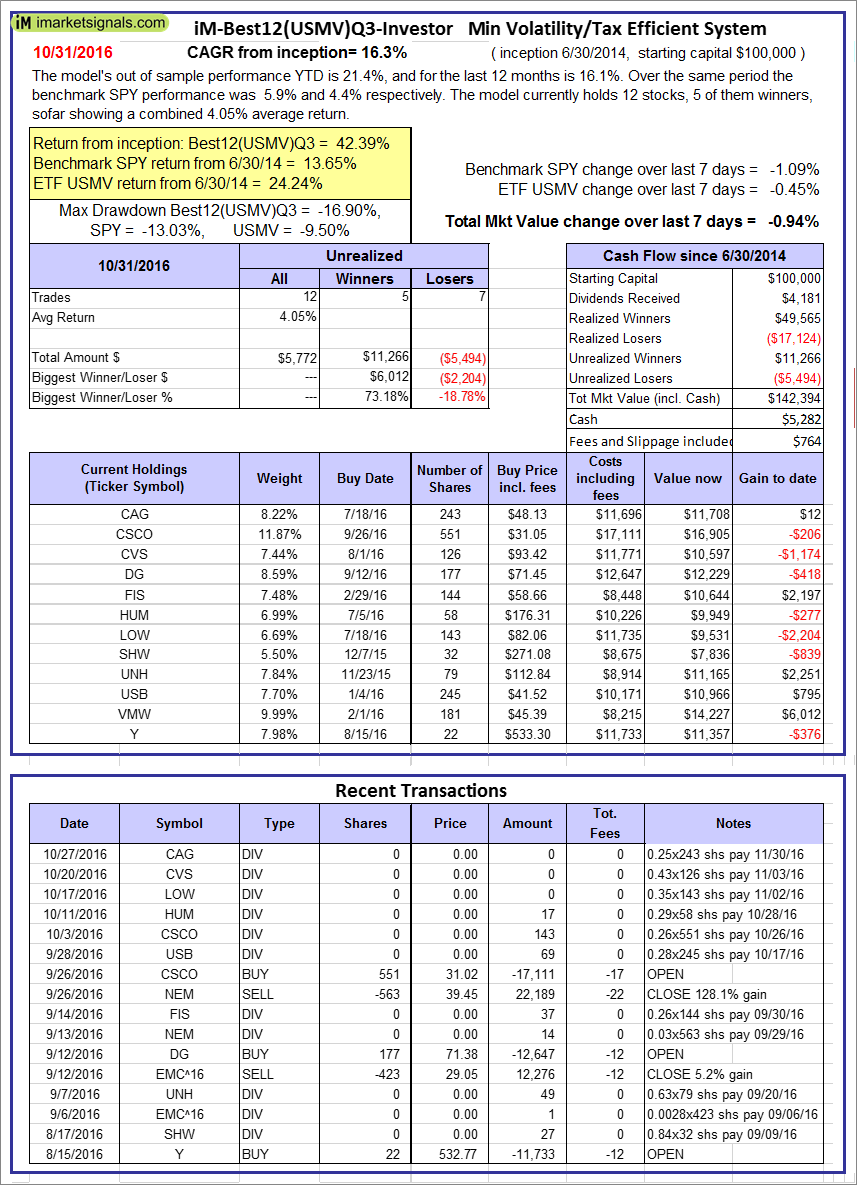 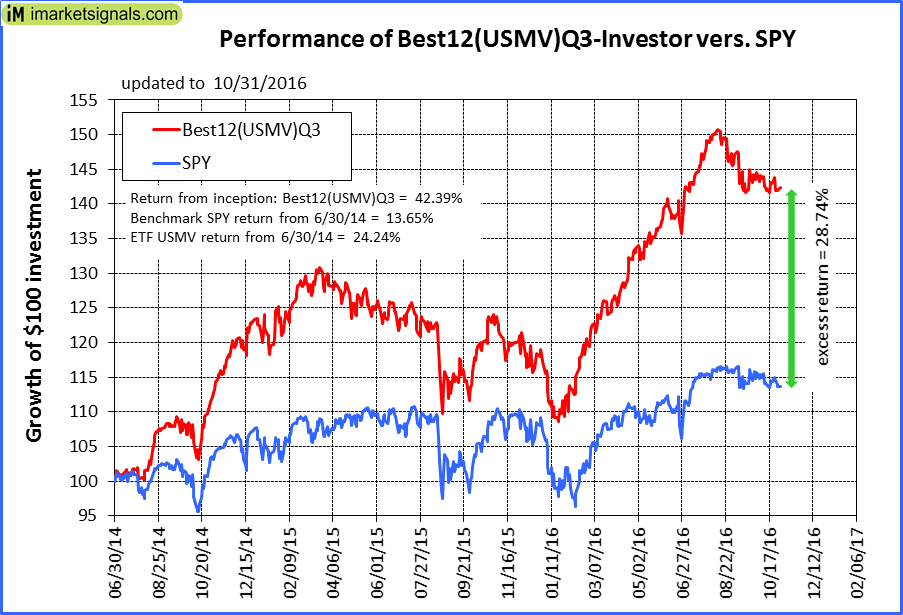 |
iM-Best12(USMV)Q3-Investor: The model’s out of sample performance YTD is 21.4%, and for the last 12 months is 16.1%. Over the same period the benchmark SPY performance was 5.9% and 4.4% respectively. Since inception, on 7/1/2014, the model gained 42.39% while the benchmark SPY gained 13.65% and the ETF USMV gained 24.24% over the same period. Over the previous week the market value of iM-Best12(USMV)Q3 gained -0.94% at a time when SPY gained -1.09%. A starting capital of $100,000 at inception on 7/1/2014 would have grown to $142,394 which includes $5,282 cash and excludes $764 spent on fees and slippage. |
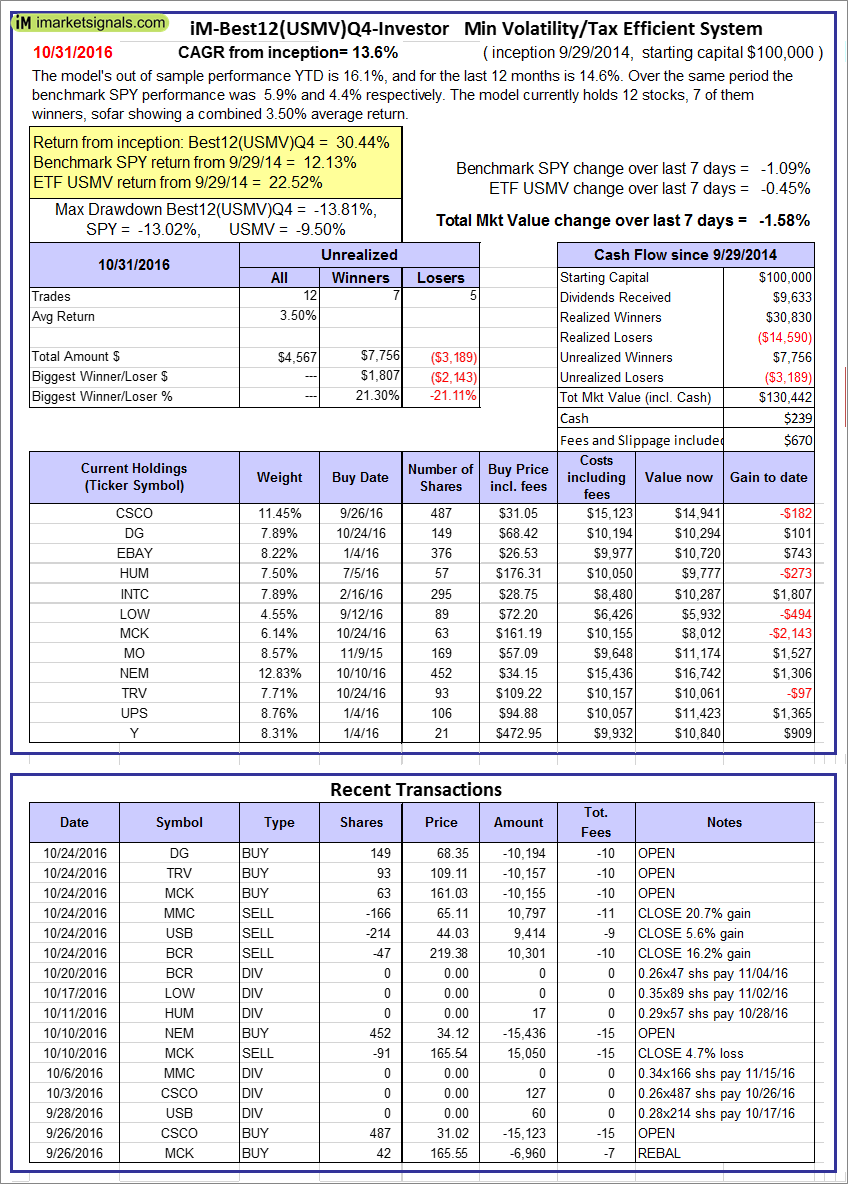  |
iM-Best12(USMV)Q4-Investor: Since inception, on 9/30/2014, the model gained 30.44% while the benchmark SPY gained 12.13% and the ETF USMV gained 22.52% over the same period. Over the previous week the market value of iM-Best12(USMV)Q4 gained -1.58% at a time when SPY gained -1.09%. A starting capital of $100,000 at inception on 9/30/2014 would have grown to $130,442 which includes $239 cash and excludes $670 spent on fees and slippage. |
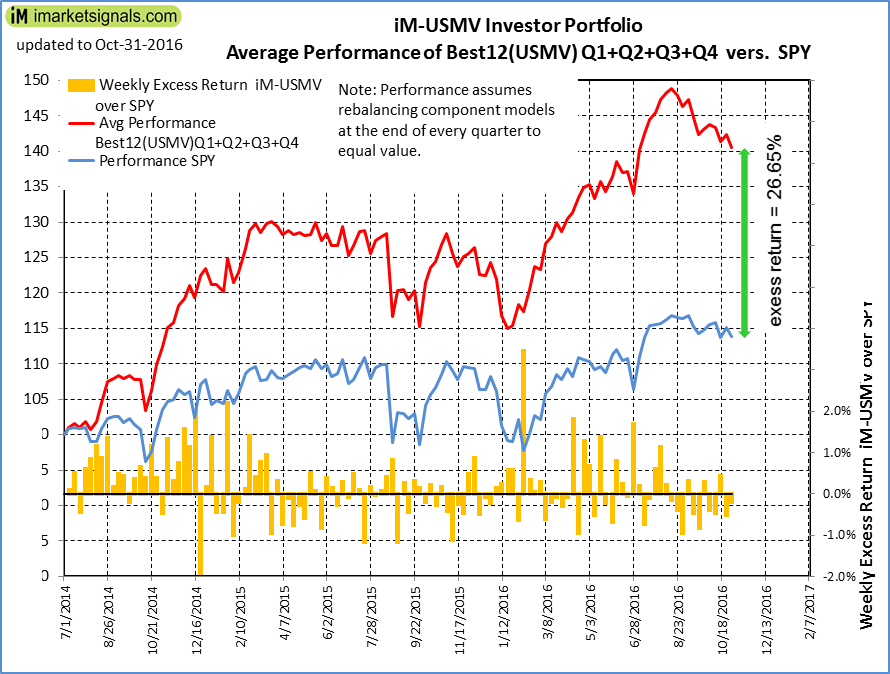 |
Average Performance of iM-Best12(USMV)Q1+Q2+Q3+Q4-Investor resulted in an excess return of 26.65% over SPY. (see iM-USMV Investor Portfolio) |
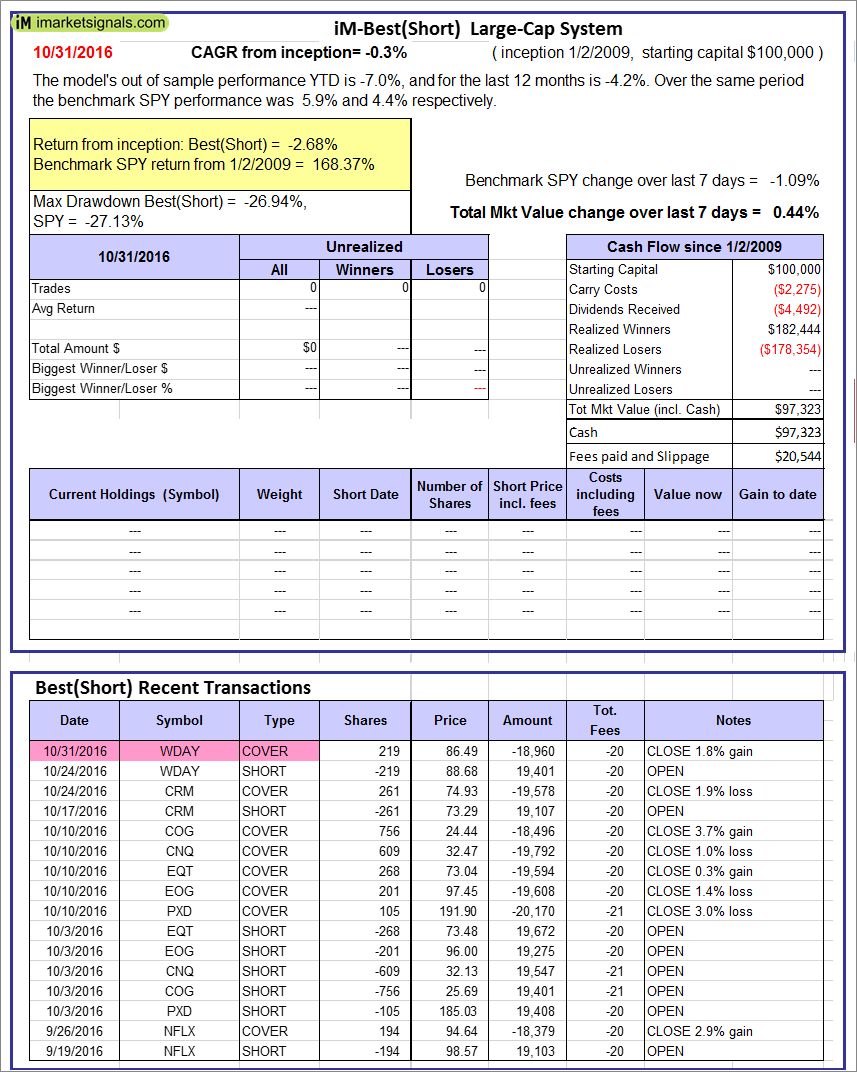 |
iM-Best(Short): The model’s out of sample performance YTD is -7.0%, and for the last 12 months is -4.2%. Over the same period the benchmark SPY performance was 5.9% and 4.4% respectively. Over the previous week the market value of iM-Best(Short) gained 0.44% at a time when SPY gained -1.09%. Over the period 1/2/2009 to 10/31/2016 the starting capital of $100,000 would have grown to $97,323 which includes $97,323 cash and excludes $20,544 spent on fees and slippage. |
iM-Best Reports – 10/31/2016
Posted in pmp SPY-SH
Leave a Reply
You must be logged in to post a comment.