
  |
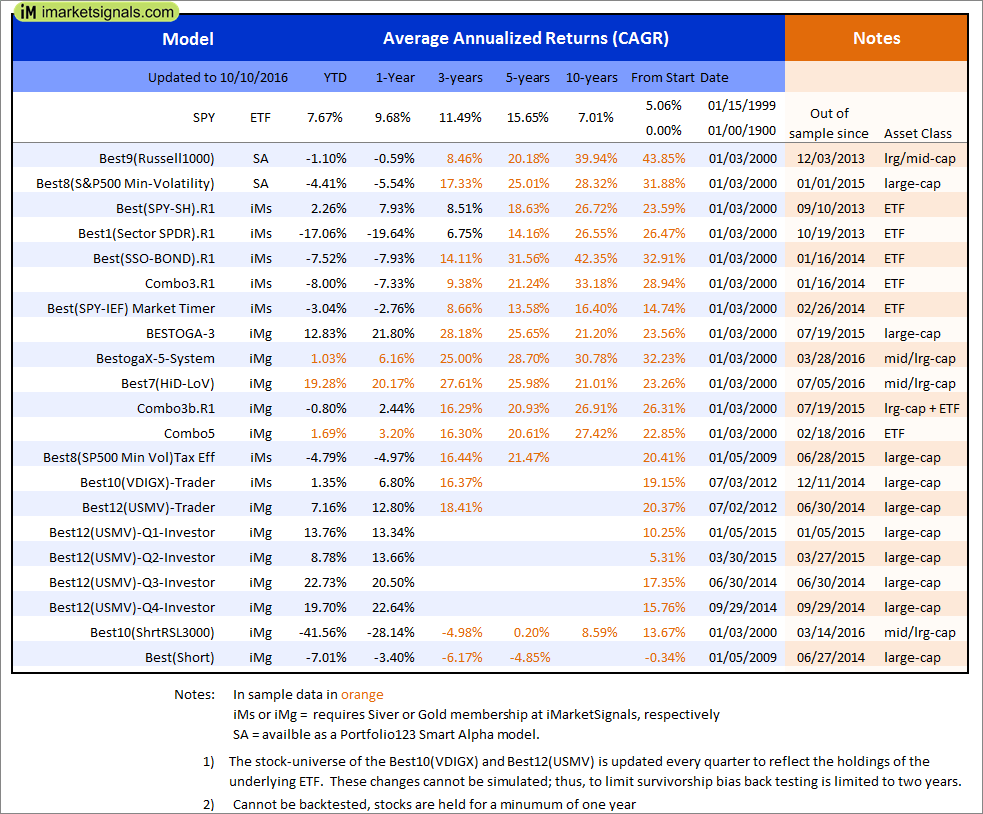
Out of sample performance summary of our models for the past 1, 2, 4 and 13 week periods. The active active return indicates how the models over- or underperformed the benchmark ETF SPY. Also the YTD, and the 1-, 3-, 5- and 10-year annualized returns are shown in the second table |
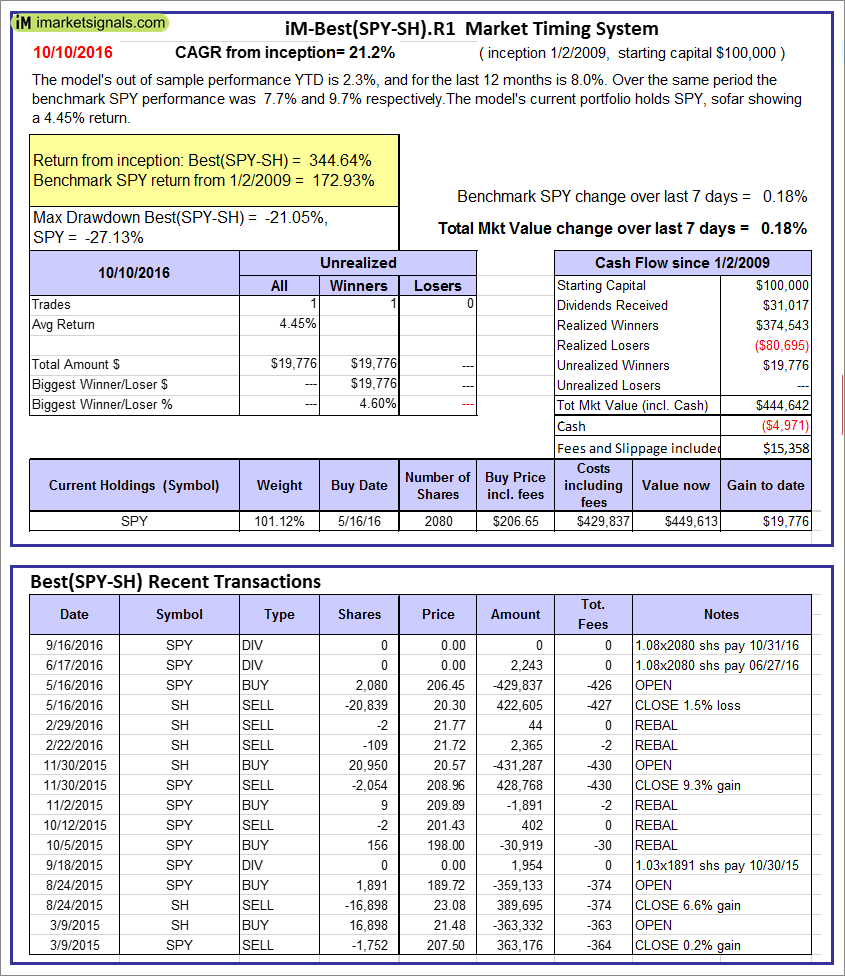 |
iM-Best(SPY-SH).R1: The model’s out of sample performance YTD is 2.3%, and for the last 12 months is 8.0%. Over the same period the benchmark SPY performance was 7.7% and 9.7% respectively. Over the previous week the market value of Best(SPY-SH) gained 0.18% at a time when SPY gained 0.18%. A starting capital of $100,000 at inception on 1/2/2009 would have grown to $444,642 which includes -$4,971 cash and excludes $15,358 spent on fees and slippage. |
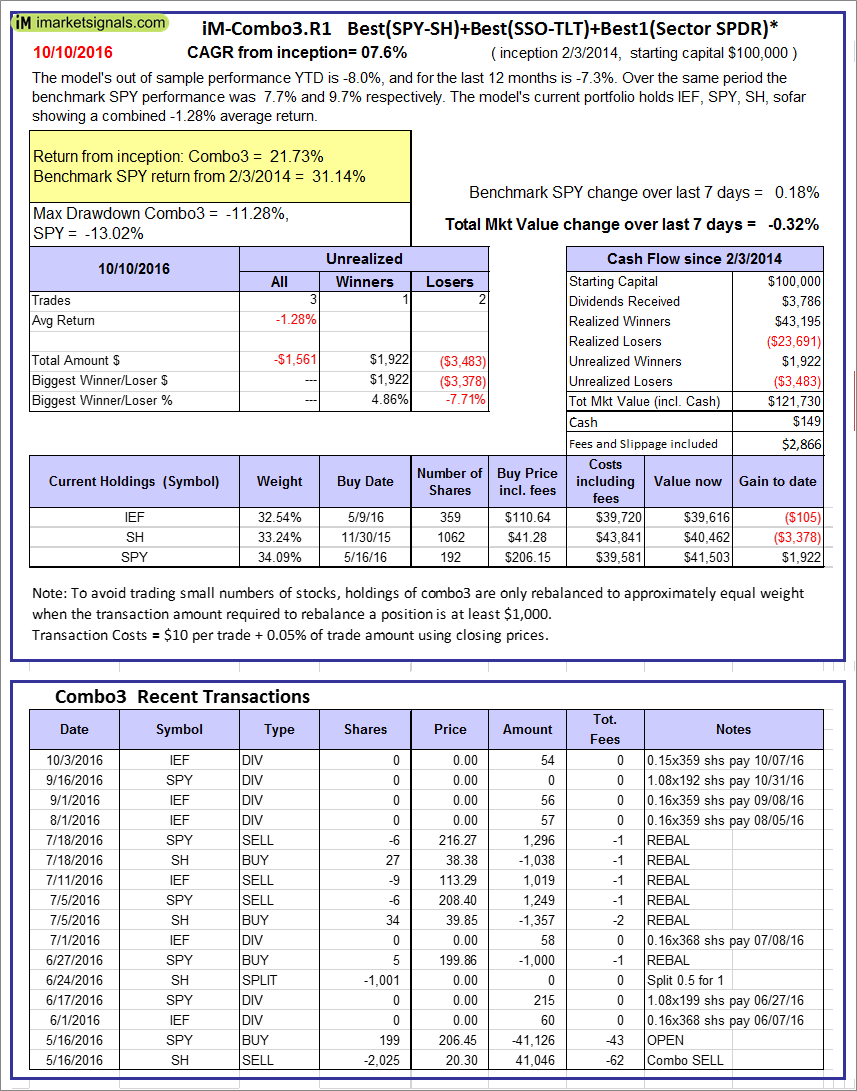 |
iM-Combo3.R1: The model’s out of sample performance YTD is -8.0%, and for the last 12 months is -7.3%. Over the same period the benchmark SPY performance was 7.7% and 9.7% respectively. Over the previous week the market value of iM-Combo3.R1 gained -0.32% at a time when SPY gained 0.18%. A starting capital of $100,000 at inception on 2/3/2014 would have grown to $121,730 which includes $149 cash and excludes $2,866 spent on fees and slippage. |
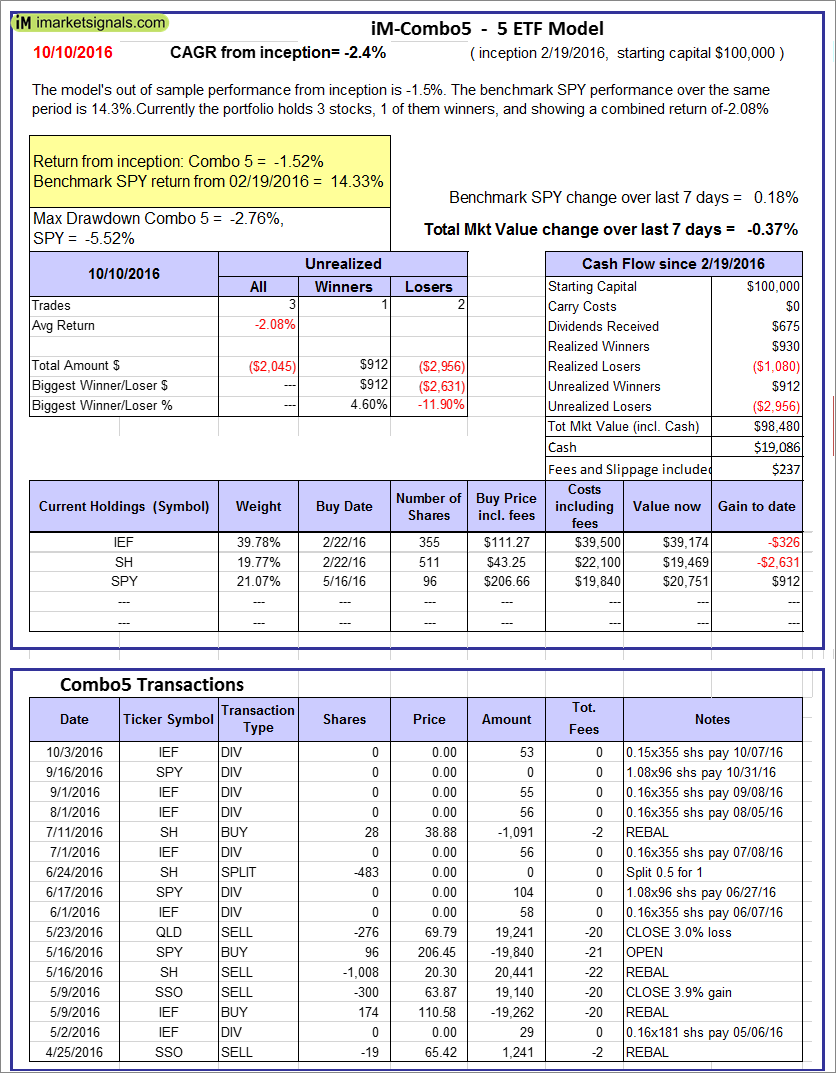 |
iM-Combo5: The model’s out of sample performance from inception is -1.5%. The benchmark SPY performance over the same period is 14.3%. Over the previous week the market value of iM-Combo5 gained -0.37% at a time when SPY gained 0.18%. A starting capital of $100,000 at inception on 2/22/2016 would have grown to $98,480 which includes $19,086 cash and excludes $237 spent on fees and slippage. |
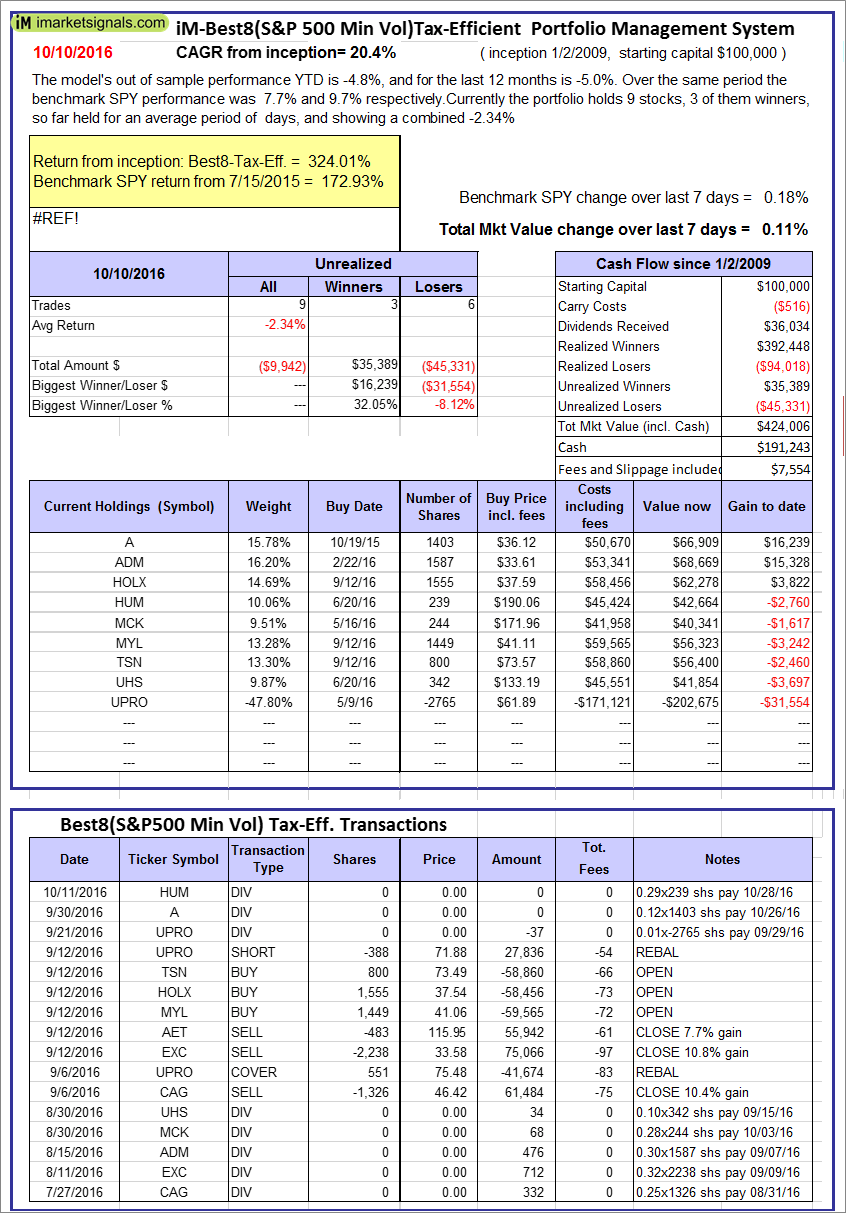 |
The iM-Best8(S&P500 Min Vol)Tax-Efficient The model’s out of sample performance YTD is -4.8%, and for the last 12 months is -5.0%. Over the same period the benchmark SPY performance was 7.7% and 9.7% respectively. Over the previous week the market value of iM-Best8(S&P 500)Tax-Eff. gained 0.11% at a time when SPY gained 0.18%. A starting capital of $100,000 at inception on 1/2/2009 would have grown to $424,006 which includes $191,243 cash and excludes $7,554 spent on fees and slippage. |
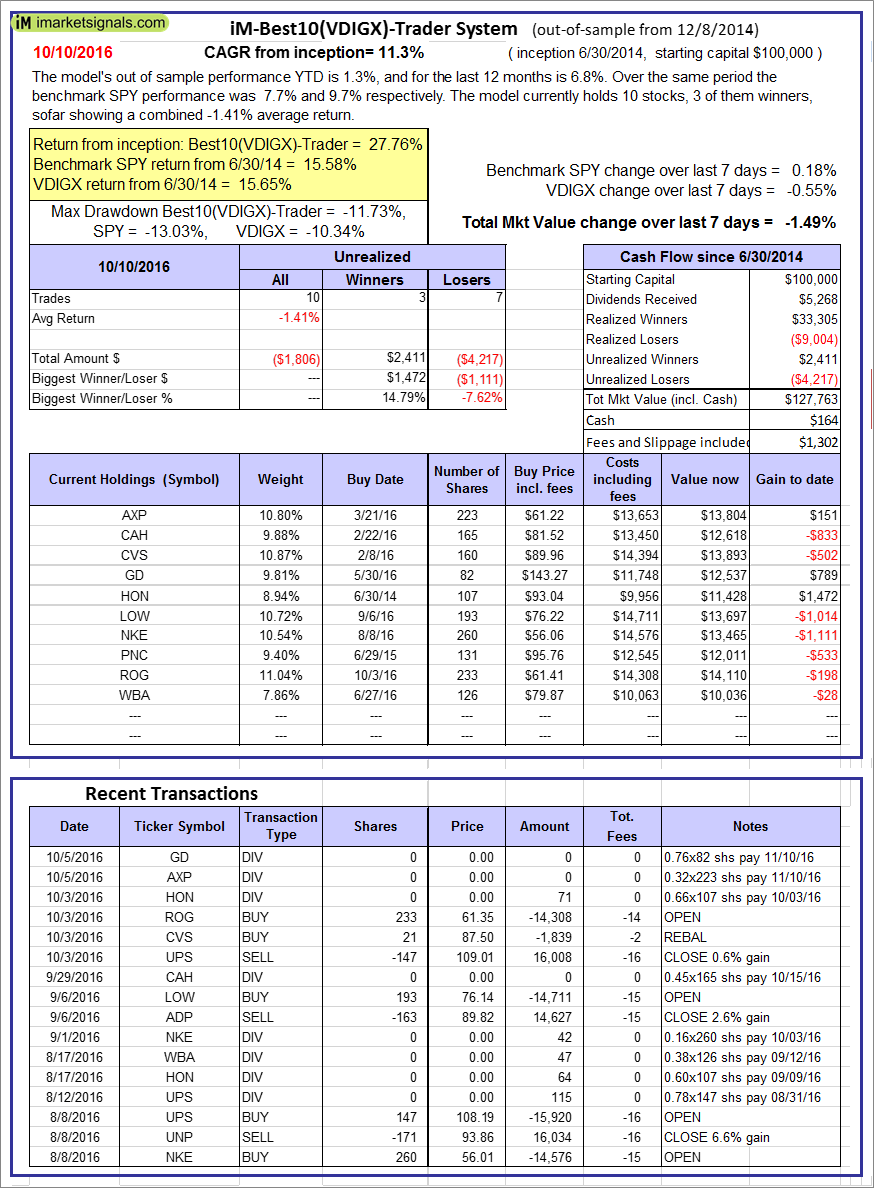 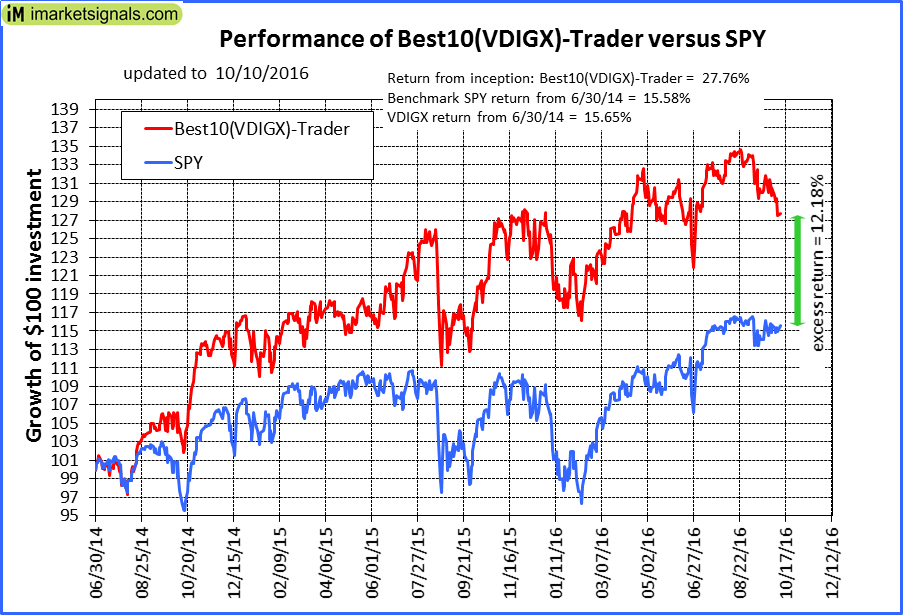 |
iM-Best10(VDIGX)-Trader: The model’s out of sample performance YTD is 1.3%, and for the last 12 months is 6.8%. Over the same period the benchmark SPY performance was 7.7% and 9.7% respectively. Since inception, on 7/1/2014, the model gained 27.76% while the benchmark SPY gained 15.58% and the ETF VDIGX gained 15.65% over the same period. Over the previous week the market value of iM-Best10(VDIGX) gained -1.49% at a time when SPY gained 0.18%. A starting capital of $100,000 at inception on 7/1/2014 would have grown to $127,763 which includes $164 cash and excludes $1,302 spent on fees and slippage. |
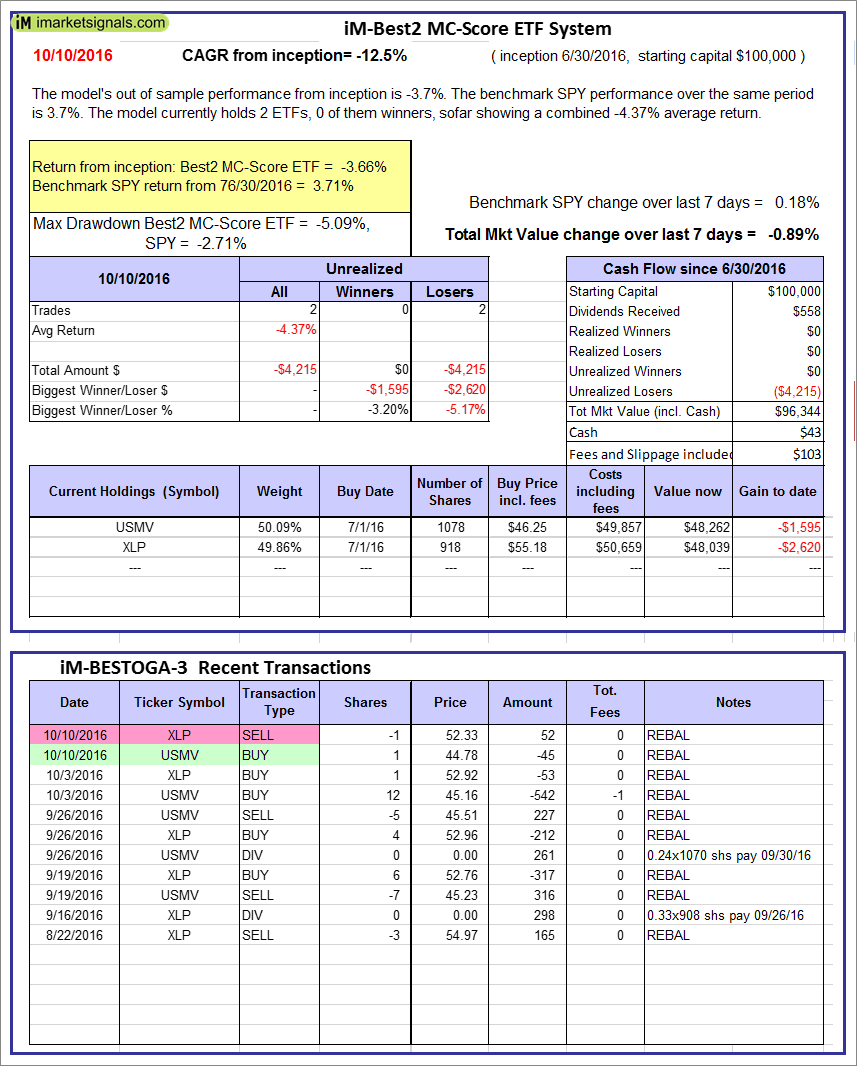 |
iM-Best2 MC-Score ETF System: The model’s out of sample performance from inception is -3.7%. The benchmark SPY performance over the same period is 3.7%. Over the previous week the market value of iM-BESTOGA-3 gained -0.89% at a time when SPY gained 0.18%. A starting capital of $100,000 at inception on 2/3/2014 would have grown to $43 which includes $103 cash and excludes Gain to date spent on fees and slippage. |
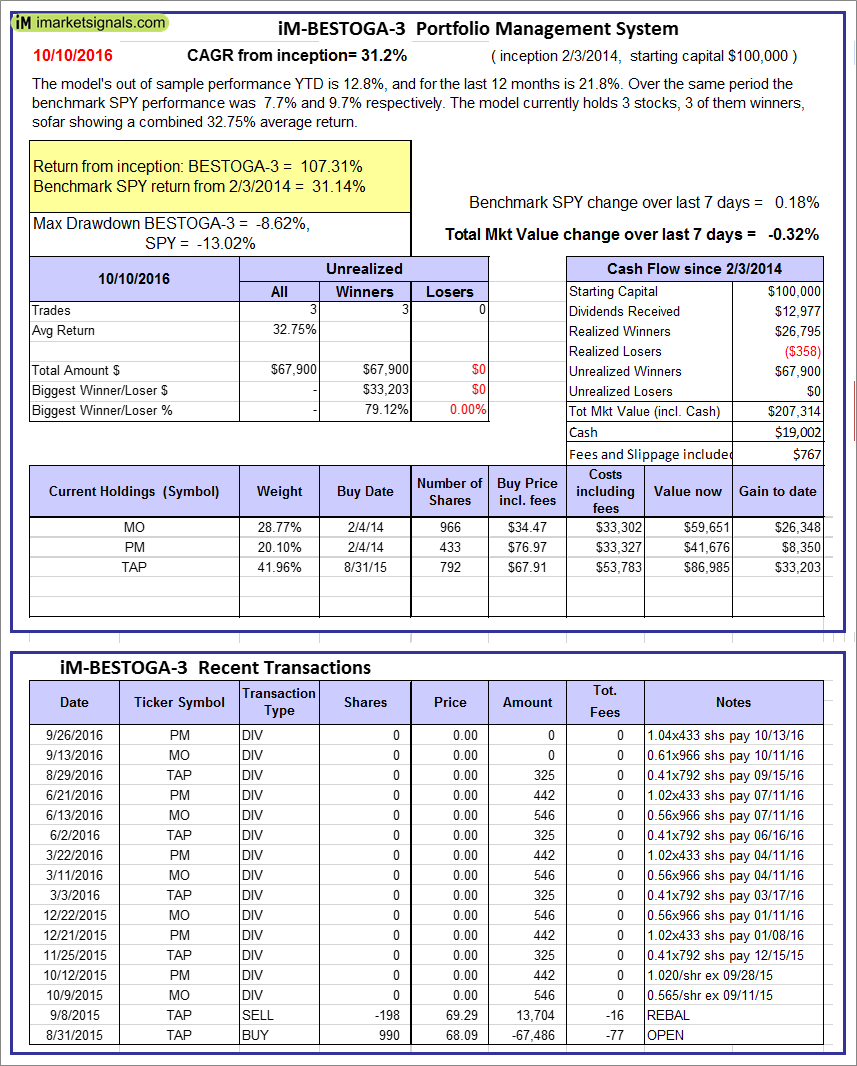 |
iM-BESTOGA-3: The model’s out of sample performance YTD is 12.8%, and for the last 12 months is 21.8%. Over the same period the benchmark SPY performance was 7.7% and 9.7% respectively. Over the previous week the market value of iM-BESTOGA-3 gained -0.32% at a time when SPY gained 0.18%. A starting capital of $100,000 at inception on 2/3/2014 would have grown to $207,314 which includes $19,002 cash and excludes $767 spent on fees and slippage. |
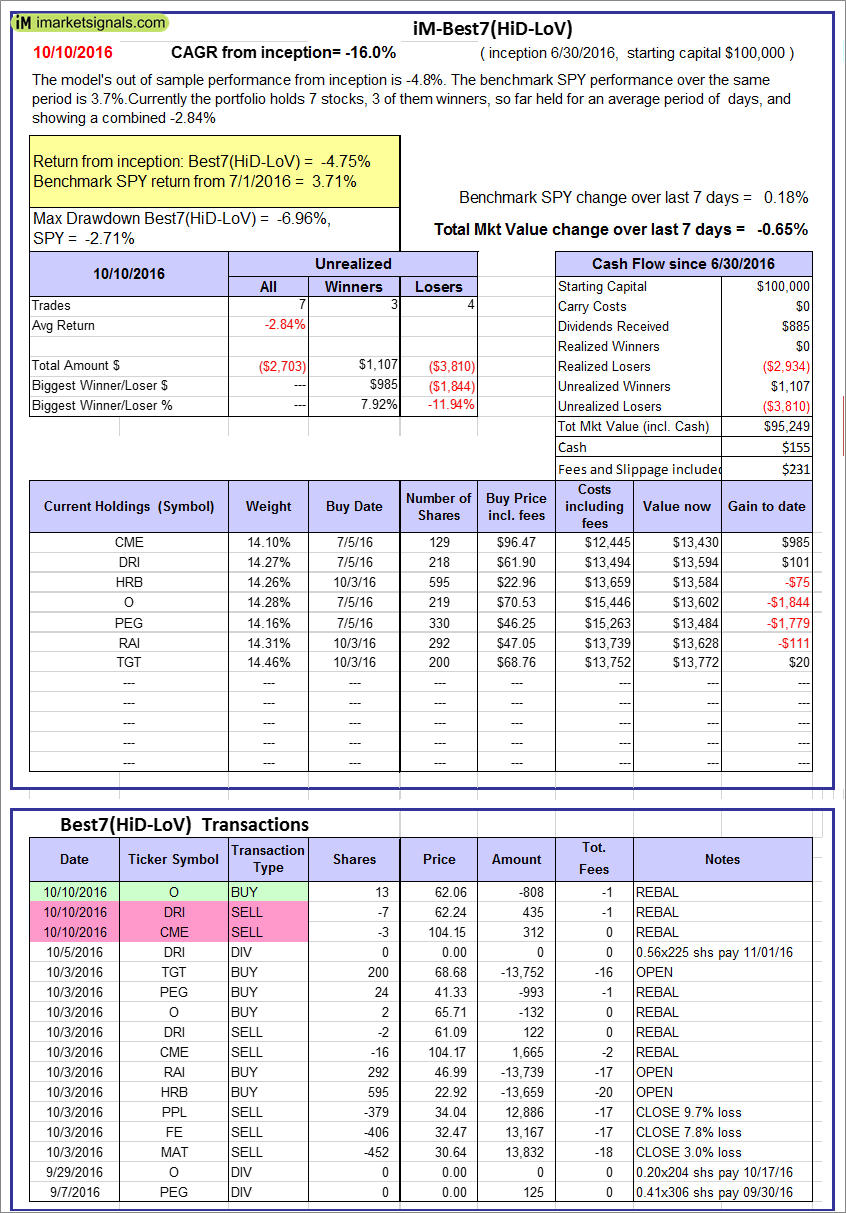 |
iM-Best7(HiD-LoV): The model’s out of sample performance from inception is -4.8%. The benchmark SPY performance over the same period is 3.7%. Over the previous week the market value of iM-BESTOGA-3 gained -0.65% at a time when SPY gained 0.18%. A starting capital of $100,000 at inception on 2/3/2014 would have grown to $95,249 which includes $155 cash and excludes $231 spent on fees and slippage. |
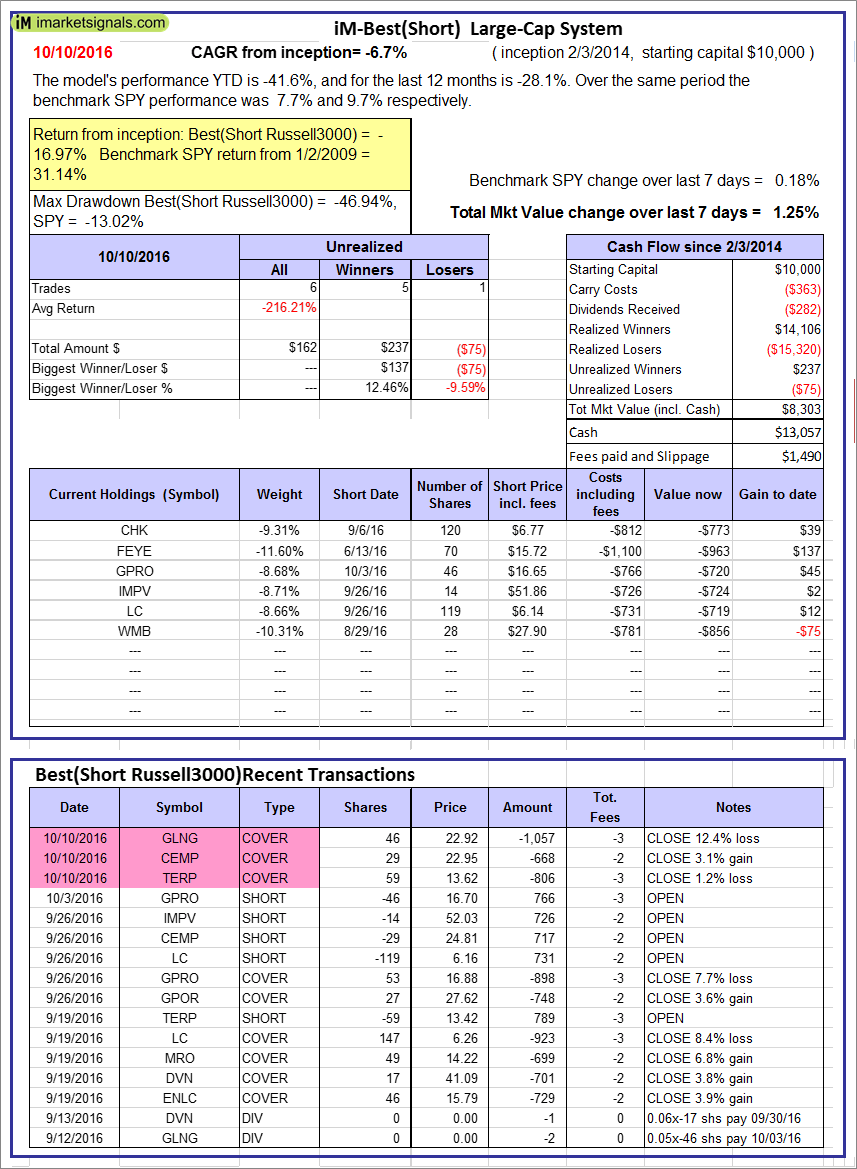 |
iM-Best10(Short Russell3000): The model’s performance YTD is -41.6%, and for the last 12 months is -28.1%. Over the same period the benchmark SPY performance was 7.7% and 9.7% respectively. Over the previous week the market value of iM-Best10(Short Russell3000) gained 1.25% at a time when SPY gained 0.18%. Over the period 2/3/2014 to 10/10/2016 the starting capital of $100,000 would have grown to $8,303 which includes $13,057 cash and excludes $1,490 spent on fees and slippage. |
 |
iM-BestogaX5-System: The model’s out of sample performance from inception is -8.8%. The benchmark SPY performance over the same period is 7.5%. Over the previous week the market value of iM-Best8(S&P 500)Tax-Eff. gained -1.49% at a time when SPY gained 0.18%. A starting capital of $100,000 at inception on 1/2/2009 would have grown to $91,219 which includes $19,946 cash and excludes $285 spent on fees and slippage. |
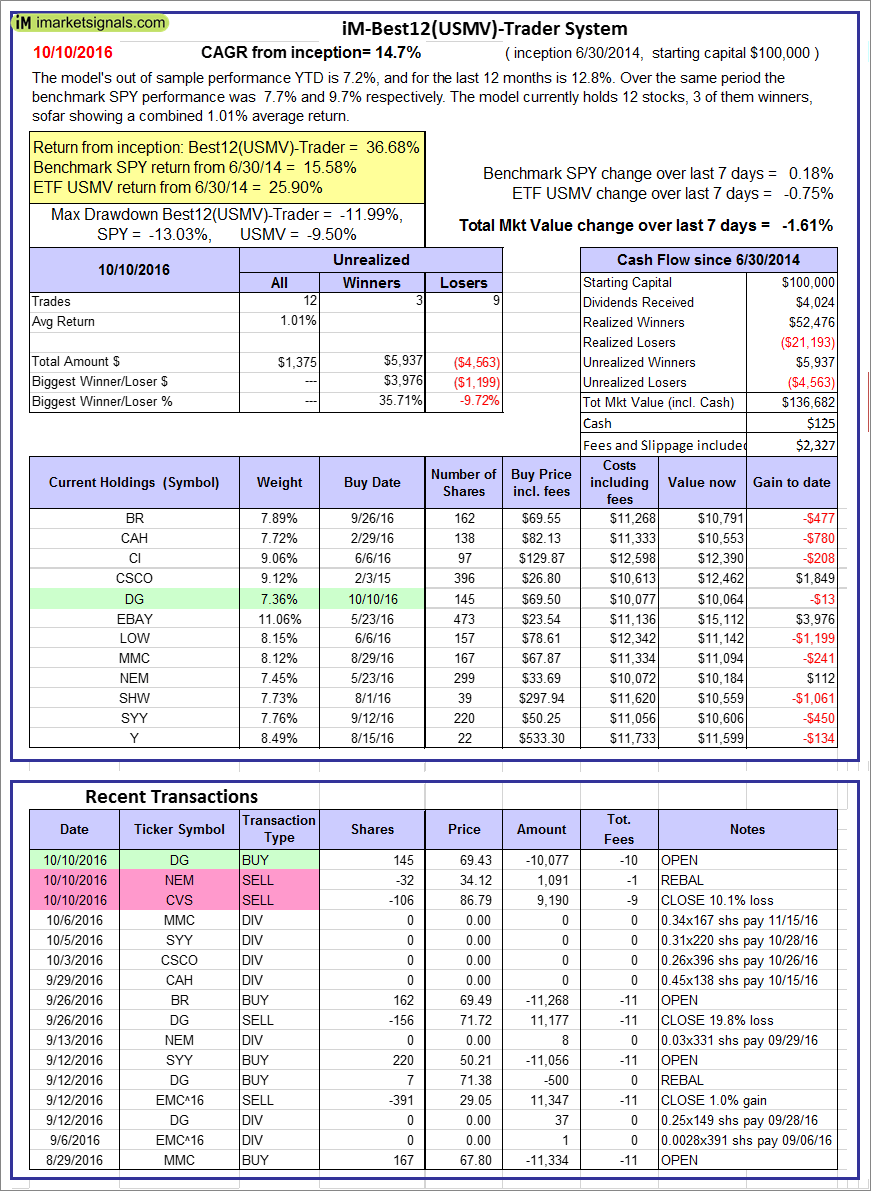 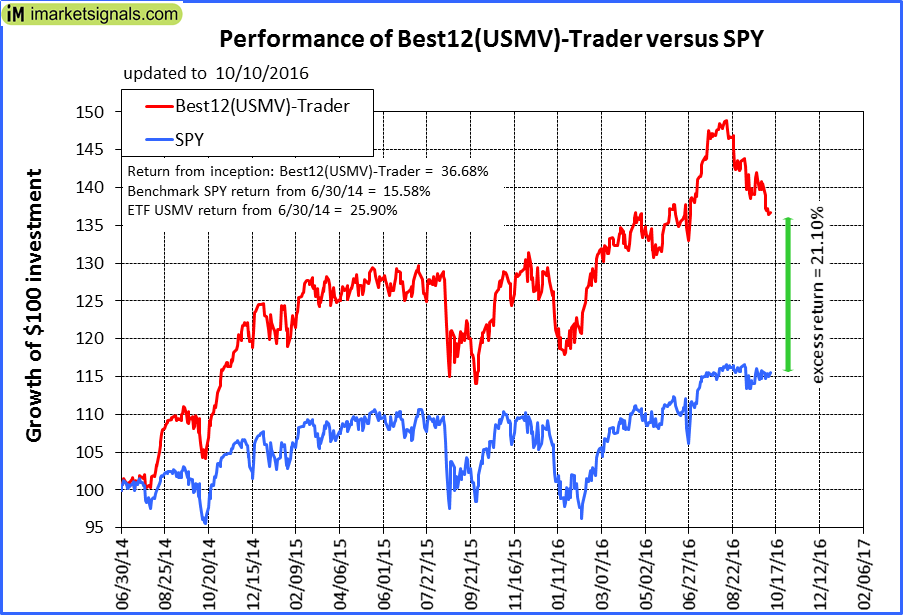 |
iM-Best12(USMV)-Trader: The model’s out of sample performance YTD is 7.2%, and for the last 12 months is 12.8%. Over the same period the benchmark SPY performance was 7.7% and 9.7% respectively. Since inception, on 7/1/2014, the model gained 36.68% while the benchmark SPY gained 15.58% and the ETF USMV gained 25.90% over the same period. Over the previous week the market value of iM-Best12(USMV)-Trader gained -1.61% at a time when SPY gained 0.18%. A starting capital of $100,000 at inception on 7/1/2014 would have grown to $136,682 which includes $125 cash and excludes $2,327 spent on fees and slippage. |
 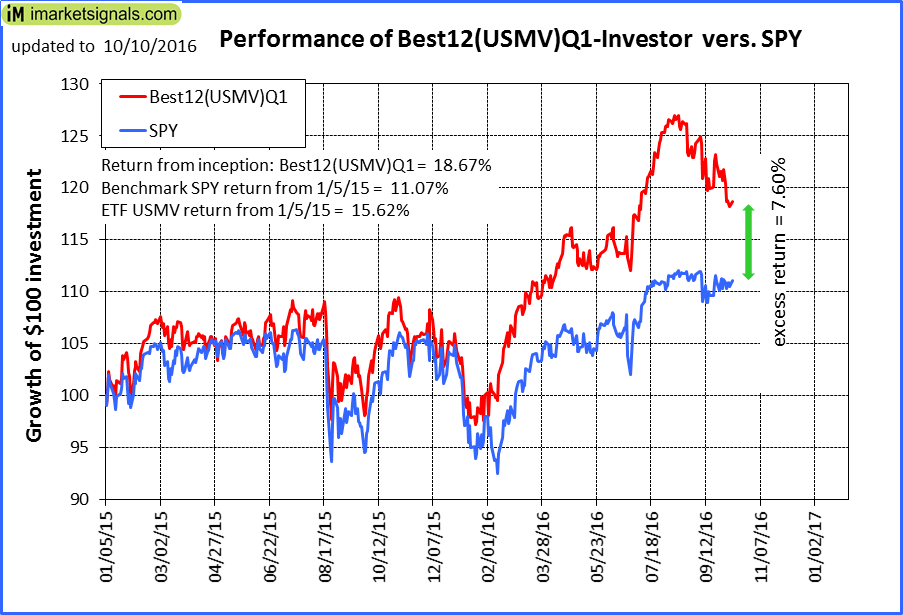 |
iM-Best12(USMV)Q1-Investor: The model’s out of sample performance YTD is 13.8%, and for the last 12 months is 13.3%. Over the same period the benchmark SPY performance was 7.7% and 9.7% respectively. Since inception, on 1/5/2015, the model gained 18.67% while the benchmark SPY gained 11.07% and the ETF USMV gained 15.62% over the same period. Over the previous week the market value of iM-Best12(USMV)Q1 gained -1.47% at a time when SPY gained 0.18%. A starting capital of $100,000 at inception on 1/5/2015 would have grown to $118,673 which includes $396 cash and excludes $519 spent on fees and slippage. |
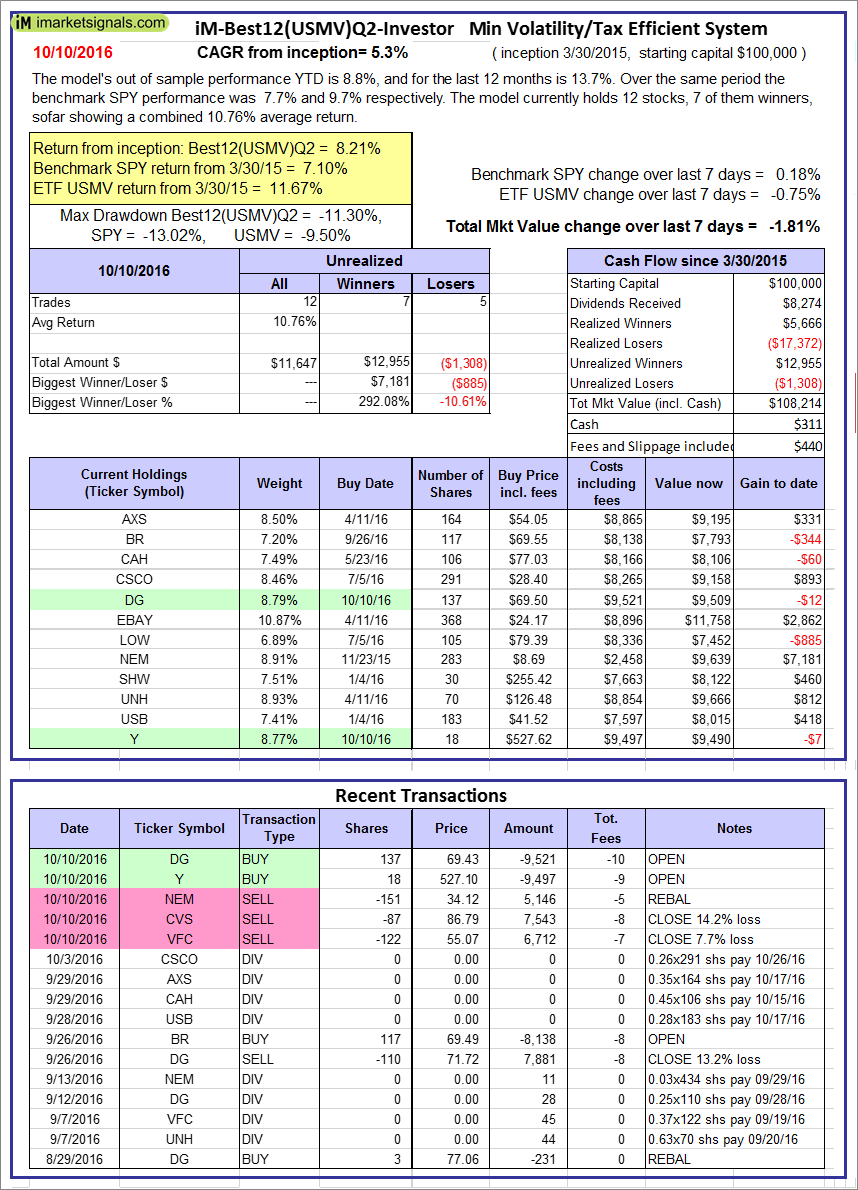 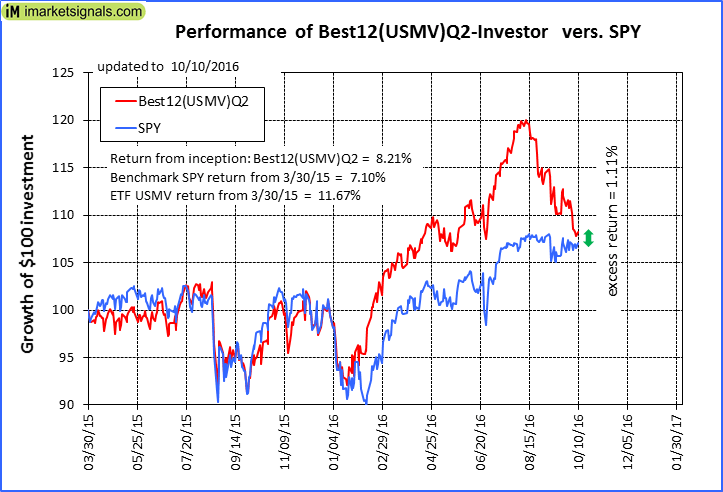 |
iM-Best12(USMV)Q2-Investor: The model’s out of sample performance YTD is 8.8%, and for the last 12 months is 13.7%. Over the same period the benchmark SPY performance was 7.7% and 9.7% respectively. Since inception, on 3/31/2015, the model gained 8.21% while the benchmark SPY gained 7.10% and the ETF USMV gained 11.67% over the same period. Over the previous week the market value of iM-Best12(USMV)Q2 gained -1.81% at a time when SPY gained 0.18%. A starting capital of $100,000 at inception on 3/31/2015 would have grown to $108,214 which includes $311 cash and excludes $440 spent on fees and slippage. |
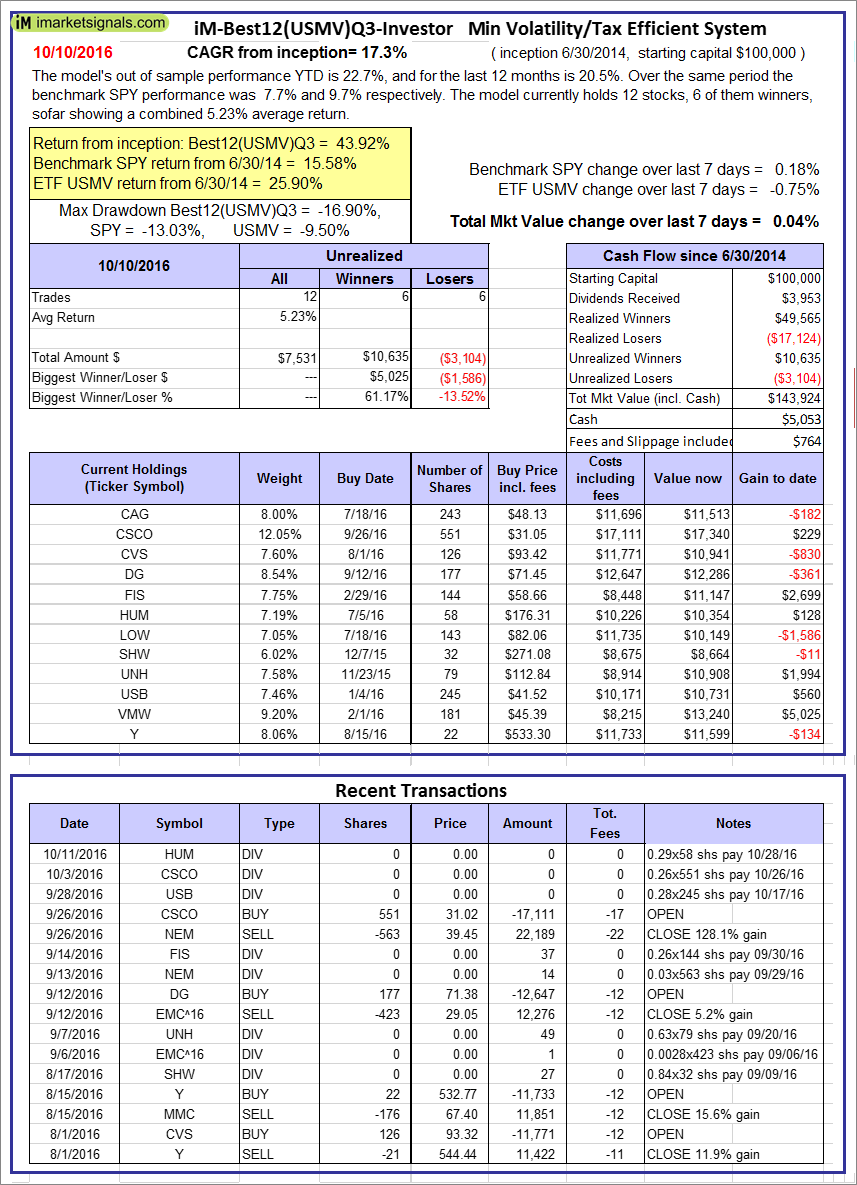 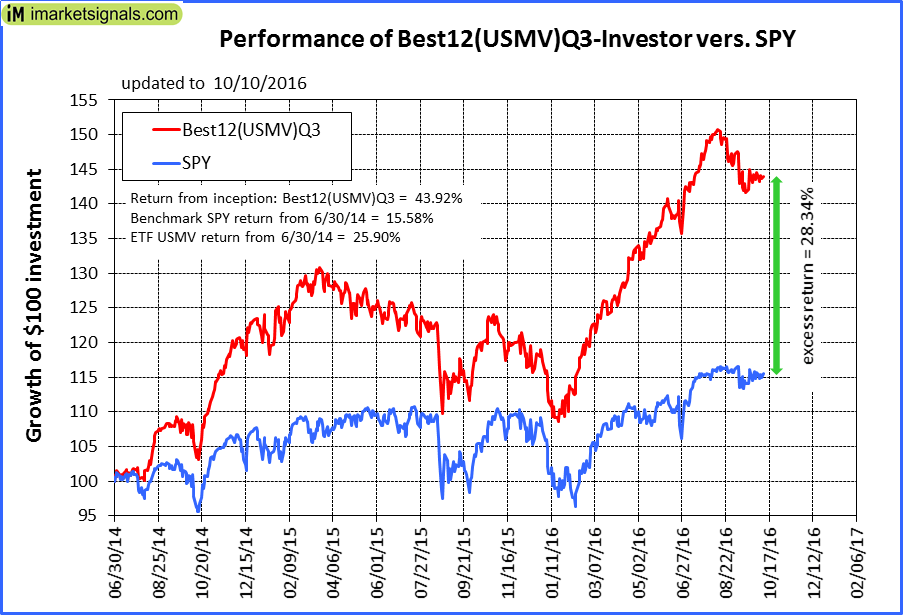 |
iM-Best12(USMV)Q3-Investor: The model’s out of sample performance YTD is 22.7%, and for the last 12 months is 20.5%. Over the same period the benchmark SPY performance was 7.7% and 9.7% respectively. Since inception, on 7/1/2014, the model gained 43.92% while the benchmark SPY gained 15.58% and the ETF USMV gained 25.90% over the same period. Over the previous week the market value of iM-Best12(USMV)Q3 gained 0.04% at a time when SPY gained 0.18%. A starting capital of $100,000 at inception on 7/1/2014 would have grown to $143,924 which includes $5,053 cash and excludes $764 spent on fees and slippage. |
 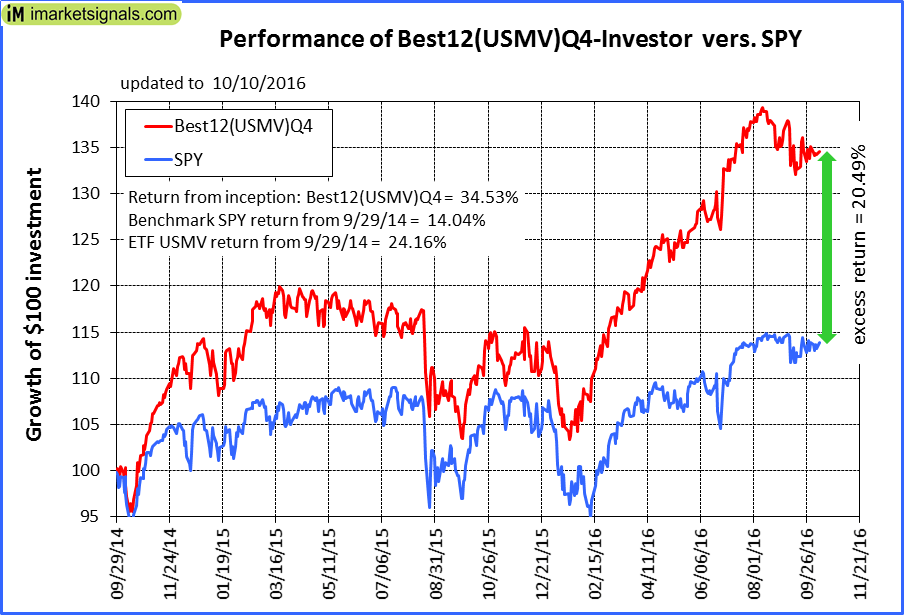 |
iM-Best12(USMV)Q4-Investor: Since inception, on 9/30/2014, the model gained 34.53% while the benchmark SPY gained 14.04% and the ETF USMV gained 24.16% over the same period. Over the previous week the market value of iM-Best12(USMV)Q4 gained 0.09% at a time when SPY gained 0.18%. A starting capital of $100,000 at inception on 9/30/2014 would have grown to $134,526 which includes -$72 cash and excludes $610 spent on fees and slippage. |
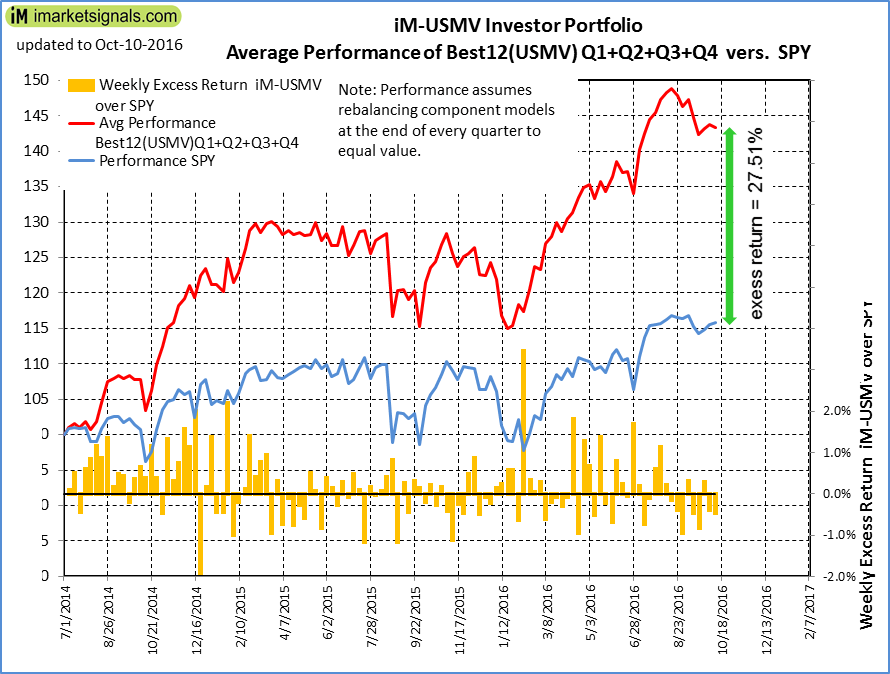 |
Average Performance of iM-Best12(USMV)Q1+Q2+Q3+Q4-Investor resulted in an excess return of 27.51% over SPY. (see iM-USMV Investor Portfolio) |
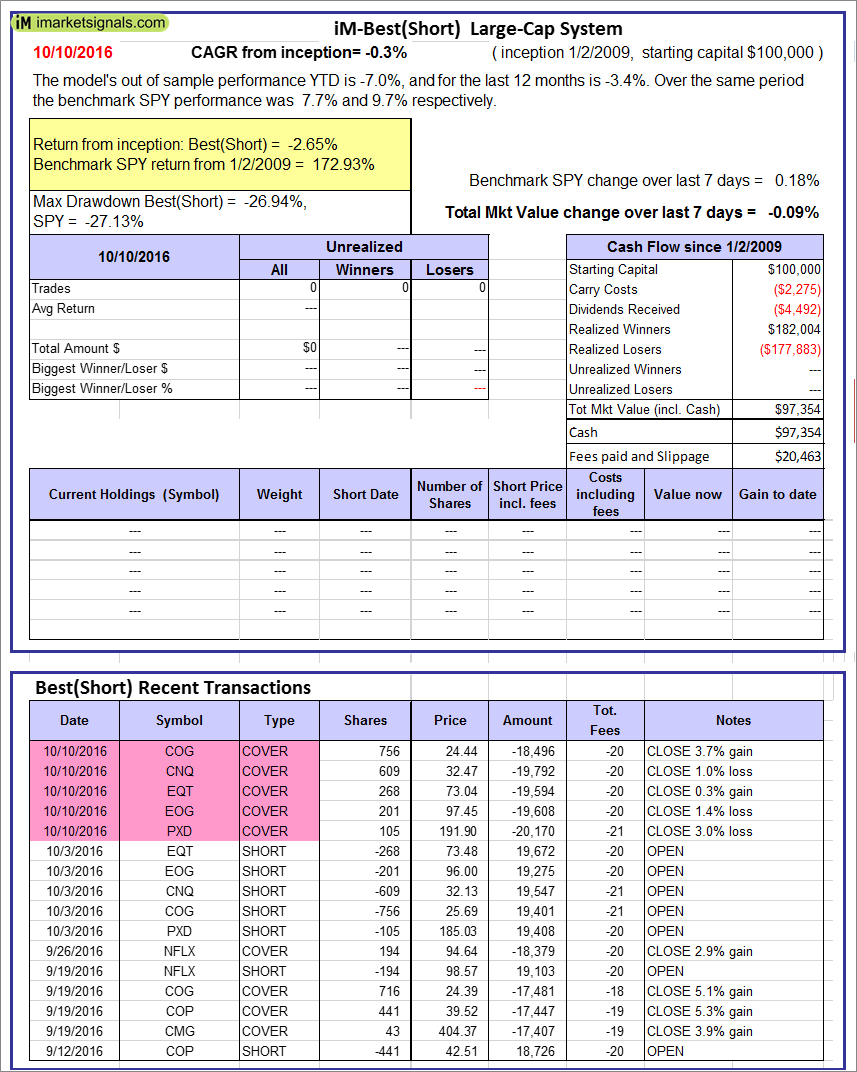 |
iM-Best(Short): The model’s out of sample performance YTD is -7.0%, and for the last 12 months is -3.4%. Over the same period the benchmark SPY performance was 7.7% and 9.7% respectively. Over the previous week the market value of iM-Best(Short) gained -0.09% at a time when SPY gained 0.18%. Over the period 1/2/2009 to 10/10/2016 the starting capital of $100,000 would have grown to $97,354 which includes $97,354 cash and excludes $20,463 spent on fees and slippage. |
iM-Best Reports – 10/10/2016
Posted in pmp SPY-SH
Leave a Reply
You must be logged in to post a comment.