
For the period 2001-2016 the buy&hold strategy no longer worked! It is likely that it will also not work in the future due to increasing stock market volatility. For this reason some investor use simple market timing, mostly momentum driven, to exit and enter the markets according to market direction. Instead of relying on just one market timer, many uncorrelated market timing strategies can be designed from the comprehensive and diverse financial data that is readily available, and then combining them in a robust composite market timing model. We designed six such component timers using following:
- Unemployment Rate (UNEMP),
- Performance of the Hi-Beta and Lo-Beta stocks of the S&P 500,
- TED Spread,
- Market Climate Score,
- iM Standard Timer,
- CBOE Volatility Index VIX.
A short description of each timer follows after the two tables below. Table-1 lists the performance measured when switching between SPY and IEF, and Table-2 lists the correlation between the timers themselves plus SPY. Note the low inter-timer correlations, which would indicate robustness for a combination system of these timers.
| Table 1: Performance from February 2001 to August 2016. | ||||||
|---|---|---|---|---|---|---|
| UNEMP Timer |
Hi-Lo Beta Timer |
TED Spread Timer |
MC-Score Timer |
iM Std Timer |
VIX Timer |
|
| Total Return: | 729% | 524% | 311% | 393% | 474% | 165% |
| Benchmark Return: | 120% | 120% | 120% | 120% | 120% | 120% |
| Active Return: | 608% | 404% | 191% | 272% | 354% | 45% |
| Annualized Return: | 14.6% | 12.5% | 9.5% | 10.8% | 11.9% | 6.5% |
| Annual Turnover: | 206% | 269% | 146% | 234% | 338% | 482% |
| Max Drawdown: | -19% | -16% | -37% | -14% | -27% | -23% |
| SPY Max Drawdown: | -55% | -55% | -55% | -55% | -55% | -55% |
| Overall Winners: | (28/34) 82% |
(29/44) 66% |
(18/24) 75% |
(29/38) 76% |
(40/55) 73% |
(46/77) 60% |
| Sharpe Ratio: | 1.13 | 1.12 | 0.77 | 1.11 | 0.99 | 0.56 |
| Correlation With SPY: | 0.46 | 0.33 | 0.56 | 0.11 | 0.33 | 0.09 |
| Table-2: Correlation Matrix Between All Timers Plus SPY | |||||||
|---|---|---|---|---|---|---|---|
| SPY | UNEMP Timer |
Hi-Lo Beta Timer |
TED Spread Timer |
MC-Score Timer |
iM Std Timer |
VIX Timer |
|
| SPY: | – | 0.46 | 0.33 | 0.56 | 0.11 | 0.33 | 0.09 |
| UNEMP Timer: | 0.46 | – | 0.27 | 0.15 | 0.62 | 0.42 | 0.14 |
| Hi-Lo Beta Timer: | 0.33 | 0.27 | – | 0.33 | 0.35 | 0.38 | 0.15 |
| TED Spread Timer: | 0.56 | 0.15 | 0.33 | – | 0.12 | 0.25 | 0.07 |
| MC-Score Timer: | 0.11 | 0.62 | 0.35 | 0.12 | – | 0.42 | 0.31 |
| iM Standard Timer: | 0.33 | 0.42 | 0.38 | 0.25 | 0.42 | – | 0.22 |
| VIX Timer: | 0.09 | 0.14 | 0.15 | 0.07 | 0.31 | 0.22 | – |
The above results, for the period 2001 to 2016, come from simulations performed on the on-line portfolio simulation platform Portfolio 123, which also provides extended price data for ETFs prior to their inception dates calculated from their proxies.
1. The Unemployment Timer
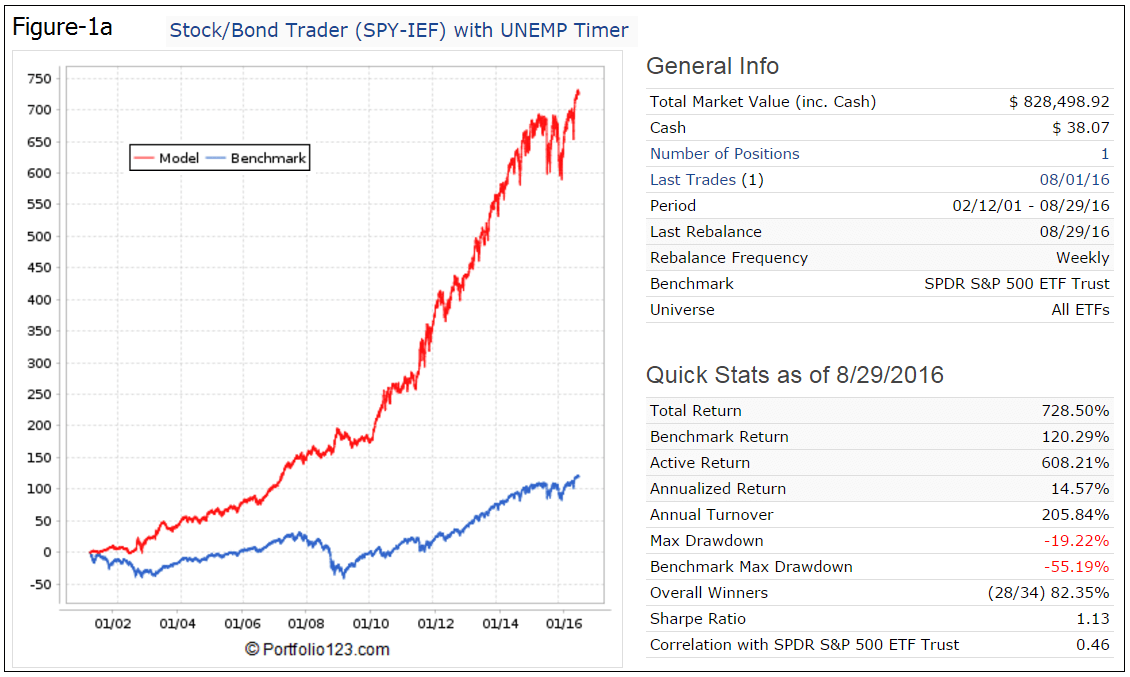
This market timer is described in detail here, its rules are:
- Rule for exiting the stock market and entering the bond market: If the unemployment rate is higher than three months ago; the model exits the stock market and enters the stock market.
- Rule for exiting the bond market and entering the stock market: If the unemployment rate is equal or lower than where it was three months ago; the model exits the bond market and enters the stock market.
The P123 backtest elected either the SPDR S&P 500 ETF (SPY), the ETF tracking the S&P 500, or the iShares 7-10 Year Treasury Bond ETF (IEF) as the bond fund. The P123 backtest performance showed an average annual return of 14.6% versus 5.2% for buy&hold SPY.
An extended manual backtest for the period 1974 to 2016 was also performed. From the analysis it appears that the Unemployment Rate can profitably be used as a market timer. Switching between stocks and bonds provided the same return from 1973 to 2001 as buy&hold stocks, but from 2001 to 2016 timing provided much higher returns; it can be considered free insurance against major market down-turns, as occurred from 2001 to 2003, and 2008 to 2009.
2. The Hi-Lo Beta Timer
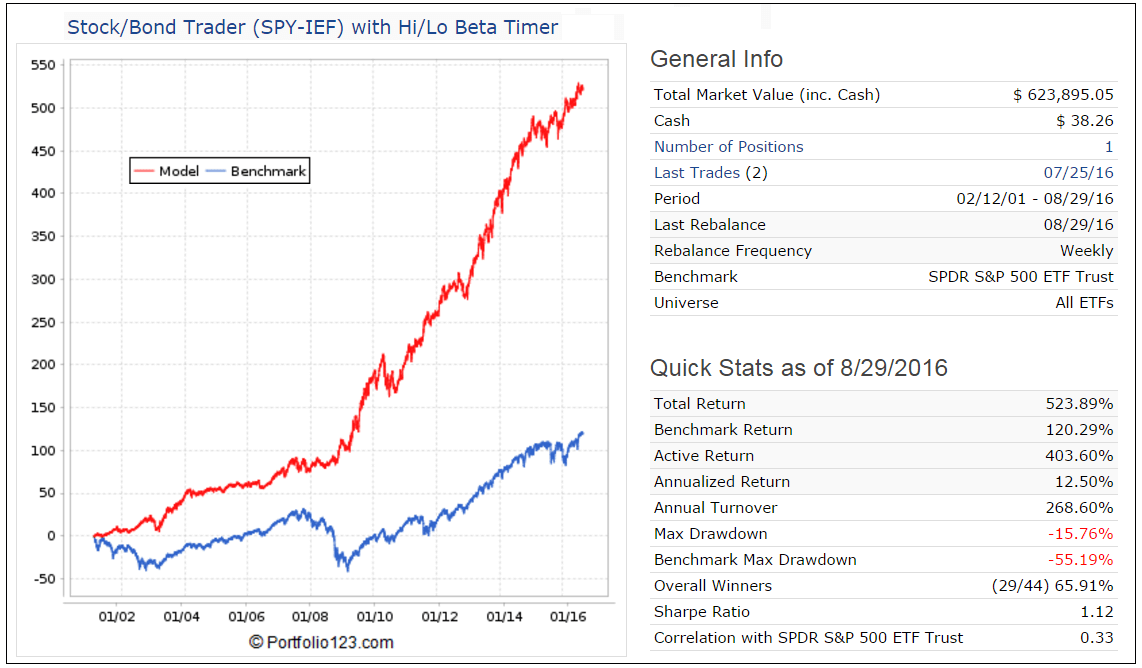
This indicator was first identified by Steve Auger of Stock Market Student. Hi-Beta and Lo-Beta are defined as the aggregate values representing all S&P 500 stocks that meet the criteria “Beta > 1.5″ or “Beta < 0.75”, respectively. The aggregate value is the Market-Cap-weighted average of the performance over a specific period. This market timer’s rules are:
- Rule for exiting the stock market and entering the bond market: Performance of the Hi-Beta stocks is lower than, or equal to Lo-Beta stocks.
- Rule for exiting the bond market and entering the stock market: Performance of the Hi-Beta stocks is higher than Lo-Beta stocks.
Hi-Beta and Lo-Beta are smoothed with a 40-week Exponential Moving Average (EMA), and the signal to enter the stock market is given when the 40-week EMA of Hi-Beta > 40-week EMA of Lo-Beta.
The simulated performance using this indicator and switching between SPDR S&P 500 ETF (SPY), the ETF tracking the S&P 500, and iShares 7-10 Year Treasury Bond (IEF) showed an average annual return of 12.5%.
3. The TED Spread Timer
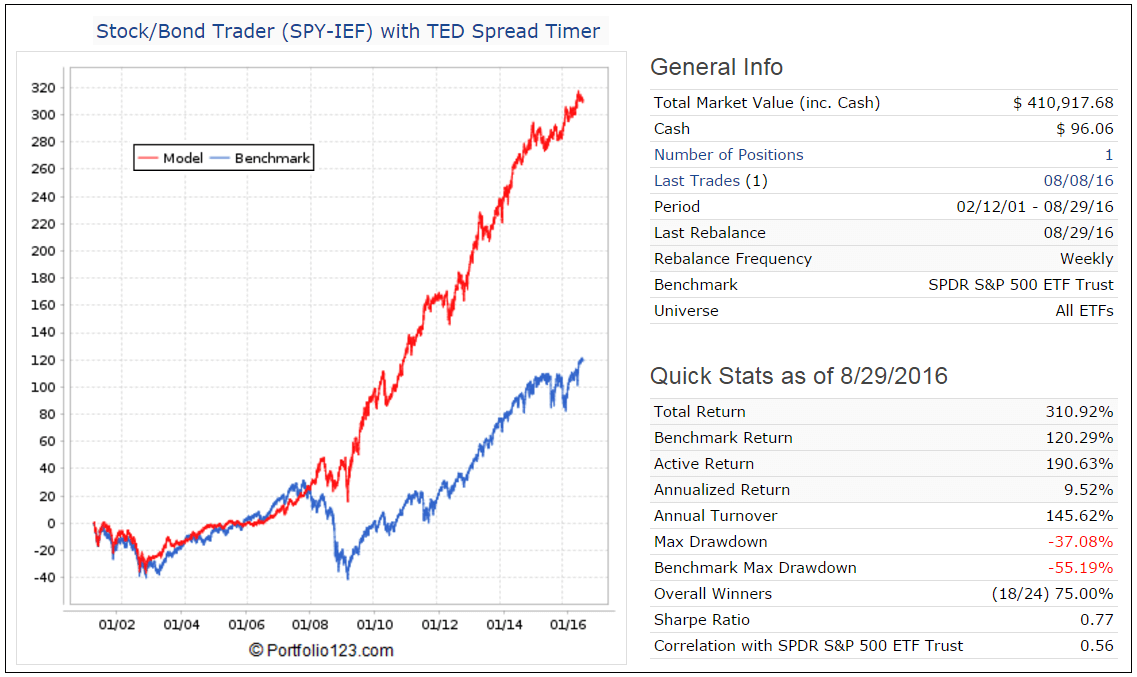
One measure that reflects the strain in financial markets is the TED spread. It is the difference between 3-month LIBOR (an average of interest rates offered in the London interbank market for 3-month dollar-denominated loans) and the 3-month Treasury bill rate, the size of this gap reflecting risk in the financial markets.
This market timing indicator was first identified by Steve Auger:
-
When the 50-day moving average of the TED spread becomes less than its 200-day moving average the model signals investment in the stock market, otherwise investment in bonds.
The simulated performance using this indicator and switching between SPDR S&P 500 ETF (SPY), the ETF tracking the S&P 500, and the iShares 7-10 Year Treasury Bond (IEF) gives an average annual return of 9.5%.
4. MC-Score Timer

The MC-Score is an iMarketsignal proprietary market climate assessing system, a detailed description of the system can be found here.
Four different approaches are used to assess market climate which are based on economic, momentum and sentiment indicators. From those a score is calculated ranging from 0 to 4, indicating the best to worst market climate, respectively, for investment in equities.
- When the MC-Score = 0 the models enters the stock market, otherwise it is in the bond market.
The simulated performance using this indicator and switching between SPDR S&P 500 ETF (SPY), the ETF tracking the S&P 500, and the iShares 7-10 Year Treasury Bond (IEF) gives an average annual return of 10.8%.
5. CMP-Standard Timer
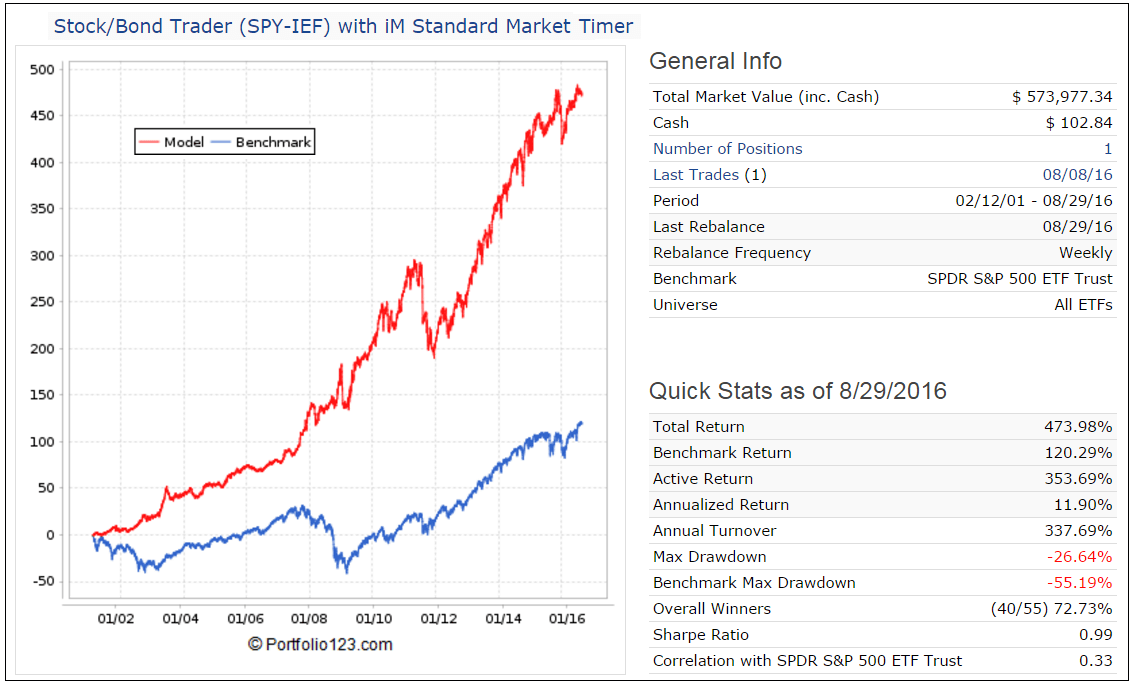
The CMP-Standard Market Timer, an iMarketSignal proprietary timer, it is a S&P 500 momentum driven indicator and is similar to the one described in our previous article. This timer endeavors to signal periods when it may be advantageous to exit the market or hedge one’s portfolio of stocks
The simulated performance using this indicator and switching between SPDR S&P 500 ETF (SPY), the ETF tracking the S&P 500, and the iShares 7-10 Year Treasury Bond (IEF) gives an average annual return of 11.9%
6. The VIX Timer
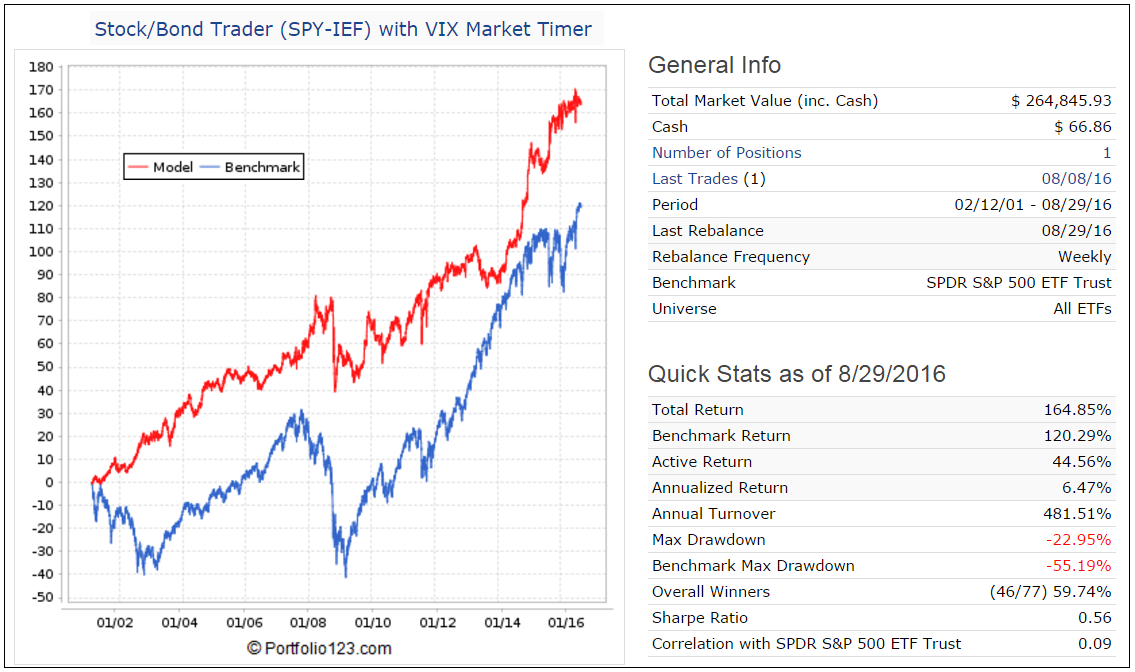
The VIX Market Timer is an indicator that extracts its timing signals form a combination the CBOE Volatility Index (VIX), and the Risk Premium – the difference between the Current Estimated Earnings Yield of the S&P500 and the Treasury 10-yr Note Yield.
The simulated performance using this indicator and switching between SPDR S&P 500 ETF (SPY), the ETF tracking the S&P 500, and the iShares 7-10 Year Treasury Bond (IEF) gives an average annual return of 6.5%.
Conclusion
From the analysis it appears that the above six market times can profitably be used for market timing. However, rising interest rates with concurrent diminishing returns from bonds may reduce the effectiveness of these models. Although the model performed well over the last 15 years, there is no evidence that they would have produced similar returns before the backtest period, nor is there a guarantee that they will perform well in the future.
Appendix
Beta is a measure of the volatility, or systematic risk, of a security or a portfolio in comparison to the market as a whole. A beta of 1 indicates that the security’s price will move with the market. A beta of less than 1 means that the security will be less volatile than the market. A beta of greater than 1 indicates that the security’s price will be more volatile than the market. For example, if a stock’s beta is 1.2, it’s theoretically 20% more volatile than the market. (return to The Hi-Lo Beta Timer).
The TED spread may recently have has lost some credibility in signaling stress in the financial markets. It just hit its highest level in over seven years apparently caused by recent changes in U.S. money-market regulations which will make money-market funds less appealing as short-term investments.
According to a Sep-22-2016 Wall Street Journal report “… the coming rules have put investors off from investing in many money-market funds. With less demand, the short-term commercial debt that the funds typically invested in has become more costly to its issuers. Higher borrowing costs for the private sector generally are reflected in the rates that banks lend to each other and so Libor rises.”
However, once the adjustments caused by the new regulations have been absorbed, rises in the TED spread should again signal financial stress, in our opinion. (return to The TED Spread Timer)
Hi Georg,
thank you for this more than valuable information. Part of this was already discussed at P123.
Are you going to set up a model here which will combine these indicators into one new “Combined Market Timer”?
That would be extremely useful.
Yes, we will have the Composite Market Timer available here at iM beginning of October 2016. It should be quite robust, because if one or two of the component models “bomb out” the other four can take over.
I agree that the Ted spread spikes are a good signal that a downturn is coming. However, given your moving average rules, this model would not have protected you from the ’87 crash, I checked. I think a better sell rule is: calculate monthly average Ted spread (also found in FRED)-> Whenever there is a Ted Spread “spike” above 1.2 get out of the market for three months-> If the Ted spread normalizes to 40, get back into the market regardless of the previous rule.
Georg,
You should also look at the LEI as a signal to get defensive. LEI has historically dropped below its six-month moving average anywhere between 2 to 15 months before a recession. See the link below.
https://www.advisorperspectives.com/dshort/updates/2018/09/20/conference-board-leading-economic-index-economy-will-continue-expanding-through-2018
We monitor the growth rate of the Conference Board LEI. See this Feb-2012 article “Evaluating Popular Recession Indicators”
https://www.advisorperspectives.com/articles/2012/02/21/evaluating-popular-recession-indicators
Oh yeah, here is another model idea. Usually stocks fall when earnings growth drops below 0%. You can check earnings growth by following Yardeni Research (see below).
https://www.yardeni.com/pub/peacocksp500.pdf
Agree, stocks typically gain if annual earnings growth is positive. Current Trailing Twelve Month earnings growth is about 16% according to our custom series running on Portfolio 123.
Georg,
First-time commenter here, Given the recent downturn since late August, negative market sentiment has been rising, and some articles this week seem to have been forecasting worse. This looks like it’s becoming consenses, which makes me contrarian and optimistic. Yet, the largest concern I see is the trade war overhang and the 1/1, 25% tariff concern. But, I’m convinced Trump knows his 2020 re-election is at risk of the trade war triggering a recession. He controls to a great degree the decision for a settlement the turnaround outcome of the trade war, I expect a major upsurge when he declares a settlement and victory when the tariff issue is resolved. Note FWIW, that Gundlach sees no concerns with the HY market spreads, and the 2s/10s widened recently vs dropping further from the recent 18 or so bps low.
This downturn in the BCI looks a lot like the 2015 decline. Your thoughts? Where do you stand right now in terms of your personal thoughts on where BCI is with regard to signaling a market top, since that matters so much more than when a recession begins?
Of all 6. Indicators at the beginning of this article above, which one, or ones, do you put the most weight into, and is one or a few a leading driver above all others?
Thanks,
Tom
Correction, per this week’s BCI update, it’s the 5 day S&P average downturn which looks a lot like 2015’s trend; not the BCI I mentioned erroneously above.
Tom
The Unemployment Timer and the Hi-Lo Beta Timer each have a weight of 25%, whereas the other four component timers each have a weight of 12.5%. The model is therefor heavily tilted towards the first two timers.
Our personal thoughts are irrelevant, as our models at iMarketSignals are technical by design and not driven by personal opinions.
Thanks, Georg,
Tom