
- Prior to recession the yield curve becomes inverted, as indicated by the Forward Rate Ratio between the 2-year and 10-year U.S. Treasury yields (FRR2-10) being less than 1.00.
- The FRR2-10 has recently peaked at about 1.20 signifying that US economic activity is in the expansion phase of the business cycle, far away from the next recession, with ongoing gains for the stock market predicted.
- Typically after peaks of FRR2-10 the yield of 10-year Treasuries rises, signaling a bond bear-market.
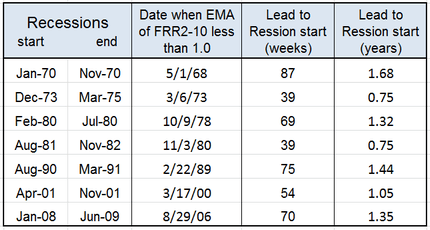
- When FRR2-10 falls to near 1.00 the transition from expansion to boom occurs. The average lead time after FRR2-10 becomes less than 1.00 to the subsequent recession start was 14 months for the last seven recession.
It is well known that an interest rate environment in which long-term debt instruments have a lower yield than short-term debt instruments of the same credit quality is considered to be a predictor of recessions. It is reasonable to assume that a similar pattern will prevail in advance of future contractions of the economy.
This model uses the 2-year and 10-year U.S. Treasury yields as measures of short-term and long-term rates, respectively, and calculates the Forward Rate Ratio (FRR2-10) between the two rates.
FRR2-10 is the rate at which one can lock in borrowing for the eight year period starting two years from now, divided by the ten-year rate itself. A FRR2-10 greater than 1.00 indicates a positively sloped yield curve (ten-year note yields are higher than two-year note yields); a FRR2-10 less than 1.00 indicates an inversion of the yield curve (two-year note yields are higher than ten-year note yields). For the formula to calculate the Forward Rate Ratio see the Appendix.
FRR2-10 as a recession indicator
In Figure 1 the smoothed FRR2-10 shown is the exponential moving average of FRR2-10 (daily values) with a constant smoothing factor equal to 0.030. One can see that the yield curve was inverted prior to the last seven recessions (indicated by the Forward Rate Ratio between the 2- and 10-year yields being less than 1.00).
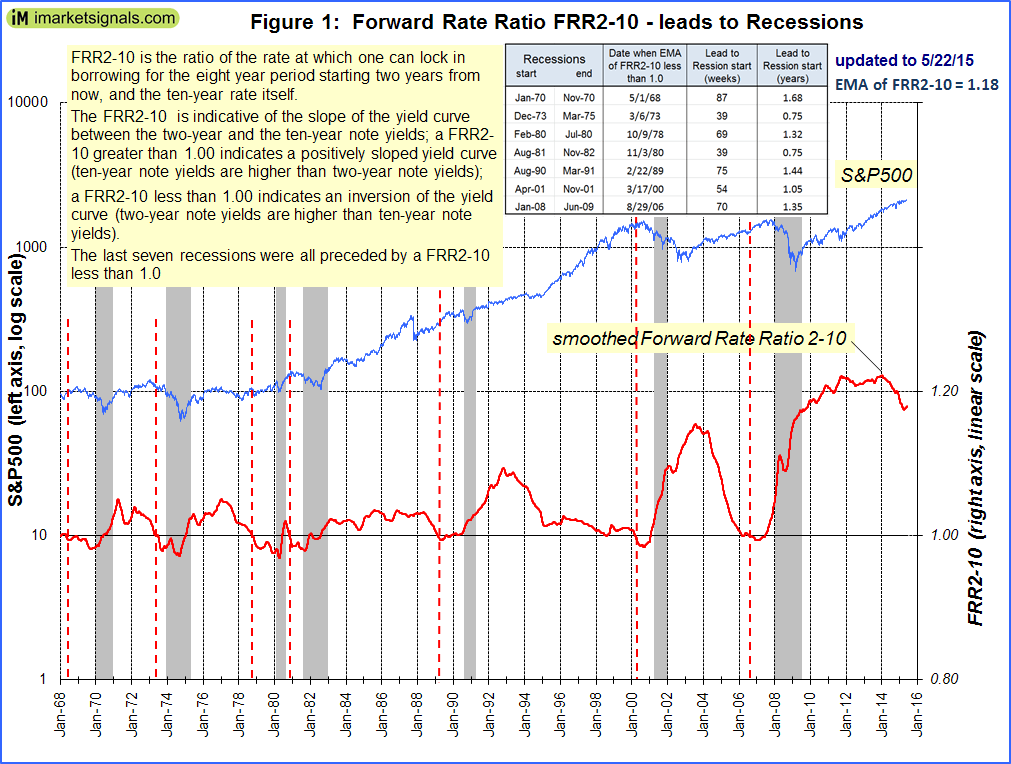
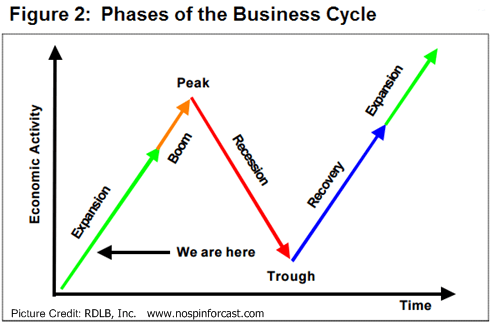
The vertical dashed red lines in Figure 1 indicate when FRR2-10 became less than 1.00. The dates and lead time to the subsequent recessions are shown in the table below. The minimum lead time was 39 weeks to the 1973 and 1981 recessions, with the average being 62 weeks or 14 months.
FRR2-10 as a stock market indicator
The FRR2-10 has recently peaked as shown in Figure 1. Currently (June 2015) the yield curve is extremely steep with a FRR2-10 of about 1.20 indicating that we are in the expansion phase of the business cycle depicted graphically in Figure 2, far away from the next recession. By inspection of Figure 1 it is apparent that after peaks of FRR2-10 the stock market typically registered significant gains. Further gains of the stock market are signaled now.
It is also apparent that the stock market showed in the past gains for a few months after FRR2-10 became less than 1.00, synonymous with the boom phase of the business cycle.
FRR2-10 as a bond market indicator
Figure 3 shows FRR2-10 and the 10-year Treasury Note yields. One observes that after peaks of FRR2-10 10-year yields always gained, even during the long bond bull market which began in 1981. Prior to 1981 the rising yields were even more pronounced after peaks of FRR2-10.
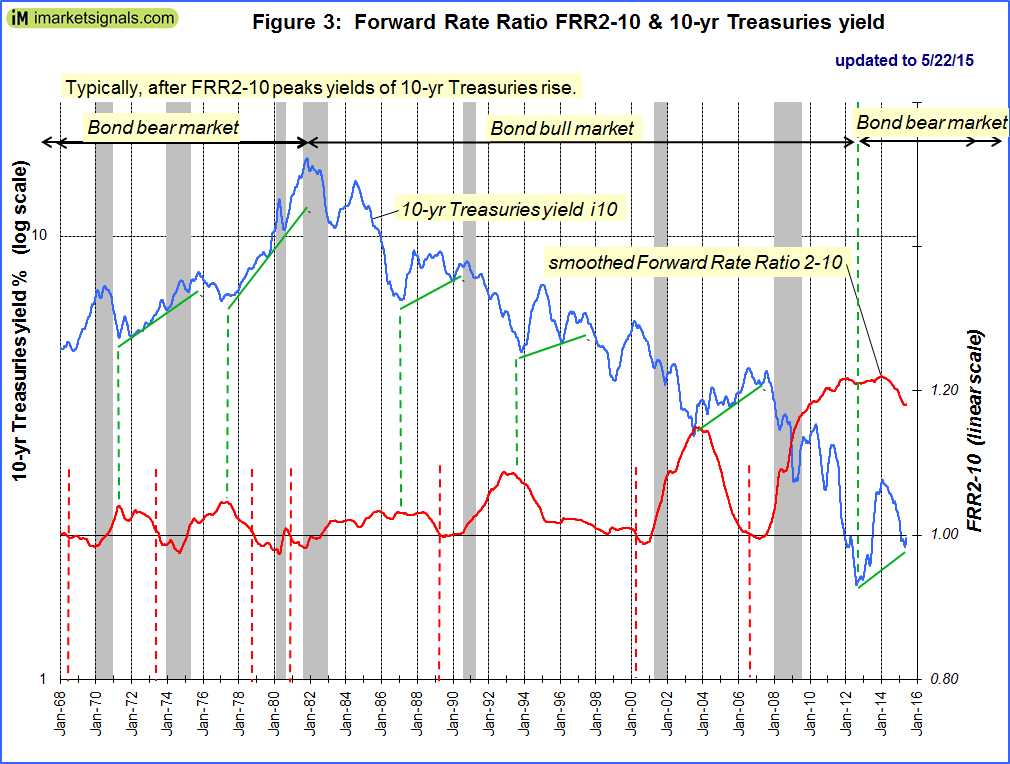
The recent peaking of FRR2-10 indicates rising long-term rates for the foreseeable future, with negative implications for adjustable-rate mortgages, but savers should be helped by higher short-term rates.
Appendix
Forward Rate Ratio
The FRR is described in an article by Howard L. Simons in Stocks, Futures and Option Magazine, March 2007 and can be calculated for any two rates on the yield curve.
FRR2-10 is the rate at which one can lock in borrowing for the eight year period starting two years from now, divided by the ten-year rate itself.
The formula for calculating FRR2-10 is:
FRR2-10 = { [(1 + i10)10/ (1 + i2)2]1/8 – 1} / i10
where i10 and i2 are the 10 year and 2 year U.S. Treasury Note yields respectively.
Neglecting compound interest:
FRR2-10 = (5 i10 – i2) / (4 i10)
Following FRR2-10
Weekly updates of FRR2-10 are posted on our website iMarketSignals.com together with our other recession indicators BCI-Business Cycle Index, COMP and UER-Unemployment Rate. For our latest updates click here.
When would you use the “Neglecting compound interest” formula for the FRR2-10?