 |
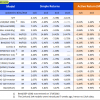
Out of sample performance summary of our models for the past 1, 2, 4 and 13 week periods. The active active return indicates how the models over- or underperformed the benchmark ETF SPY. |
|
|
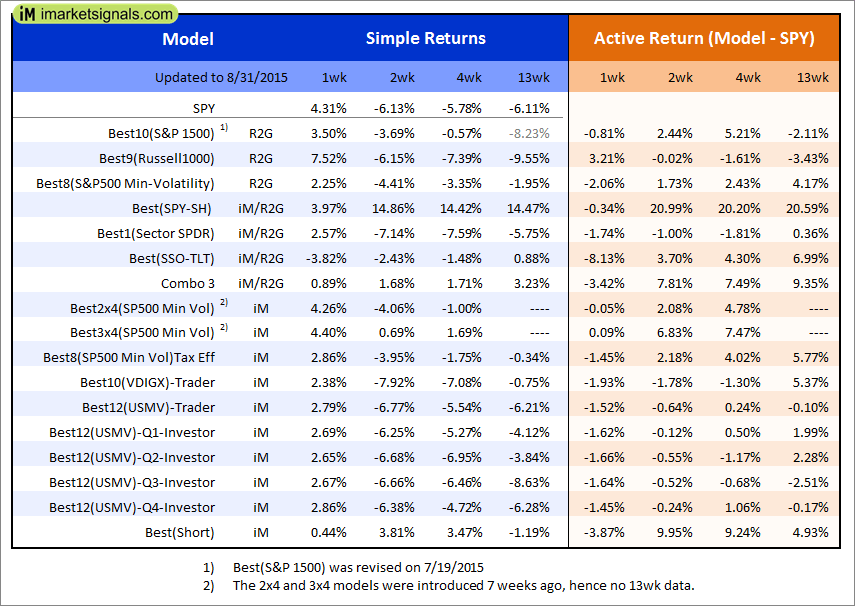
The iM-Best(SPY-SH) model currently holds SPY, so far held for a period of 7 days, and showing a 4.08% return to 8/31/2015. Over the previous week the market value of Best(SPY-SH) gained 3.97% at a time when SPY gained 4.31%. A starting capital of $100,000 at inception on 1/2/2009 would have grown to $404,374 which includes $30,580 cash and excludes $13,610 spent on fees and slippage. |
|
|
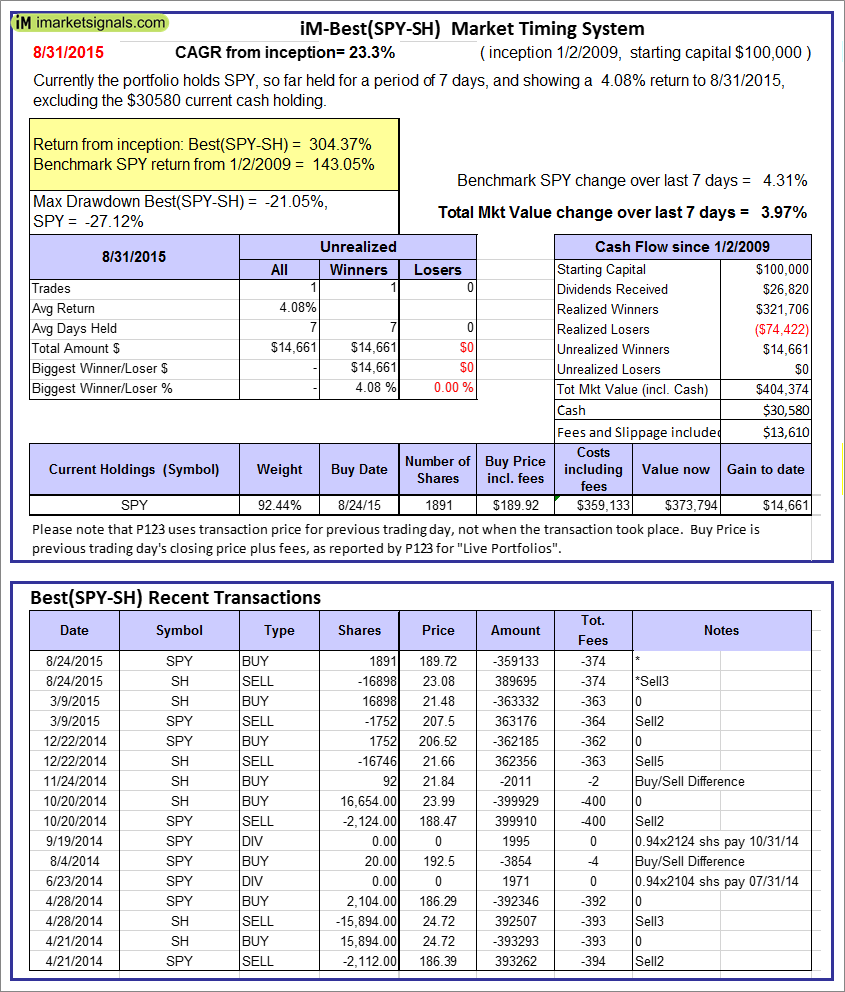
The iM-Combo3 model currently holds SPY, TLT, and XLV, so far held for an average period of 249 days, and showing a 7.64% return to 8/31/2015. Over the previous week the market value of iM-Combo3 gained 0.89% at a time when SPY gained 4.31%. A starting capital of $100,000 at inception on 2/3/2014 would have grown to $126,062 which includes $6,691 cash and excludes $1,357 spent on fees and slippage. |
|
|
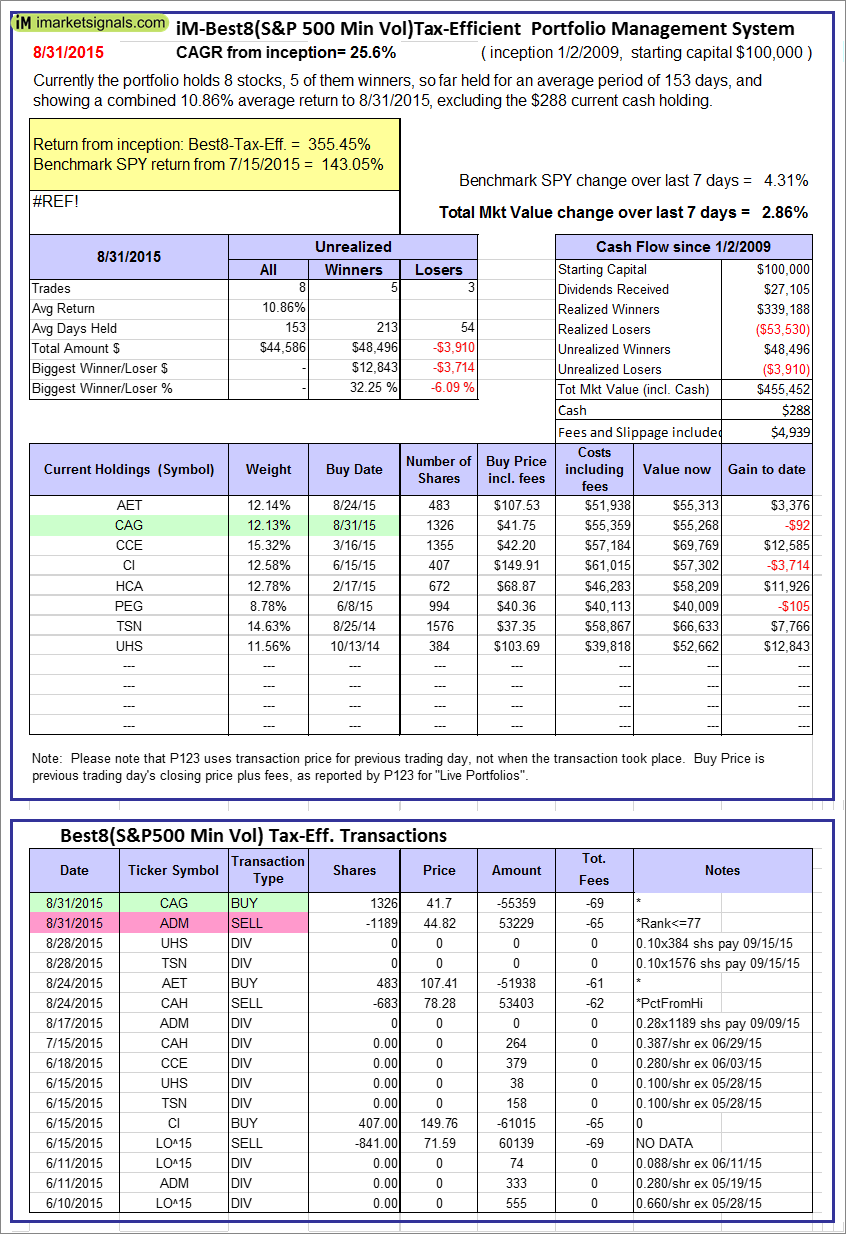
The iM-Best8(S&P500 Min Vol)Tax-Efficient model currently holds 8 stocks, 5 of them winners, so far held for an average period of 153 days, and showing a 10.86% return to 8/31/2015. Over the previous week the market value of iM-Best8(S&P 500)Tax-Eff. gained 2.86% at a time when SPY gained 4.31%. A starting capital of $100,000 at inception on 1/2/2009 would have grown to $455,452 which includes $288 cash and excludes $4,939 spent on fees and slippage. |
|
|
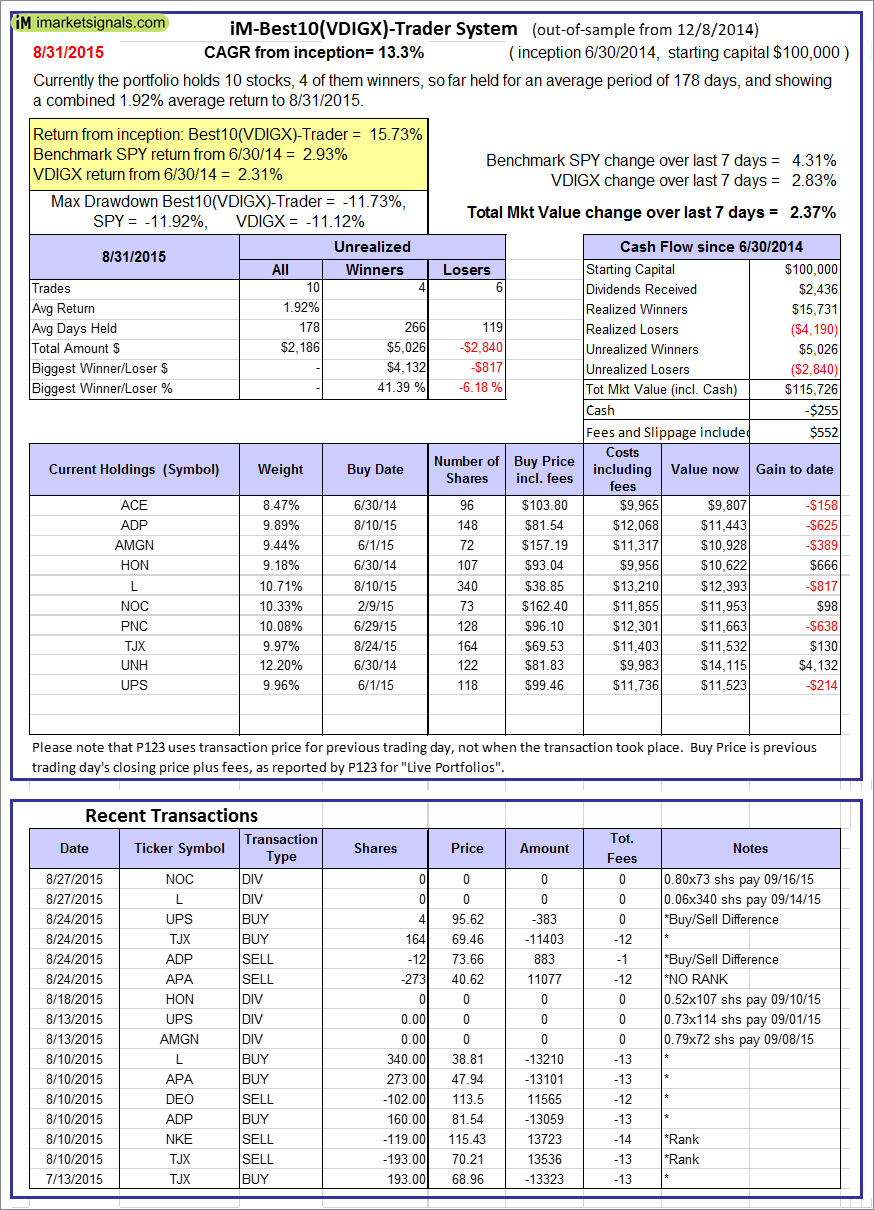
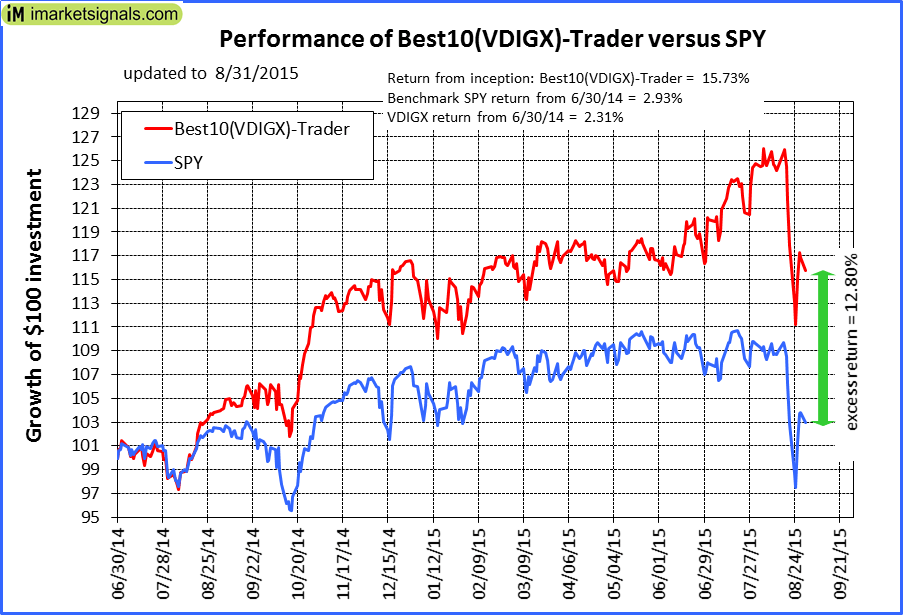
The iM-Best10(VDIGX)-Trader model currently holds 10 stocks, 4 of them winners, so far held for an average period of 178 days, and showing a 1.92% return to 8/31/2015. Since inception, on 7/1/2014, the model gained 15.73% while the benchmark SPY gained 2.93% and the ETF VDIGX gained 2.31% over the same period. Over the previous week the market value of iM-Best10(VDIGX) gained 2.37% at a time when SPY gained 4.31%. A starting capital of $100,000 at inception on 7/1/2014 would have grown to $115,726 which includes -$255 cash and excludes $552 spent on fees and slippage. |
|
|
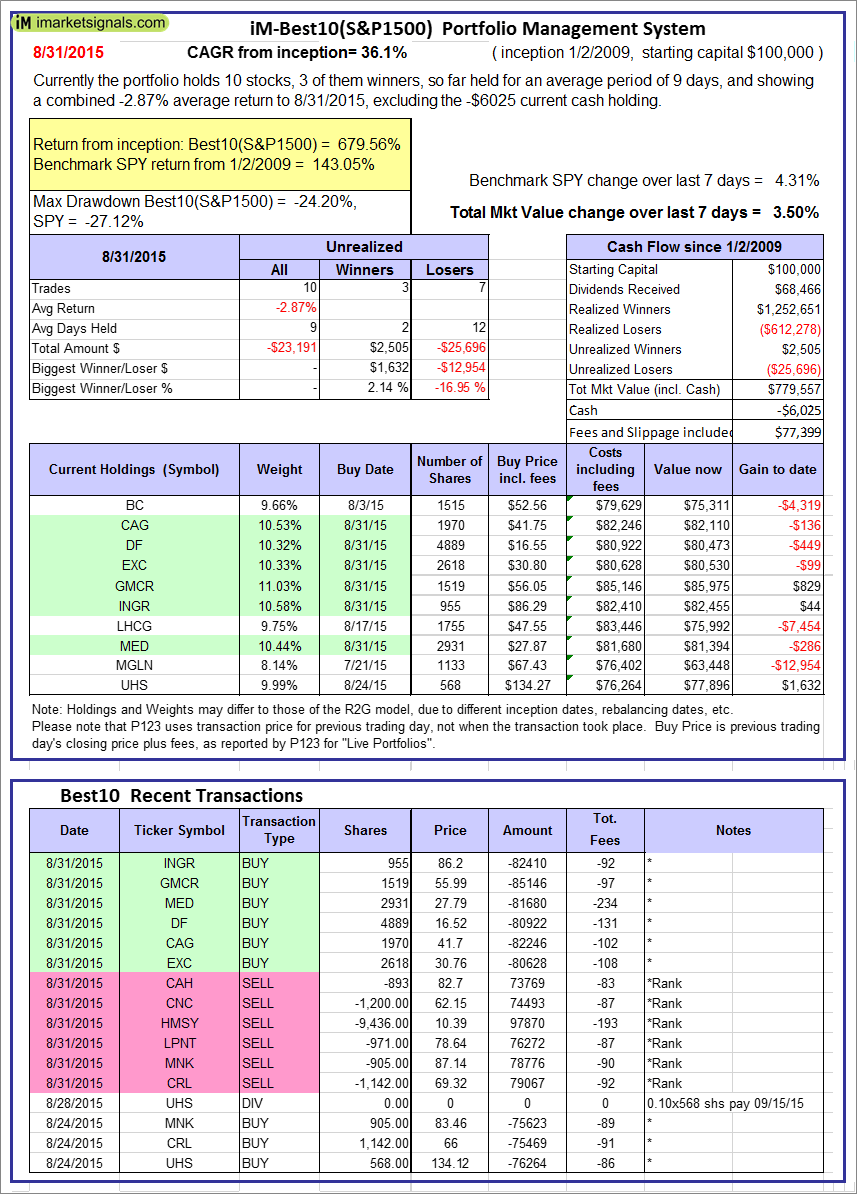
The iM-Best10(S&P 1500) model currently holds 10 stocks, 3 of them winners, so far held for an average period of 9 days, and showing a -2.87% return to 8/31/2015. Over the previous week the market value of iM-Best10 gained 3.50% at a time when SPY gained 4.31%. A starting capital of $100,000 at inception on 1/2/2009 would have grown to $779,557 which includes -$6,025 cash and excludes $77,399 spent on fees and slippage. |
|
|
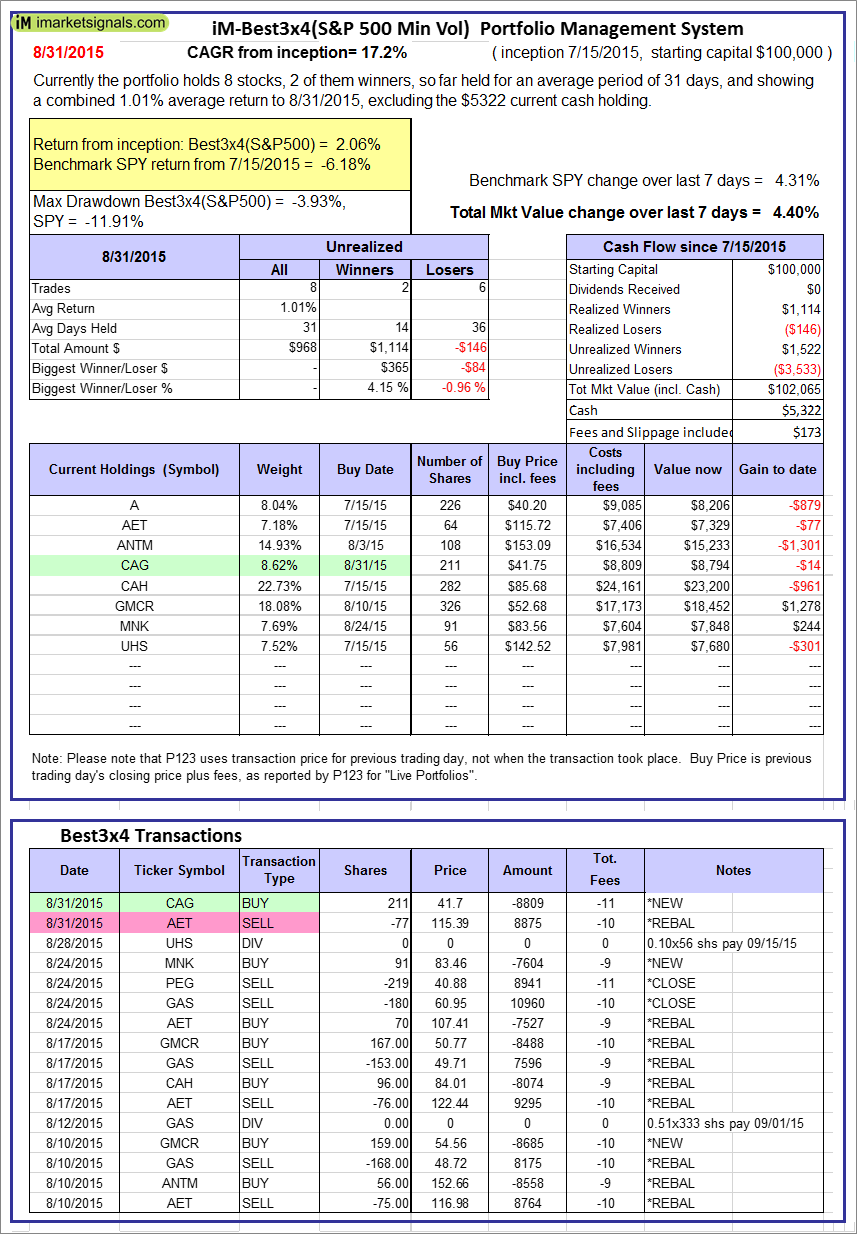
The iM-Best3x4(S&P 500 Min Vol) model currently holds 8 stocks, 2 of them winners, so far held for an average period of 31 days, and showing a 1.01% return to 8/31/2015. Over the previous week the market value of iM-Best3x4 gained 4.40% at a time when SPY gained 4.31%. A starting capital of $100,000 at inception on 7/15/2015 would have grown to $102,065 which includes $5,322 cash and excludes $173 spent on fees and slippage. |
|
|
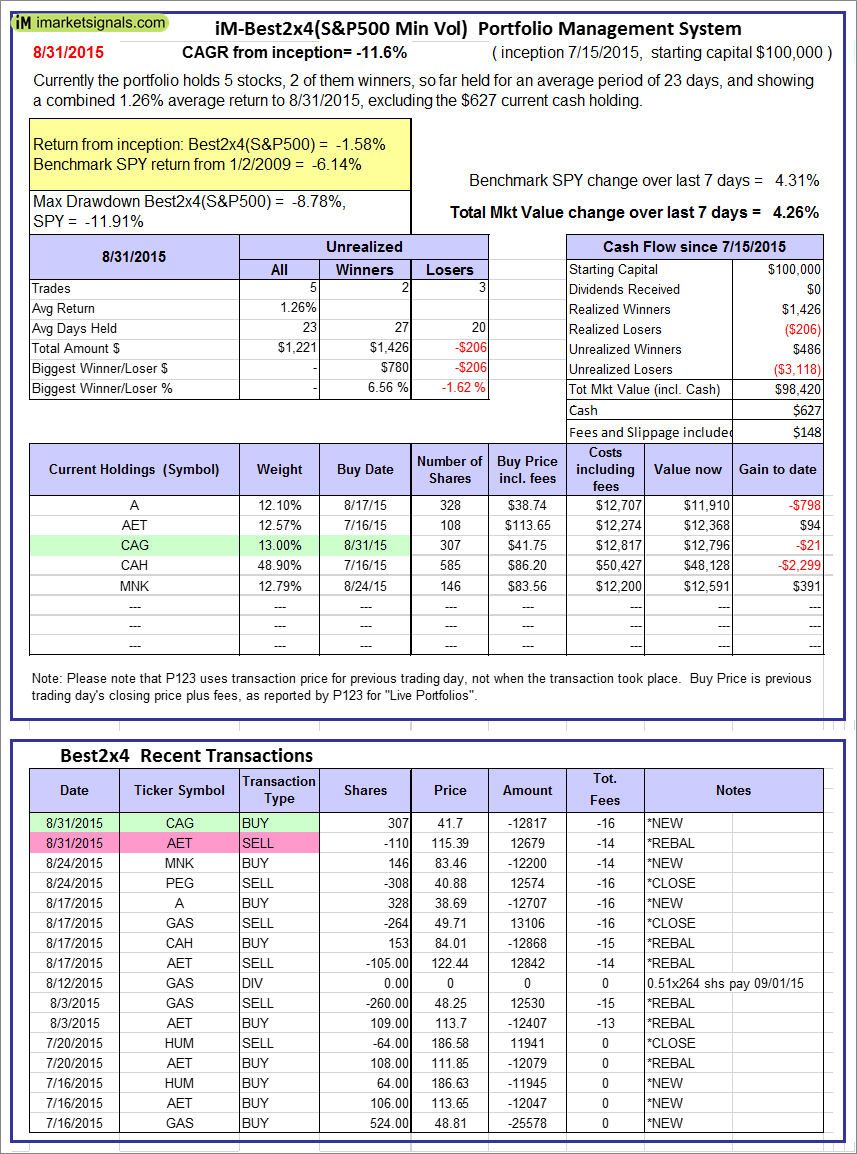
The iM-Best2x4(S&P 500 Min Vol) model currently holds 5 stocks, 2 of them winners, so far held for an average period of 23 days, and showing a 1.26% return to 8/31/2015. Over the previous week the market value of iM-Best2x4 gained 4.26% at a time when SPY gained 4.31%. A starting capital of $100,000 at inception on 7/16/2015 would have grown to $98,420 which includes $627 cash and excludes $148 spent on fees and slippage. |
|
|
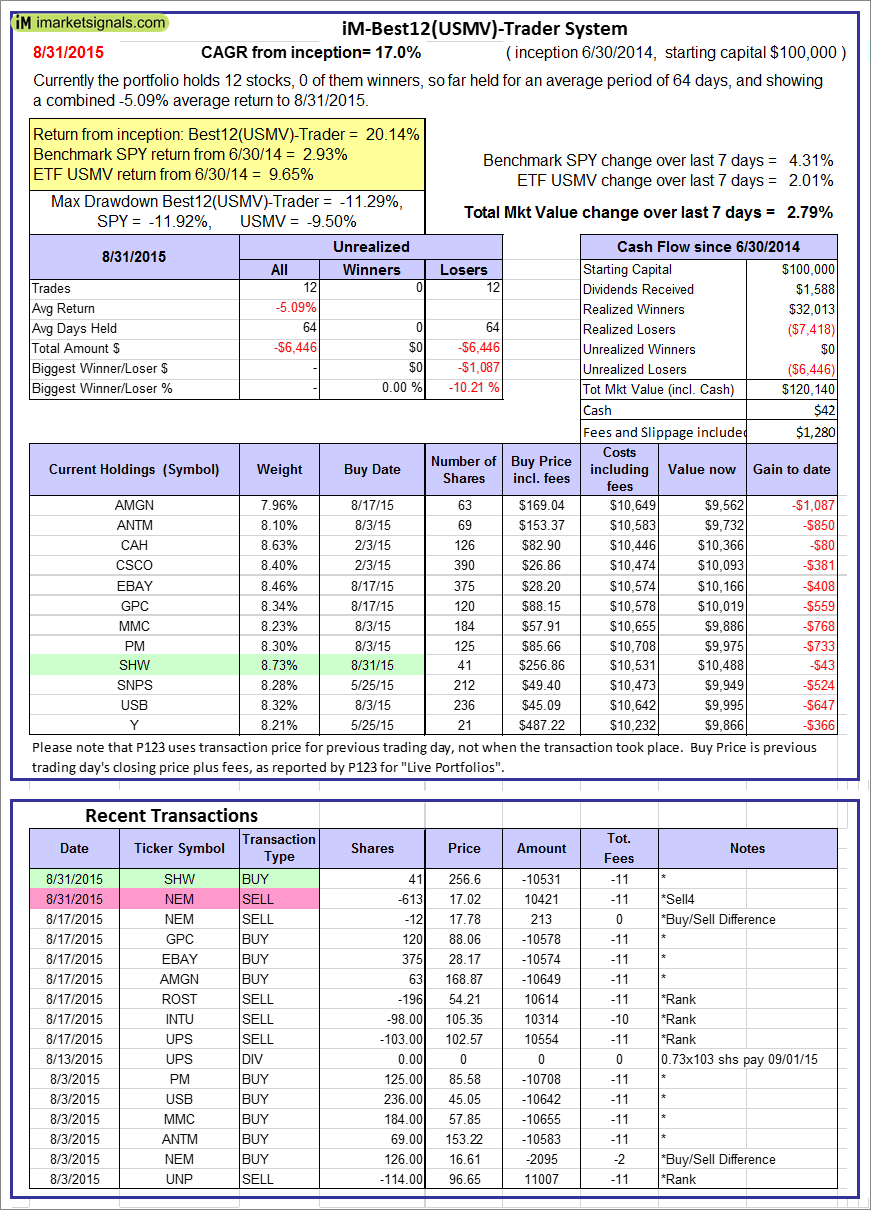
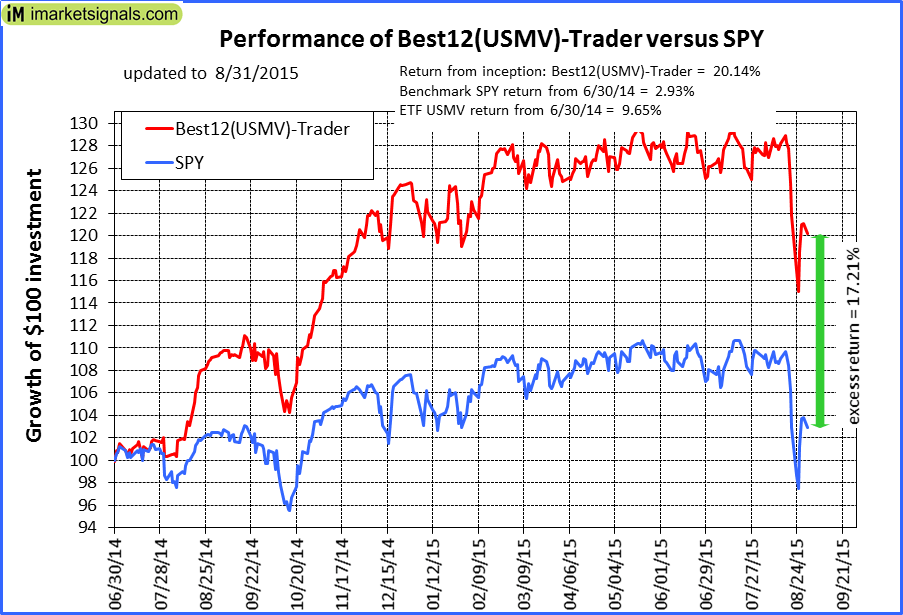
The iM-Best12(USMV)-Trader model currently holds 12 stocks, 0 of them winners, so far held for an average period of 64 days, and showing a -5.09% return to 8/31/2015. Since inception, on 7/1/2014, the model gained 20.14% while the benchmark SPY gained 2.93% and the ETF USMV gained 9.65% over the same period. Over the previous week the market value of iM-Best12(USMV)-Trader gained 2.79% at a time when SPY gained 4.31%. A starting capital of $100,000 at inception on 7/1/2014 would have grown to $120,140 which includes $42 cash and excludes $1,280 spent on fees and slippage. |
|
|
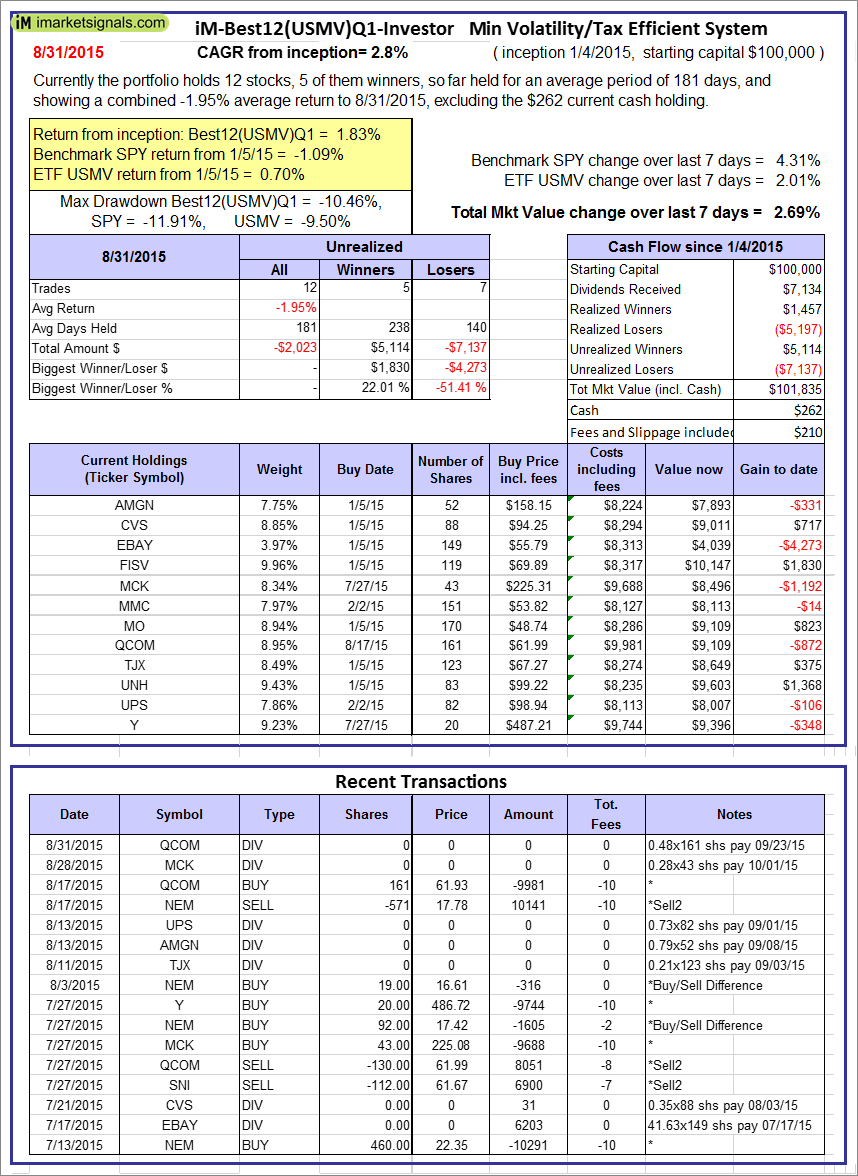
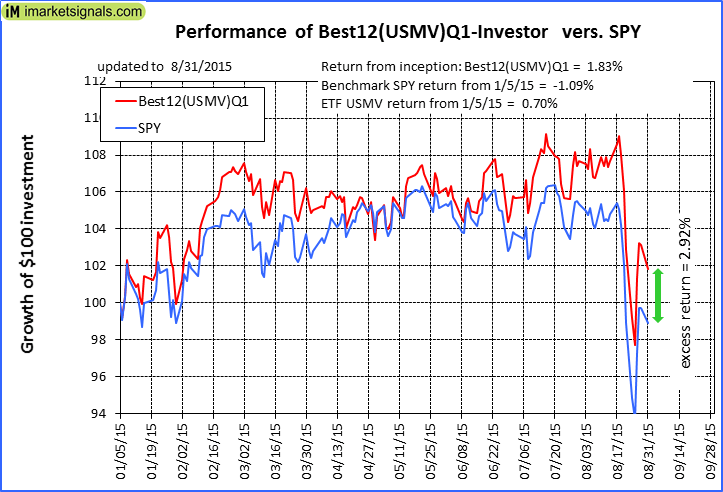
The iM-Best12(USMV)Q1-Investor model currently holds 12 stocks, 5 of them winners, so far held for an average period of 181 days, and showing a -1.95% return to 8/31/2015. Since inception, on 1/5/2015, the model gained 1.83% while the benchmark SPY gained -1.09% and the ETF USMV gained 0.70% over the same period. Over the previous week the market value of iM-Best12(USMV)Q1 gained 2.69% at a time when SPY gained 4.31%. A starting capital of $100,000 at inception on 1/5/2015 would have grown to $101,835 which includes $262 cash and excludes $210 spent on fees and slippage. |
|
|
The iM-Best12(USMV)Q2-Investor model currently holds 12 stocks, 1 of them winners, so far held for an average period of 130 days, and showing a -7.87% return to 8/31/2015. Since inception, on 3/31/2015, the model gained -4.49% while the benchmark SPY gained -4.62% and the ETF USMV gained -2.74% over the same period. Over the previous week the market value of iM-Best12(USMV)Q2 gained 2.66% at a time when SPY gained 4.31%. A starting capital of $100,000 at inception on 3/31/2015 would have grown to $95,514 which includes -$66 cash and excludes $134 spent on fees and slippage. |
|
|
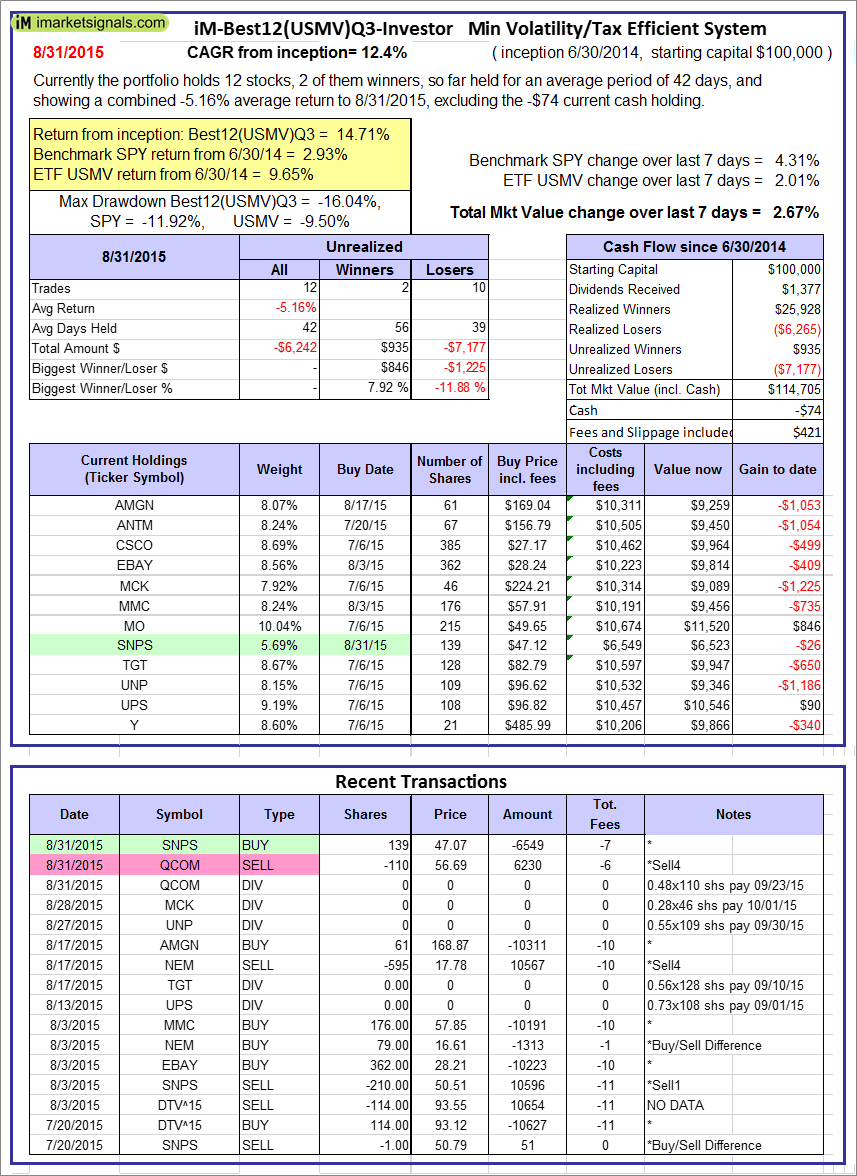
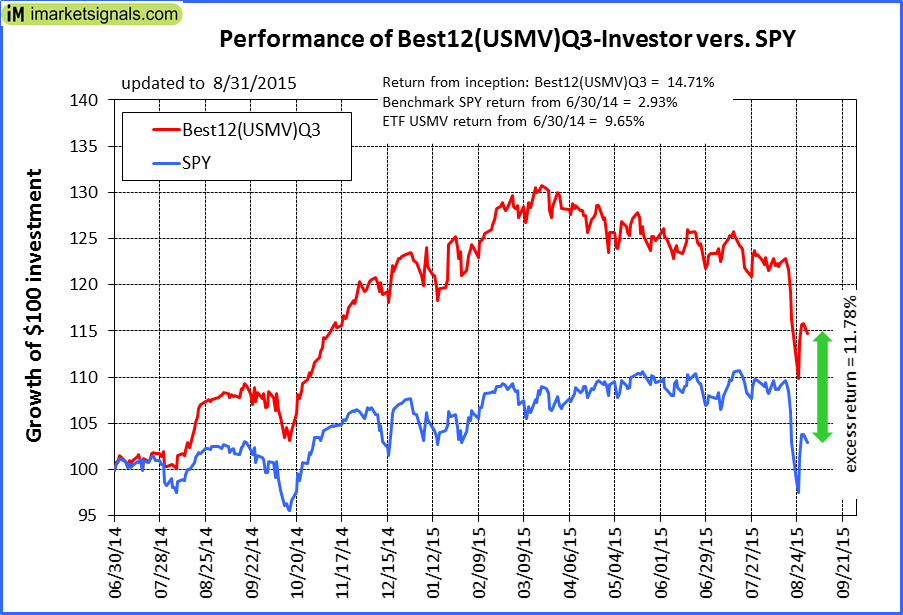
The iM-Best12(USMV)Q3-Investor model currently holds 12 stocks, 2 of them winners, so far held for an average period of 42 days, and showing a -5.16% return to 8/31/2015. Since inception, on 7/1/2014, the model gained 14.71% while the benchmark SPY gained 2.93% and the ETF USMV gained 9.65% over the same period. Over the previous week the market value of iM-Best12(USMV)Q3 gained 2.67% at a time when SPY gained 4.31%. A starting capital of $100,000 at inception on 7/1/2014 would have grown to $114,705 which includes -$74 cash and excludes $421 spent on fees and slippage. |
|
|
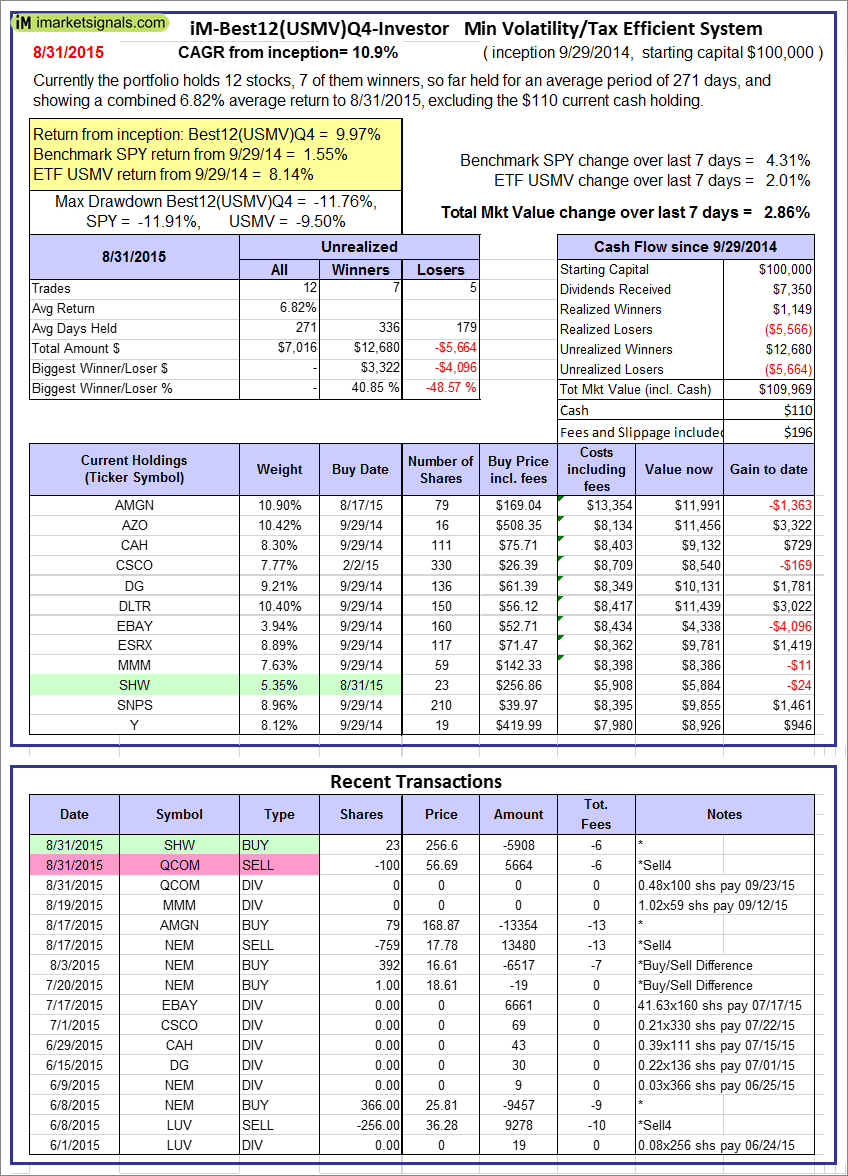
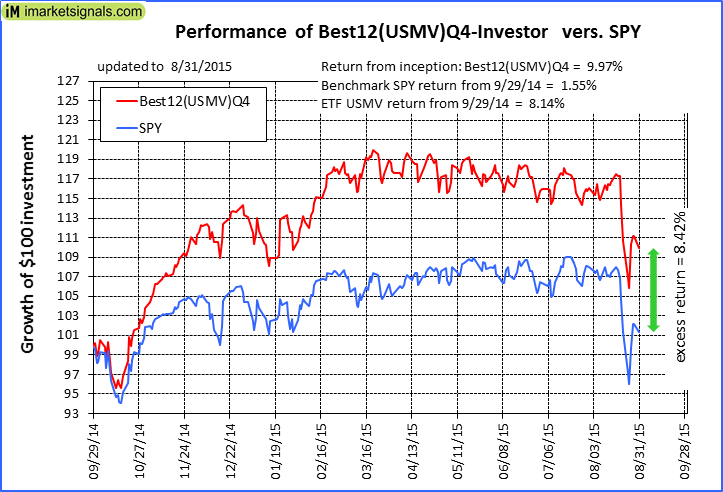
The iM-Best12(USMV)Q4-Investor model currently holds 12 stocks, 7 of them winners, so far held for an average period of 271 days, and showing a 6.82% return to 8/31/2015. Since inception, on 9/30/2014, the model gained 9.97% while the benchmark SPY gained 1.55% and the ETF USMV gained 8.14% over the same period. Over the previous week the market value of iM-Best12(USMV)Q4 gained 2.86% at a time when SPY gained 4.31%. A starting capital of $100,000 at inception on 9/30/2014 would have grown to $109,969 which includes $110 cash and excludes $196 spent on fees and slippage. |
|
|
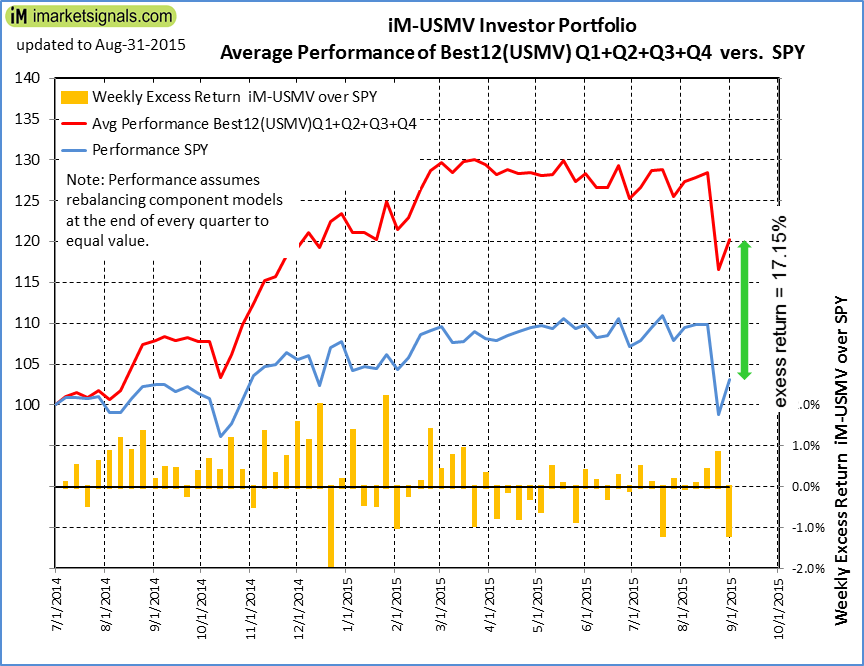
Average Performance of iM-Best12(USMV)Q1+Q2+Q3+Q4-Investor resulted in an excess return of 17.15% over SPY. (see iM-USMV Investor Portfolio) |
|
|
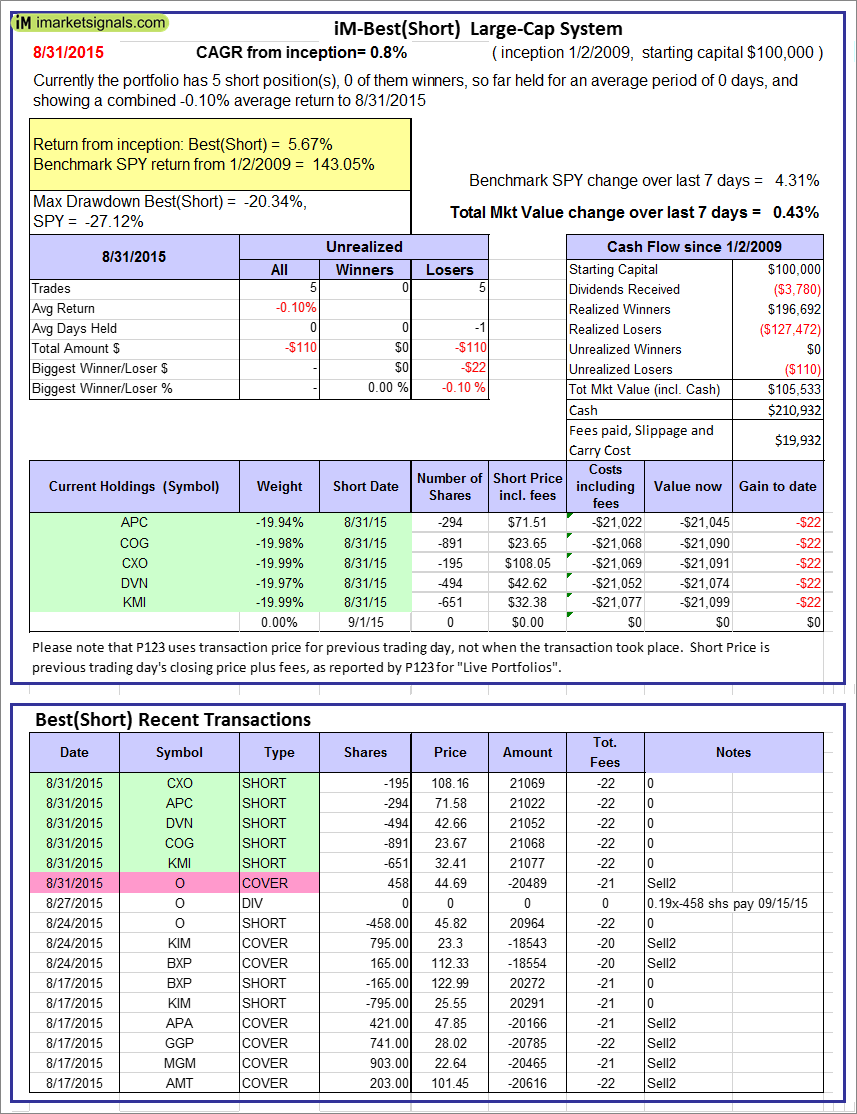
The iM-Best(Short) model currently holds 5 position(s). Over the previous week the market value of iM-Best(Short) gained 0.43% at a time when SPY gained 4.31%. Over the period 1/2/2009 to 8/31/2015 the starting capital of $100,000 would have grown to $105,533 which includes $210,932 cash and excludes $19,932 spent on fees and slippage. |


Hi Mike, would you also include the SPY-IEF in the “Out of sample performance summary” report? Thanks