
 |
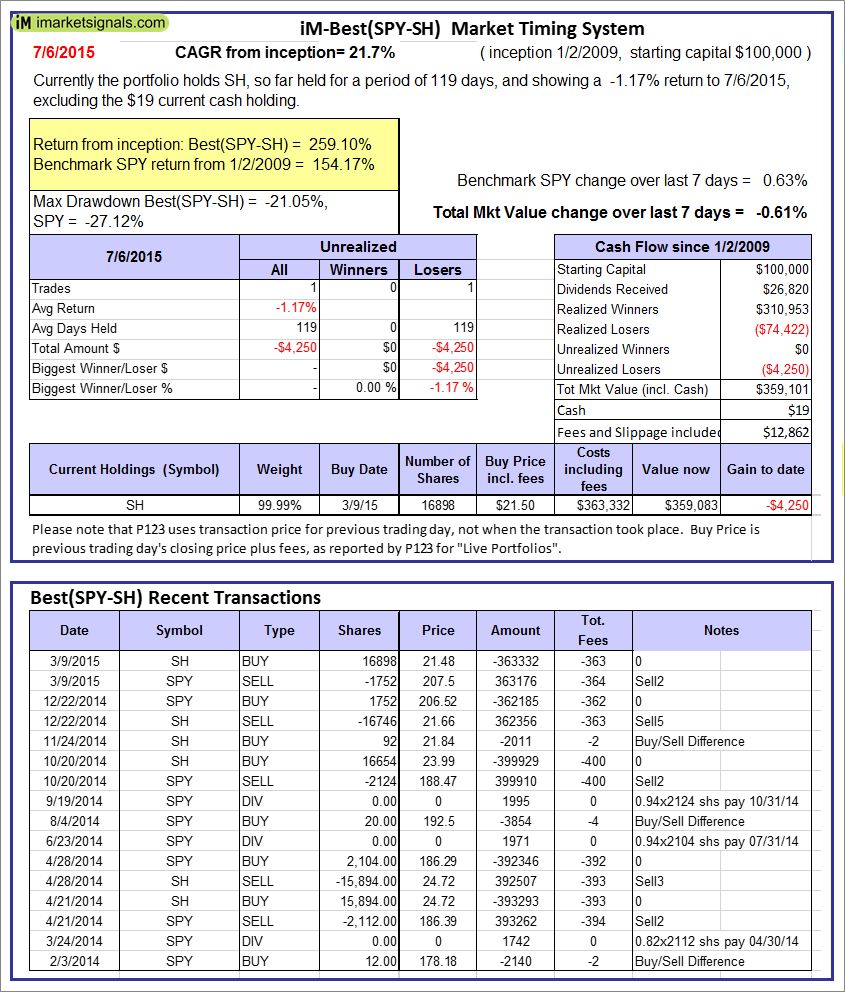
The iM-Best(SPY-SH) model currently holds SH, so far held for a period of 119 days, and showing a -1.17% return to 7/6/2015. Over the previous week the market value of Best(SPY-SH) gained -0.61% at a time when SPY gained 0.63%. A starting capital of $100,000 at inception on 1/2/2009 would have grown to $359,101 which includes $19 and excludes $12,862 spent on fees and slippage. |
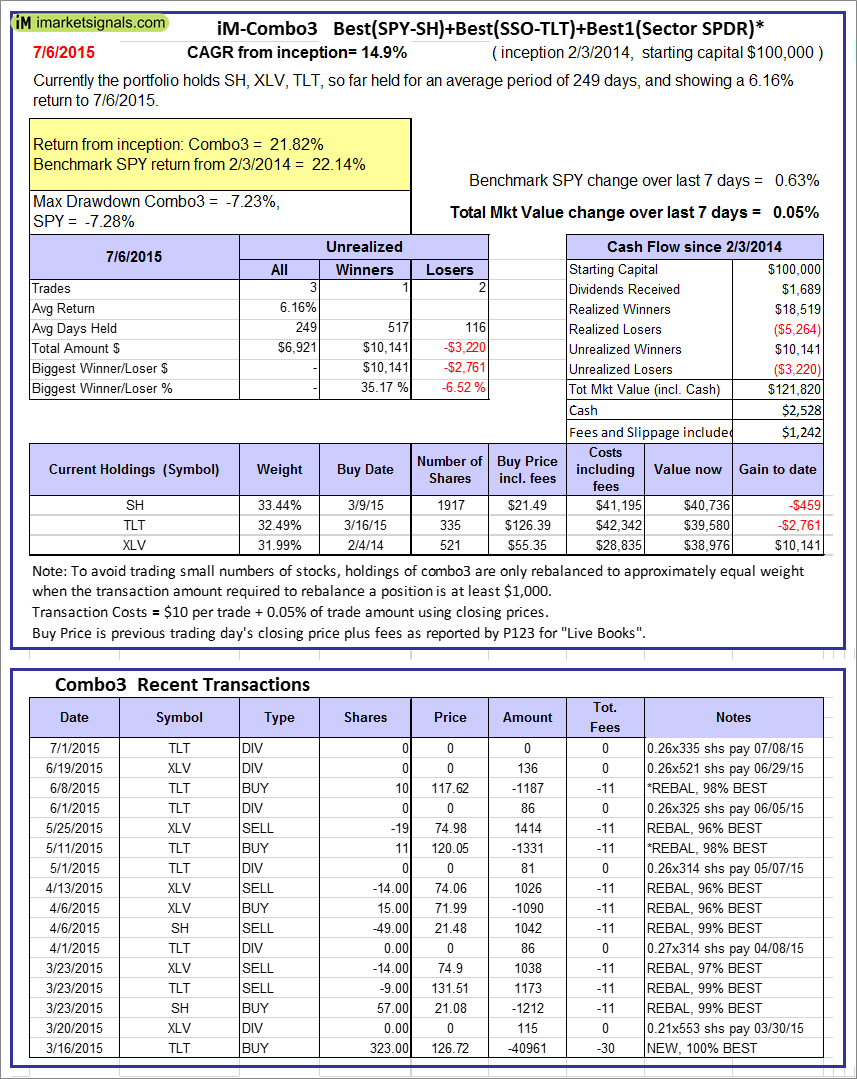 |
The iM-Combo3 model currently holds SH, TLT, and XLV, so far held for an average period of 249 days, and showing a 6.16% return to 7/6/2015. Over the previous week the market value of iM-Combo3 gained 0.05% at a time when SPY gained 0.63%. A starting capital of $100,000 at inception on 1/2/2009 would have grown to $121,820 which includes $2,528 and excludes $1,242 spent on fees and slippage. |
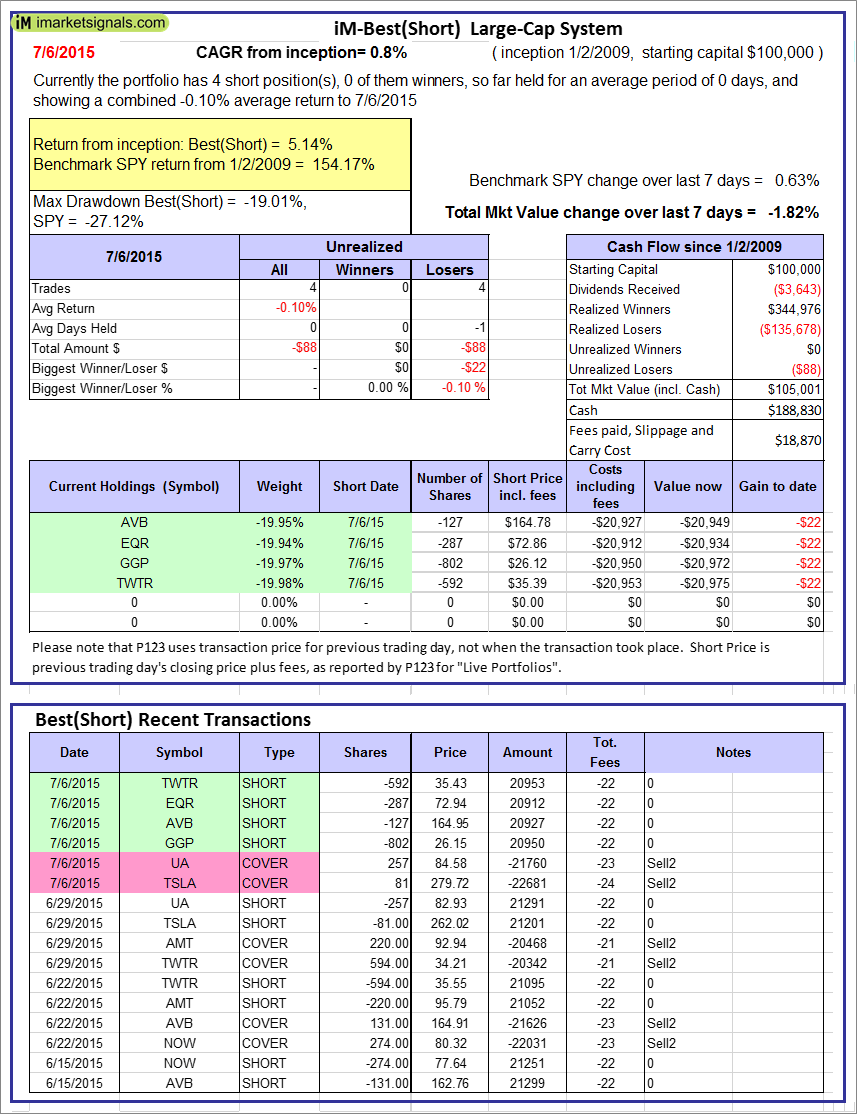 |
The iM-Best(Short) model currently holds 4 position(s). Over the previous week the market value of iM-Best(Short) gained -1.82% at a time when SPY gained 0.63%. Over the period 1/2/2009 to 7/6/2015 the starting capital of $100,000 would have grown to $105,001 which includes $188,830 and excludes $18,870 spent on fees and slippage. |
 |
The iM-Best10(S&P 1500) model currently holds 10 stocks, 1 of them winners, so far held for an average period of 55 days, and showing a -8.90% return to 7/6/2015. Over the previous week the market value of iM-Best10 gained -1.37% at a time when SPY gained 0.63%. A starting capital of $100,000 at inception on 1/2/2009 would have grown to $755,036 which includes $419 and excludes $67,993 spent on fees and slippage. |
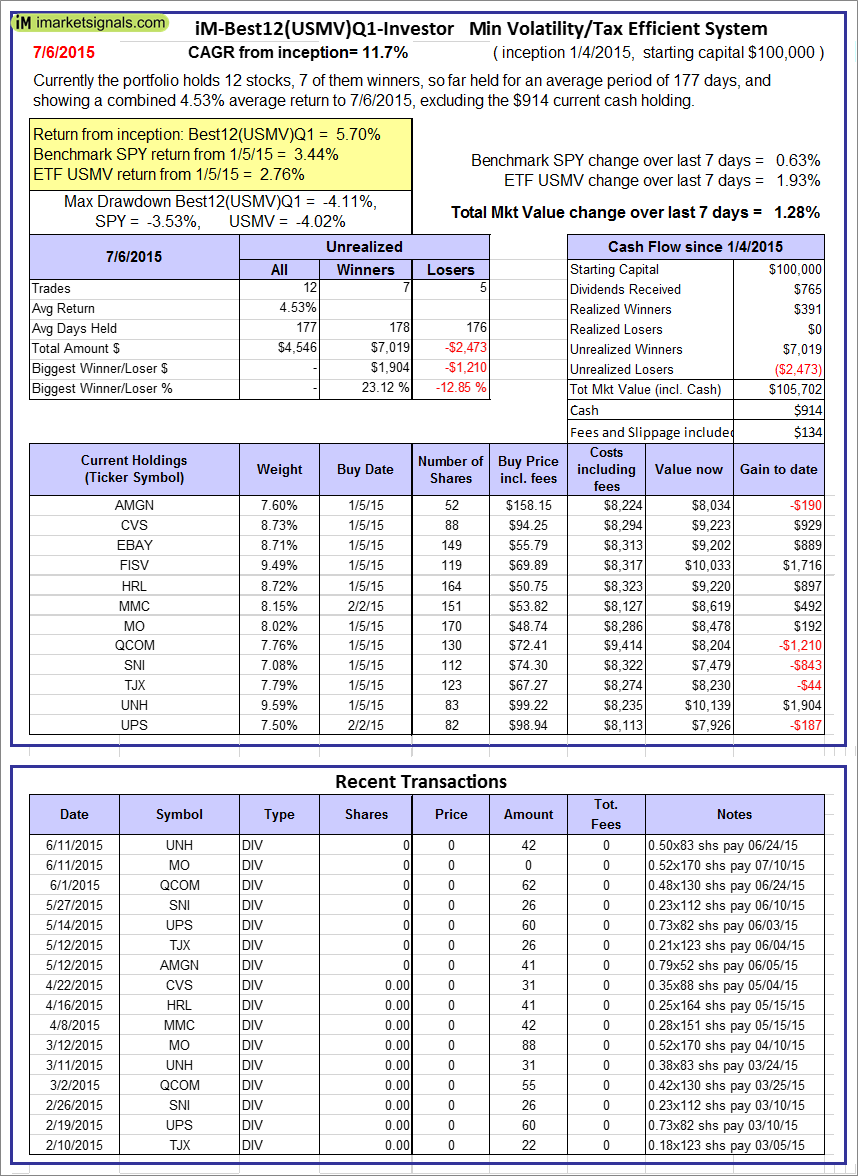 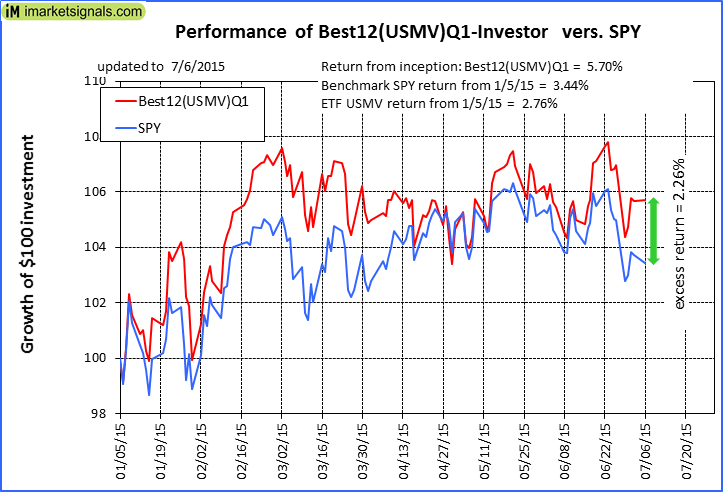 |
The iM-Best12(USMV)Q1-Investor model currently holds 12 stocks, 7 of them winners, so far held for an average period of 177 days, and showing a 4.53% return to 7/6/2015. Since inception, on 1/5/2015, the model gained 5.70% while the benchmark SPY gained 3.44% and the ETF USMV gained 2.76% over the same period. Over the previous week the market value of iM-Best12(USMV)Q1 gained 1.28% at a time when SPY gained 0.63%. A starting capital of $100,000 at inception on 1/2/2009 would have grown to $105,702 which includes $914 and excludes $134 spent on fees and slippage. |
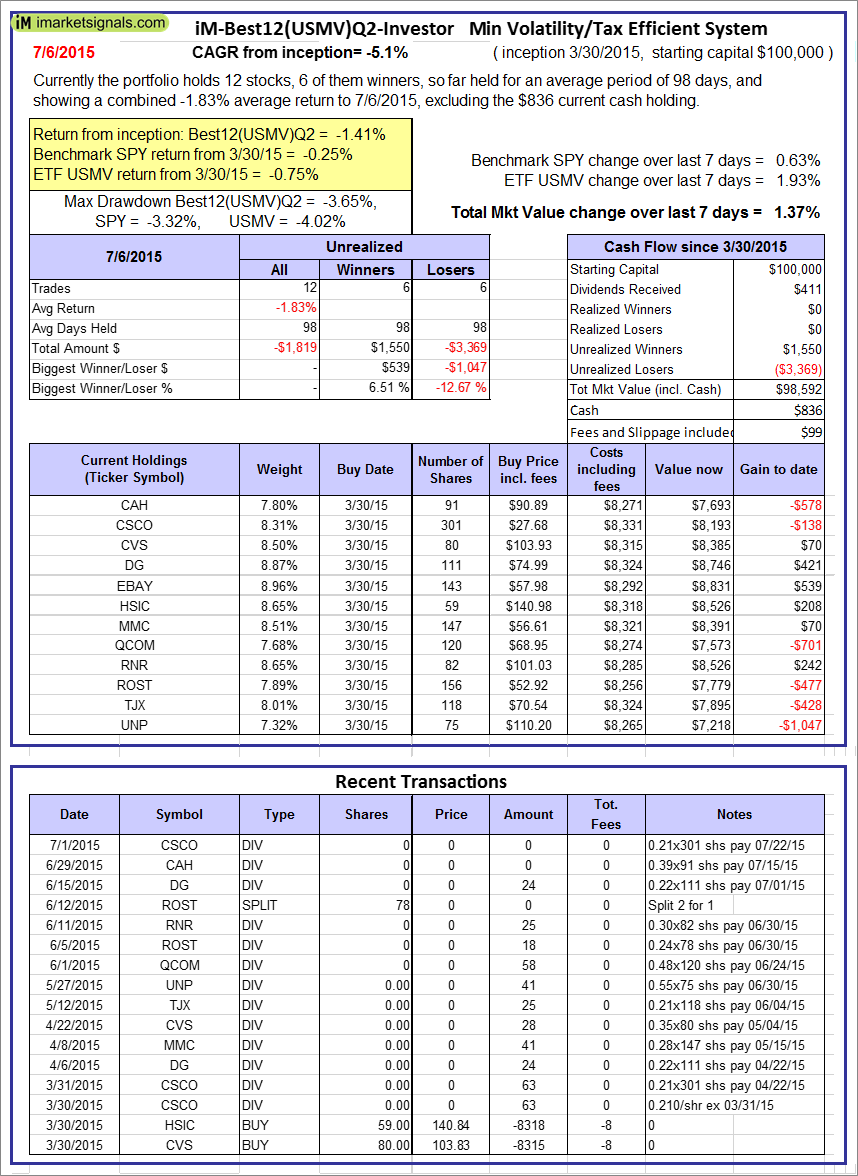  |
The iM-Best12(USMV)Q2-Investor model currently holds 12 stocks, 6 of them winners, so far held for an average period of 98 days, and showing a -1.83% return to 7/6/2015. Since inception, on 3/31/2015, the model gained -1.41% while the benchmark SPY gained -0.25% and the ETF USMV gained -0.75% over the same period. Over the previous week the market value of iM-Best12(USMV)Q2 gained 1.37% at a time when SPY gained 0.63%. A starting capital of $100,000 at inception on 1/2/2009 would have grown to $98,592 which includes $836 and excludes $99 spent on fees and slippage. |
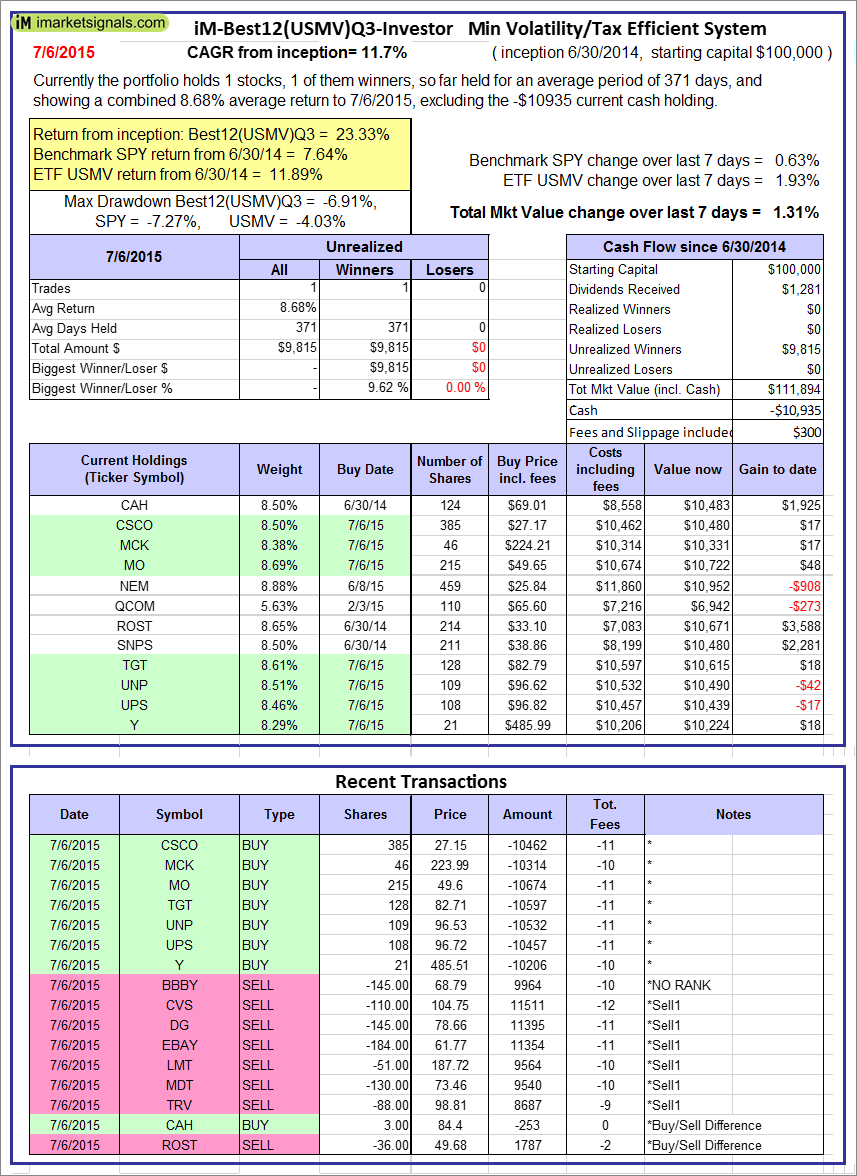  |
The iM-Best12(USMV)Q3-Investor model currently holds 1 stocks, 1 of them winners, so far held for an average period of 371 days, and showing a 8.68% return to 7/6/2015. Since inception, on 7/1/2014, the model gained 23.33% while the benchmark SPY gained 7.64% and the ETF USMV gained 11.89% over the same period. Over the previous week the market value of iM-Best12(USMV)Q3 gained 1.31% at a time when SPY gained 0.63%. A starting capital of $100,000 at inception on 1/2/2009 would have grown to $111,894 which includes -$10,935 and excludes $300 spent on fees and slippage. |
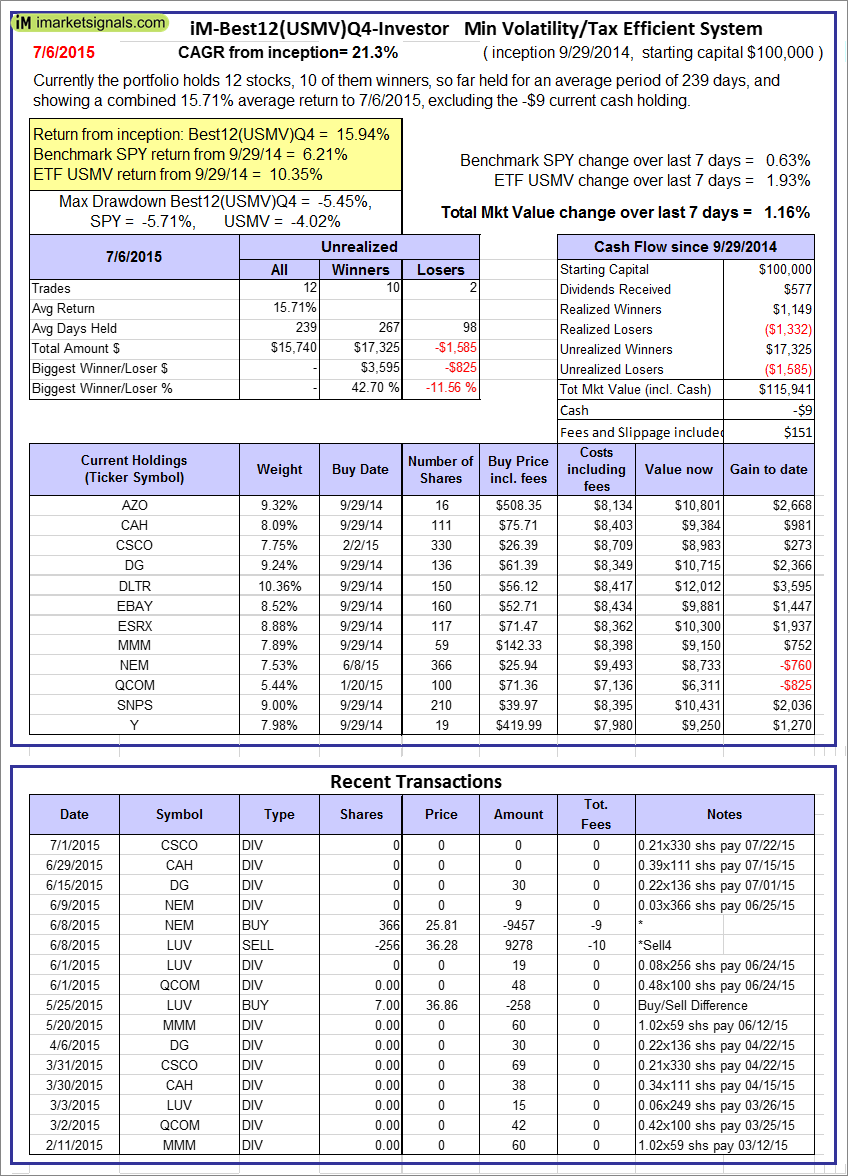 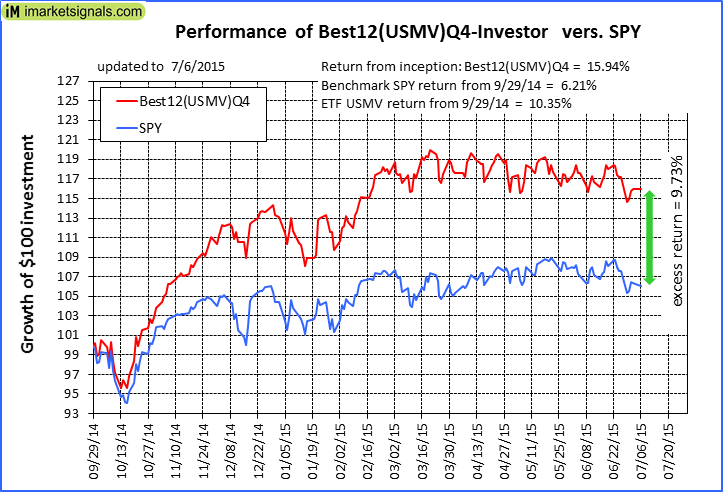 |
The iM-Best12(USMV)Q4-Investor model currently holds 12 stocks, 10 of them winners, so far held for an average period of 239 days, and showing a 15.71% return to 7/6/2015. Since inception, on 9/30/2014, the model gained 15.94% while the benchmark SPY gained 6.21% and the ETF USMV gained 10.35% over the same period. Over the previous week the market value of iM-Best12(USMV)Q4 gained 1.16% at a time when SPY gained 0.63%. A starting capital of $100,000 at inception on 1/2/2009 would have grown to $115,941 which includes -$9 and excludes $151 spent on fees and slippage. |
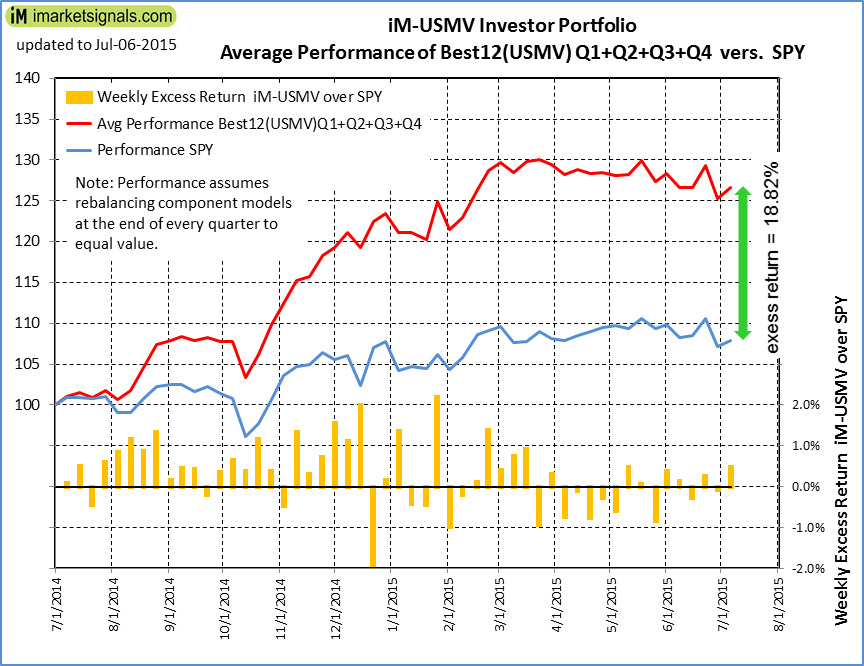 |
Average Performance of iM-Best12(USMV)Q1+Q2+Q3+Q4-Investor resulted in an excess return of 18.82% over SPY. (see iM-USMV Investor Portfolio) |
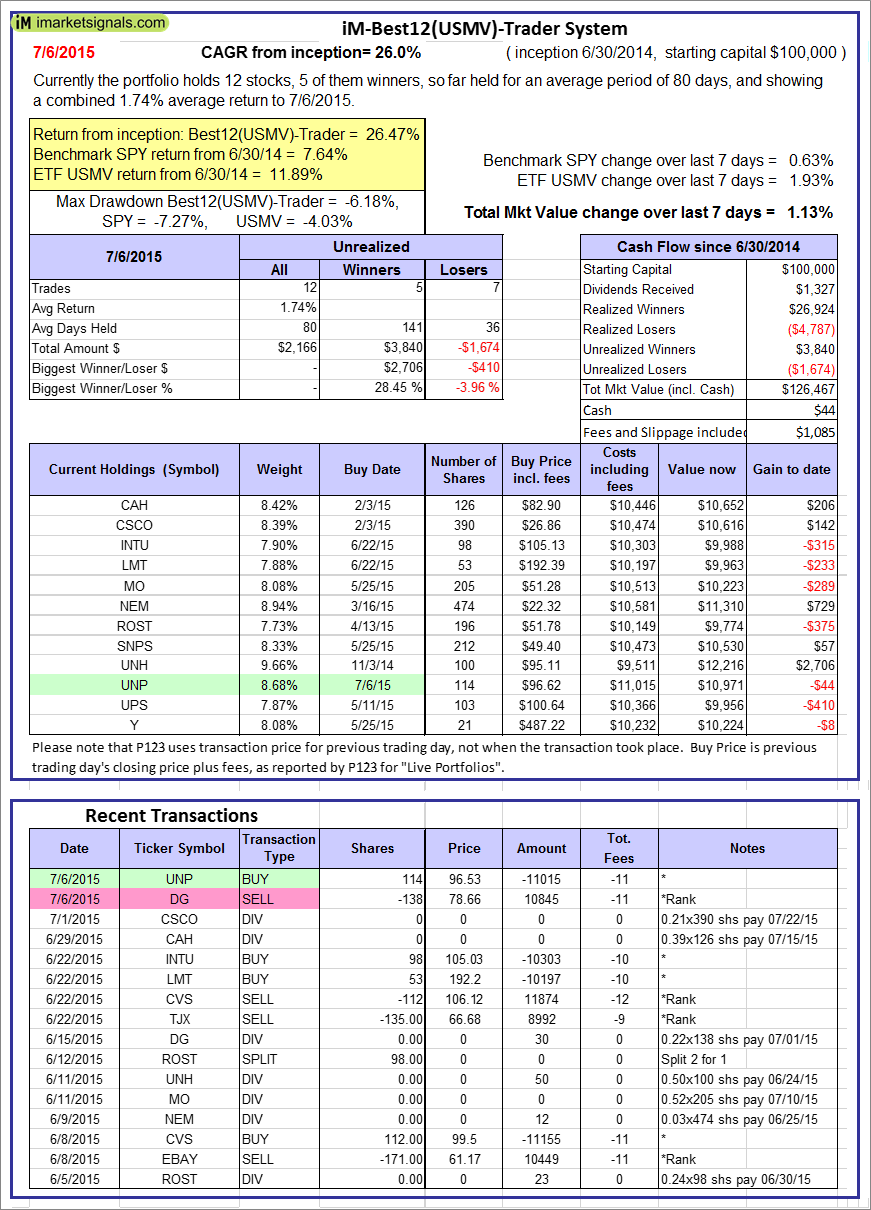 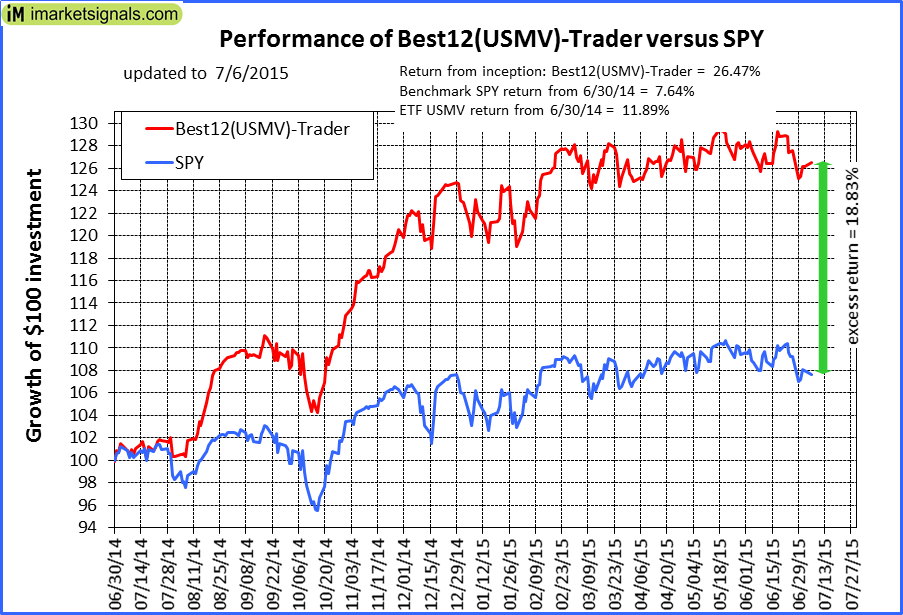 |
The iM-Best12(USMV)-Trader model currently holds 12 stocks, 5 of them winners, so far held for an average period of 80 days, and showing a 1.74% return to 7/6/2015. Since inception, on 7/1/2014, the model gained 26.47% while the benchmark SPY gained 7.64% and the ETF USMV gained 11.89% over the same period. Over the previous week the market value of iM-Best12(USMV)-Trader gained 1.13% at a time when SPY gained 0.63%. A starting capital of $100,000 at inception on 1/2/2009 would have grown to $126,467 which includes $44 and excludes $1,085 spent on fees and slippage. |
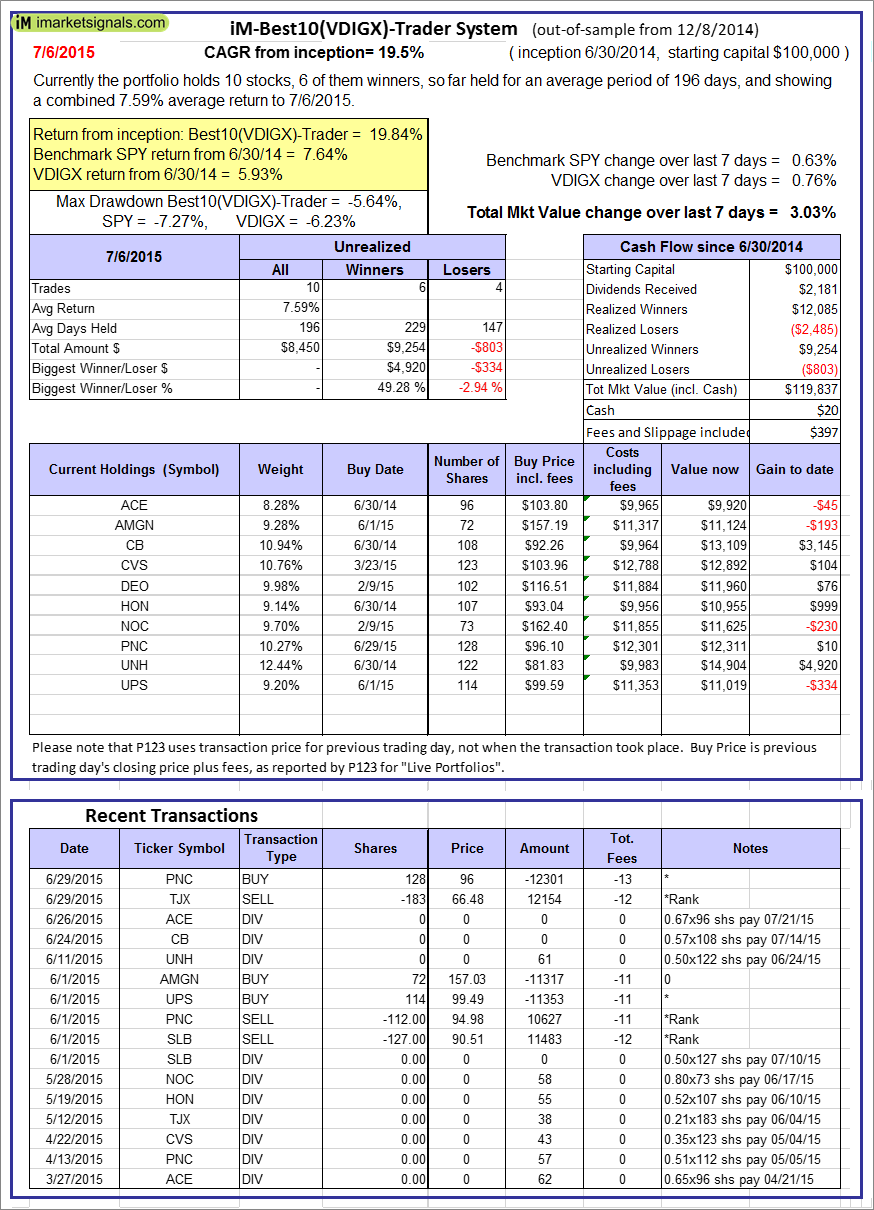 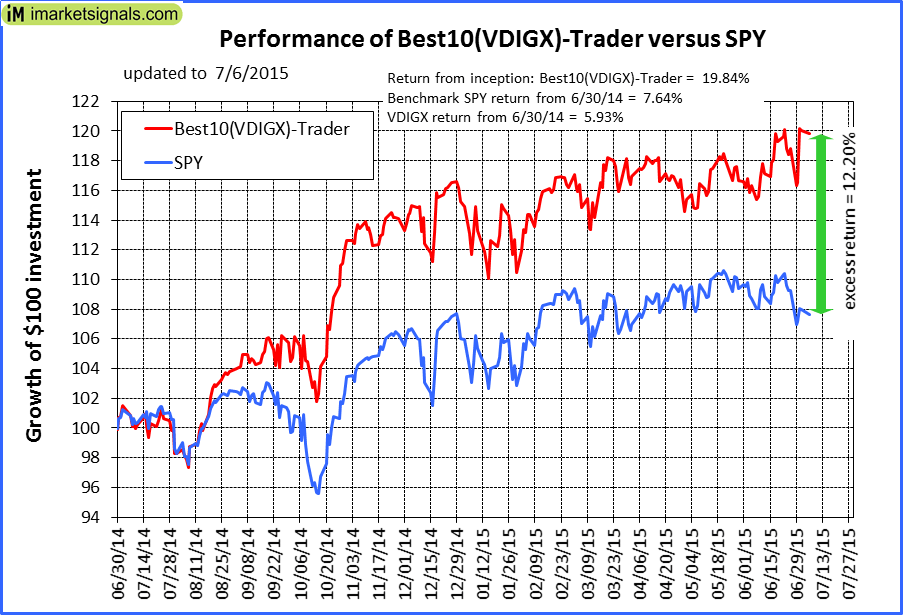 |
The iM-Best10(VDIGX)-Trader model currently holds 10 stocks, 6 of them winners, so far held for an average period of 196 days, and showing a 7.59% return to 7/6/2015. Since inception, on 7/1/2014, the model gained 19.84% while the benchmark SPY gained 7.64% and the ETF VDIGX gained 5.93% over the same period. Over the previous week the market value of iM-Best10(VDIGX) gained 3.03% at a time when SPY gained 0.63%. A starting capital of $100,000 at inception on 1/2/2009 would have grown to $119,837 which includes $20 and excludes $397 spent on fees and slippage. |
iM-Best Reports – 7/6/2015
Posted in pmp SPY-SH
Leave a Reply
You must be logged in to post a comment.