 |
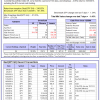
The iM-Best(SPY-SH) model currently holds SH, so far held for a period of 133 days, and showing a -4.05% return to 7/20/2015. Over the previous week the market value of Best(SPY-SH) gained -1.43% at a time when SPY gained 1.34%. A starting capital of $100,000 at inception on 1/2/2009 would have grown to $348,624 which includes $19 and excludes $12,862 spent on fees and slippage. |
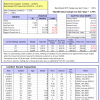
| The iM-Combo3 model currently holds SH, TLT, and XLV, so far held for an average period of 263 days, and showing a 6.24% return to 7/20/2015. Over the previous week the market value of iM-Combo3 gained 0.78% at a time when SPY gained 1.34%. A starting capital of $100,000 at inception on 2/3/2014 would have grown to $121,997 which includes $2,614 and excludes $1,242 spent on fees and slippage. | |
| The iM-Best(Short) model currently holds 4 position(s). Over the previous week the market value of iM-Best(Short) gained -2.12% at a time when SPY gained 1.34%. Over the period 1/2/2009 to 7/20/2015 the starting capital of $100,000 would have grown to $101,625 which includes $182,755 and excludes $19,132 spent on fees and slippage. | |
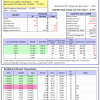
| The iM-Best10(S&P 1500) model currently holds 10 stocks, 0 of them winners, so far held for an average period of 0 days, and showing a -0.35% return to 7/20/2015. Over the previous week the market value of iM-Best10 gained 0.42% at a time when SPY gained 1.34%. A starting capital of $100,000 at inception on 1/2/2009 would have grown to $773,566 which includes $307 and excludes $71,115 spent on fees and slippage. | |
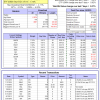
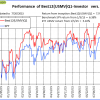
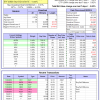
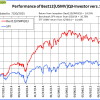
| The iM-Best12(USMV)Q1-Investor model currently holds 12 stocks, 7 of them winners, so far held for an average period of 176 days, and showing a -0.65% return to 7/20/2015. Since inception, on 1/5/2015, the model gained 7.97% while the benchmark SPY gained 6.38% and the ETF USMV gained 5.10% over the same period. Over the previous week the market value of iM-Best12(USMV)Q1 gained 0.07% at a time when SPY gained 1.34%. A starting capital of $100,000 at inception on 1/2/2009 would have grown to $107,969 which includes $6,426 and excludes $154 spent on fees and slippage. | |
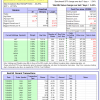
| The iM-Best12(USMV)Q2-Investor model currently holds 12 stocks, 6 of them winners, so far held for an average period of 112 days, and showing a -3.81% return to 7/20/2015. Since inception, on 3/31/2015, the model gained 2.60% while the benchmark SPY gained 2.58% and the ETF USMV gained 1.51% over the same period. Over the previous week the market value of iM-Best12(USMV)Q2 gained 1.99% at a time when SPY gained 1.34%. A starting capital of $100,000 at inception on 1/2/2009 would have grown to $102,602 which includes $6,824 and excludes $99 spent on fees and slippage. | |
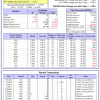
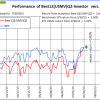
| The iM-Best12(USMV)Q3-Investor model currently holds 12 stocks, 8 of them winners, so far held for an average period of 58 days, and showing a 0.91% return to 7/20/2015. Since inception, on 7/1/2014, the model gained 24.25% while the benchmark SPY gained 10.70% and the ETF USMV gained 14.44% over the same period. Over the previous week the market value of iM-Best12(USMV)Q3 gained -0.62% at a time when SPY gained 1.34%. A starting capital of $100,000 at inception on 1/2/2009 would have grown to $124,255 which includes $467 and excludes $344 spent on fees and slippage. | |
| The iM-Best12(USMV)Q4-Investor model currently holds 12 stocks, 9 of them winners, so far held for an average period of 253 days, and showing a 10.50% return to 7/20/2015. Since inception, on 9/30/2014, the model gained 17.39% while the benchmark SPY gained 9.23% and the ETF USMV gained 12.86% over the same period. Over the previous week the market value of iM-Best12(USMV)Q4 gained -0.13% at a time when SPY gained 1.34%. A starting capital of $100,000 at inception on 1/2/2009 would have grown to $117,389 which includes $6,676 and excludes $151 spent on fees and slippage. | |
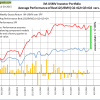
| Average Performance of iM-Best12(USMV)Q1+Q2+Q3+Q4-Investor resulted in an excess return of 17.96% over SPY. (see iM-USMV Investor Portfolio) | |
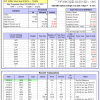
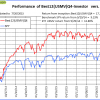
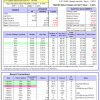
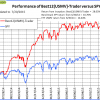
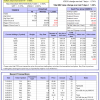
| The iM-Best12(USMV)-Trader model currently holds 12 stocks, 9 of them winners, so far held for an average period of 91 days, and showing a 2.35% return to 7/20/2015. Since inception, on 7/1/2014, the model gained 28.03% while the benchmark SPY gained 10.70% and the ETF USMV gained 14.44% over the same period. Over the previous week the market value of iM-Best12(USMV)-Trader gained -0.44% at a time when SPY gained 1.34%. A starting capital of $100,000 at inception on 1/2/2009 would have grown to $128,029 which includes $315 and excludes $1,106 spent on fees and slippage. | |
| The iM-Best10(VDIGX)-Trader model currently holds 10 stocks, 9 of them winners, so far held for an average period of 161 days, and showing a 7.13% return to 7/20/2015. Since inception, on 7/1/2014, the model gained 23.49% while the benchmark SPY gained 10.70% and the ETF VDIGX gained 9.98% over the same period. Over the previous week the market value of iM-Best10(VDIGX) gained 1.36% at a time when SPY gained 1.34%. A starting capital of $100,000 at inception on 1/2/2009 would have grown to $123,494 which includes -$13 and excludes $450 spent on fees and slippage. |

Leave a Reply
You must be logged in to post a comment.