
 |
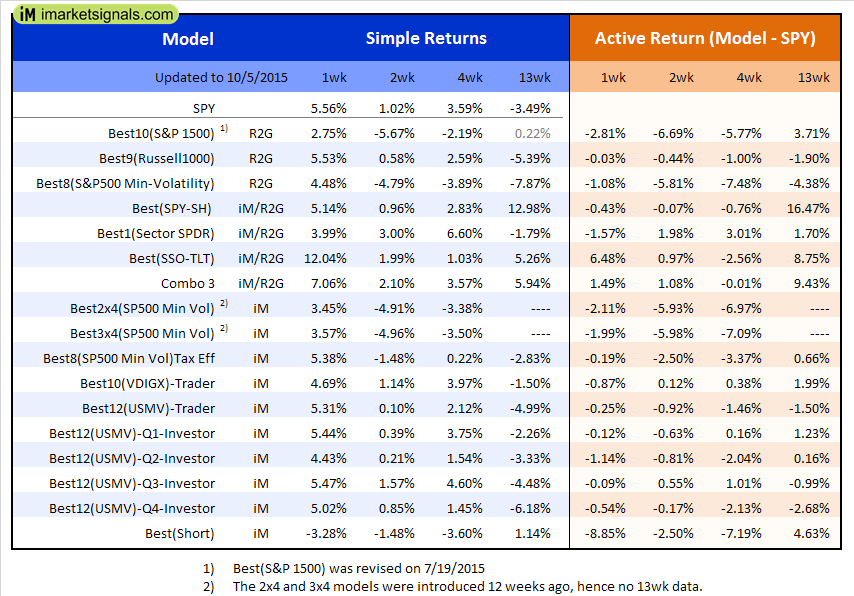
Out of sample performance summary of our models for the past 1, 2, 4 and 13 week periods. The active active return indicates how the models over- or underperformed the benchmark ETF SPY. |
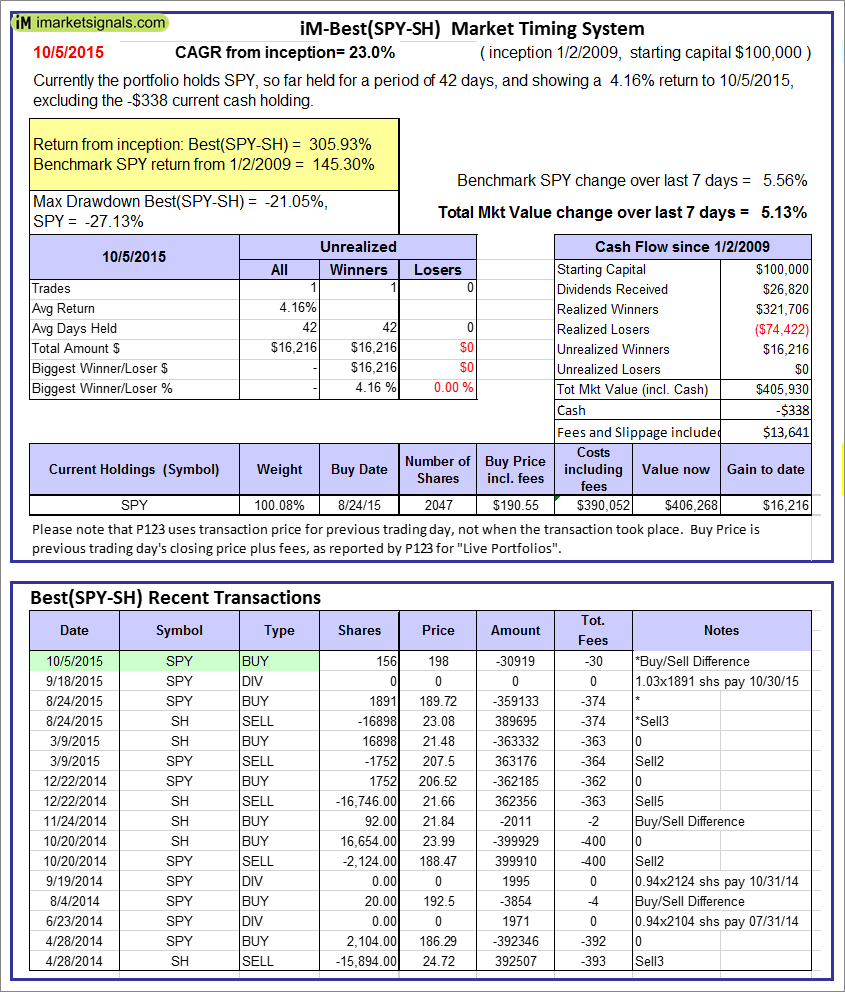 |
The iM-Best(SPY-SH) model currently holds SPY, so far held for a period of 42 days, and showing a 4.16% return to 10/5/2015. Over the previous week the market value of Best(SPY-SH) gained 5.13% at a time when SPY gained 5.56%. A starting capital of $100,000 at inception on 1/2/2009 would have grown to $405,930 which includes -$338 cash and excludes $13,641 spent on fees and slippage. |
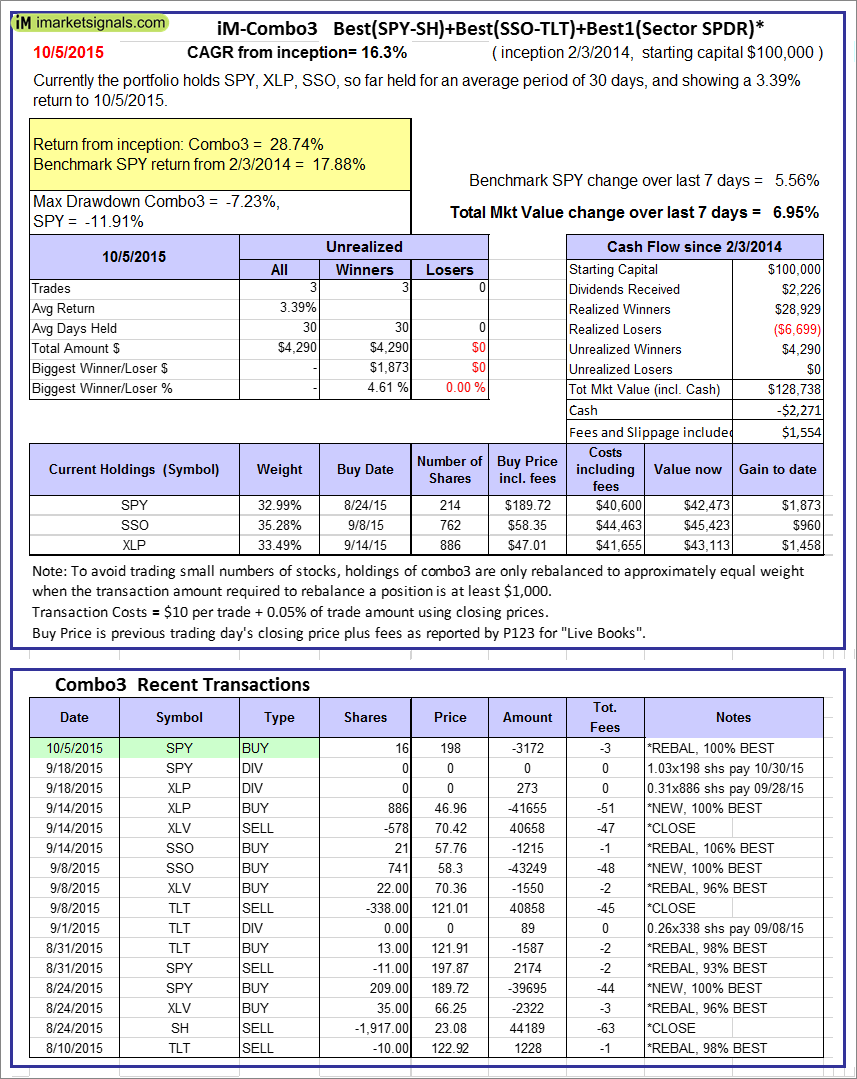 |
The iM-Combo3 model currently holds SPY, SSO, and XLP, so far held for an average period of 30 days, and showing a 3.39% return to 10/5/2015. Over the previous week the market value of iM-Combo3 gained 6.95% at a time when SPY gained 5.56%. A starting capital of $100,000 at inception on 2/3/2014 would have grown to $128,738 which includes -$2,271 cash and excludes $1,554 spent on fees and slippage. |
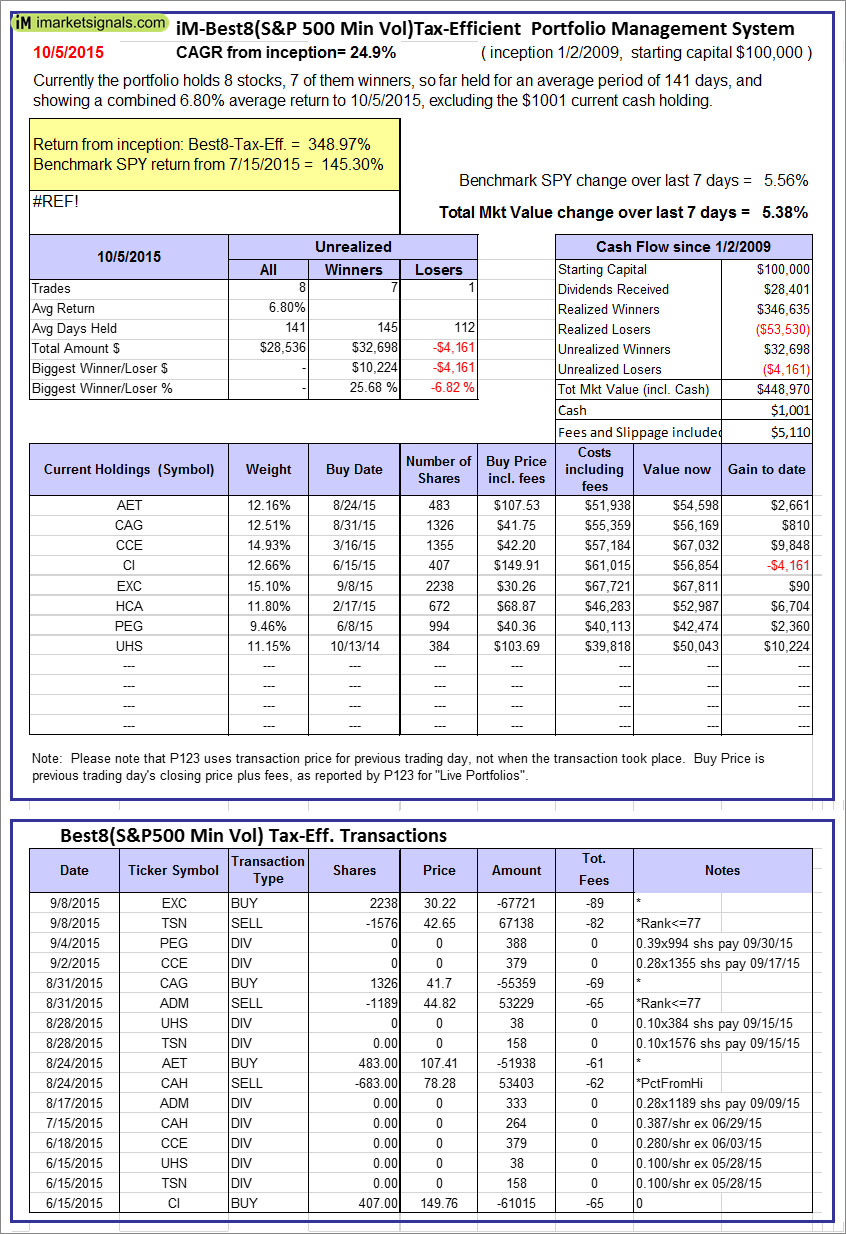 |
The iM-Best8(S&P500 Min Vol)Tax-Efficient model currently holds 8 stocks, 7 of them winners, so far held for an average period of 141 days, and showing a 6.80% return to 10/5/2015. Over the previous week the market value of iM-Best8(S&P 500)Tax-Eff. gained 5.38% at a time when SPY gained 5.56%. A starting capital of $100,000 at inception on 1/2/2009 would have grown to $448,970 which includes $1,001 cash and excludes $5,110 spent on fees and slippage. |
 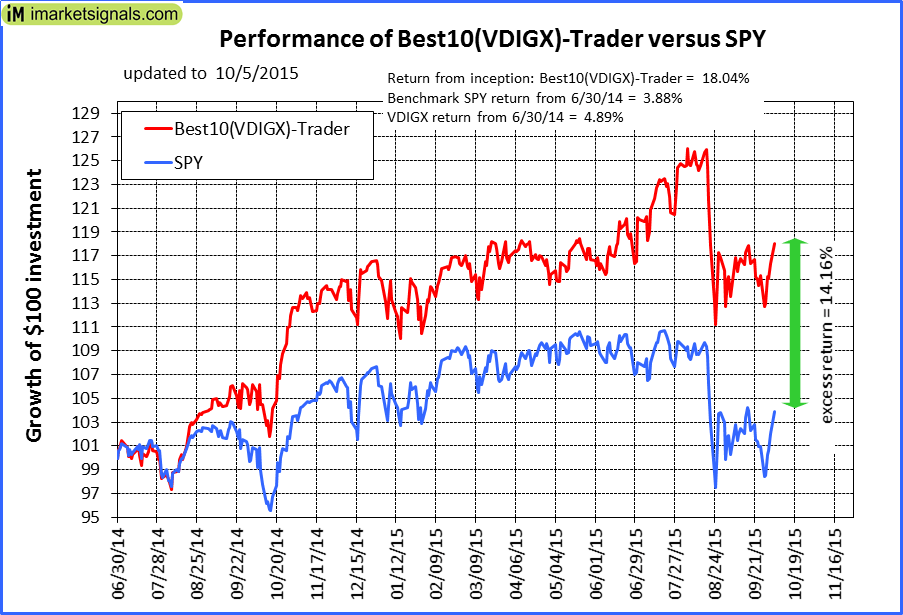 |
The iM-Best10(VDIGX)-Trader model currently holds 10 stocks, 6 of them winners, so far held for an average period of 150 days, and showing a -0.41% return to 10/5/2015. Since inception, on 7/1/2014, the model gained 18.04% while the benchmark SPY gained 3.88% and the ETF VDIGX gained 4.89% over the same period. Over the previous week the market value of iM-Best10(VDIGX) gained 4.69% at a time when SPY gained 5.56%. A starting capital of $100,000 at inception on 7/1/2014 would have grown to $118,038 which includes $203 cash and excludes $650 spent on fees and slippage. |
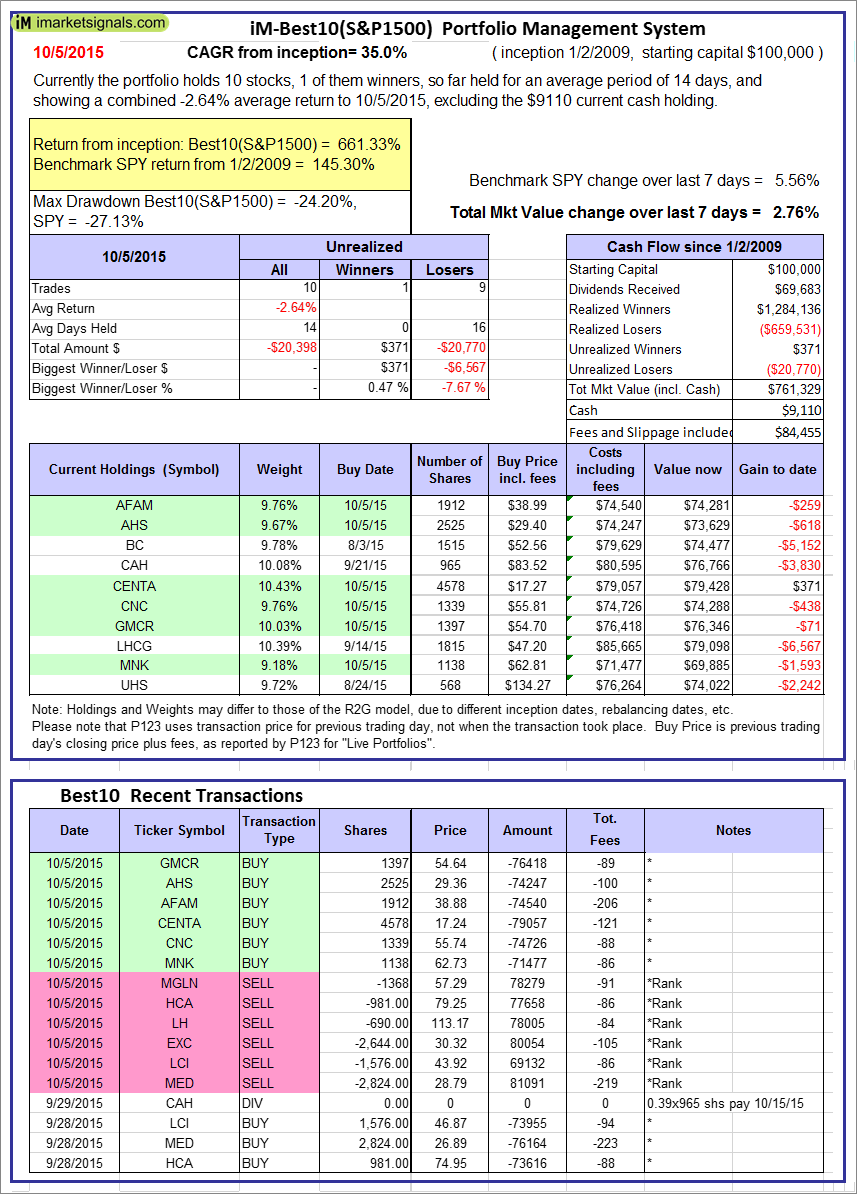 |
The iM-Best10(S&P 1500) model currently holds 10 stocks, 1 of them winners, so far held for an average period of 14 days, and showing a -2.64% return to 10/5/2015. Over the previous week the market value of iM-Best10 gained 2.76% at a time when SPY gained 5.56%. A starting capital of $100,000 at inception on 1/2/2009 would have grown to $761,329 which includes $9,110 cash and excludes $84,455 spent on fees and slippage. |
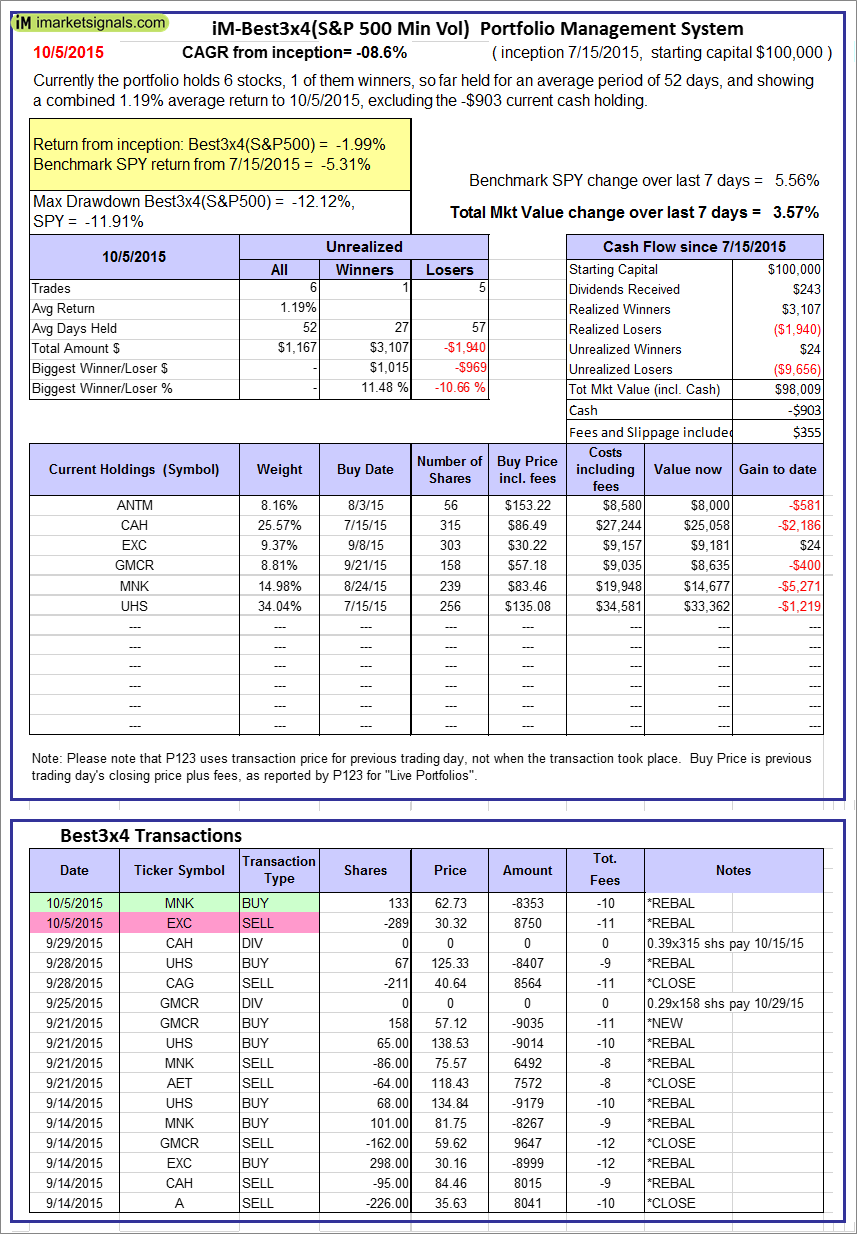 |
The iM-Best3x4(S&P 500 Min Vol) model currently holds 6 stocks, 1 of them winners, so far held for an average period of 52 days, and showing a 1.19% return to 10/5/2015. Over the previous week the market value of iM-Best3x4 gained 3.57% at a time when SPY gained 5.56%. A starting capital of $100,000 at inception on 7/15/2015 would have grown to $98,009 which includes -$903 cash and excludes $355 spent on fees and slippage. |
 |
The iM-Best2x4(S&P 500 Min Vol) model currently holds 4 stocks, 2 of them winners, so far held for an average period of 43 days, and showing a 0.19% return to 10/5/2015. Over the previous week the market value of iM-Best2x4 gained 3.45% at a time when SPY gained 5.56%. A starting capital of $100,000 at inception on 7/16/2015 would have grown to $93,128 which includes $1,163 cash and excludes $235 spent on fees and slippage. |
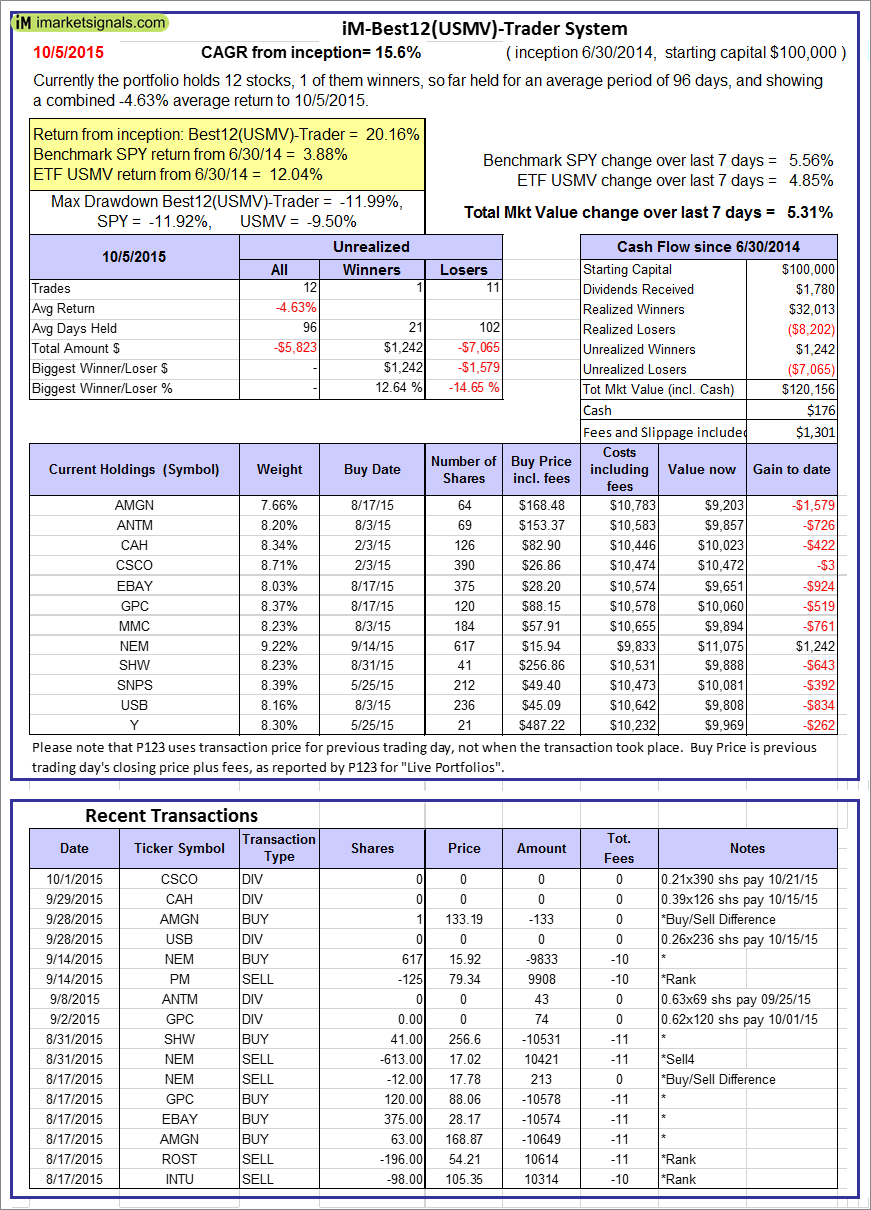 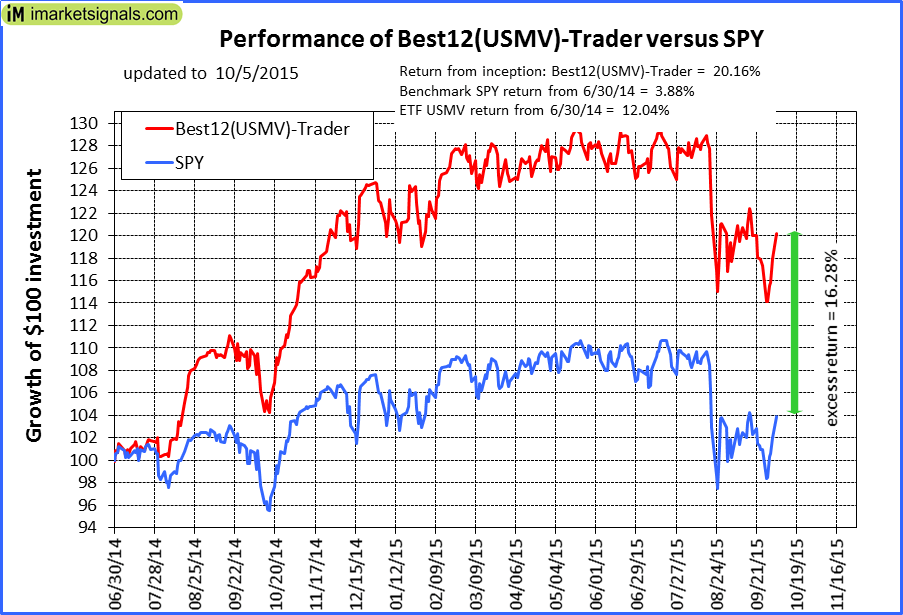 |
The iM-Best12(USMV)-Trader model currently holds 12 stocks, 1 of them winners, so far held for an average period of 96 days, and showing a -4.63% return to 10/5/2015. Since inception, on 7/1/2014, the model gained 20.16% while the benchmark SPY gained 3.88% and the ETF USMV gained 12.04% over the same period. Over the previous week the market value of iM-Best12(USMV)-Trader gained 5.31% at a time when SPY gained 5.56%. A starting capital of $100,000 at inception on 7/1/2014 would have grown to $120,156 which includes $176 cash and excludes $1,301 spent on fees and slippage. |
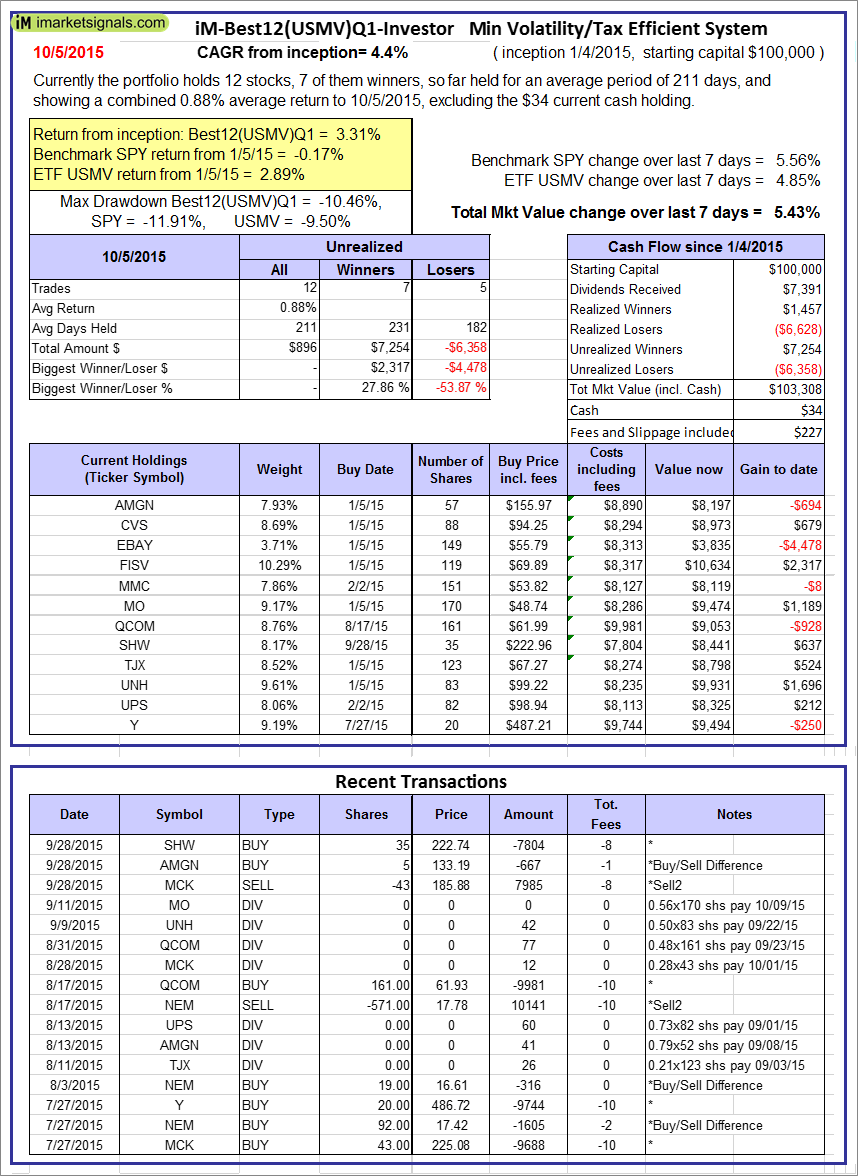 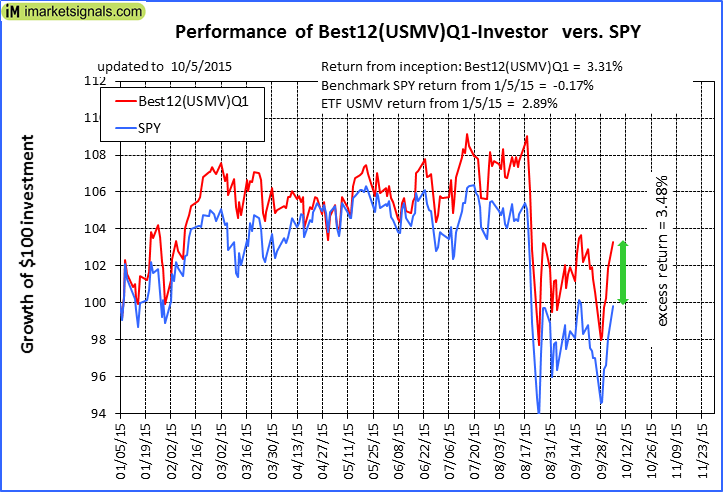 |
The iM-Best12(USMV)Q1-Investor model currently holds 12 stocks, 7 of them winners, so far held for an average period of 211 days, and showing a 0.88% return to 10/5/2015. Since inception, on 1/5/2015, the model gained 3.31% while the benchmark SPY gained -0.17% and the ETF USMV gained 2.89% over the same period. Over the previous week the market value of iM-Best12(USMV)Q1 gained 5.43% at a time when SPY gained 5.56%. A starting capital of $100,000 at inception on 1/5/2015 would have grown to $103,308 which includes $34 cash and excludes $227 spent on fees and slippage. |
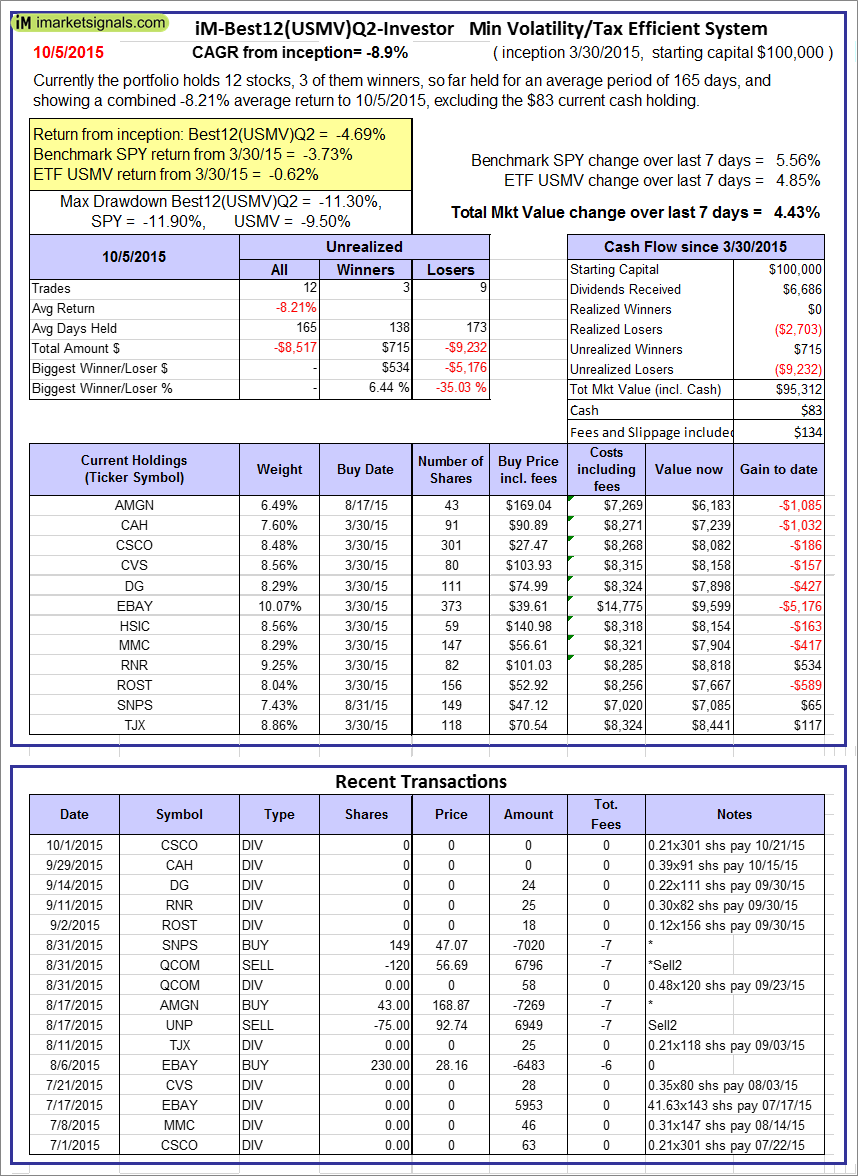 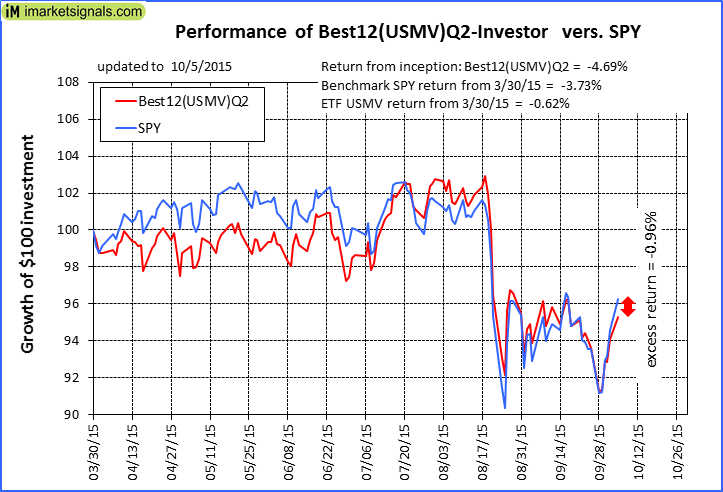 |
The iM-Best12(USMV)Q2-Investor model currently holds 12 stocks, 3 of them winners, so far held for an average period of 165 days, and showing a -8.21% return to 10/5/2015. Since inception, on 3/31/2015, the model gained -4.69% while the benchmark SPY gained -3.73% and the ETF USMV gained -0.62% over the same period. Over the previous week the market value of iM-Best12(USMV)Q2 gained 4.43% at a time when SPY gained 5.56%. A starting capital of $100,000 at inception on 3/31/2015 would have grown to $95,312 which includes $83 cash and excludes $134 spent on fees and slippage. |
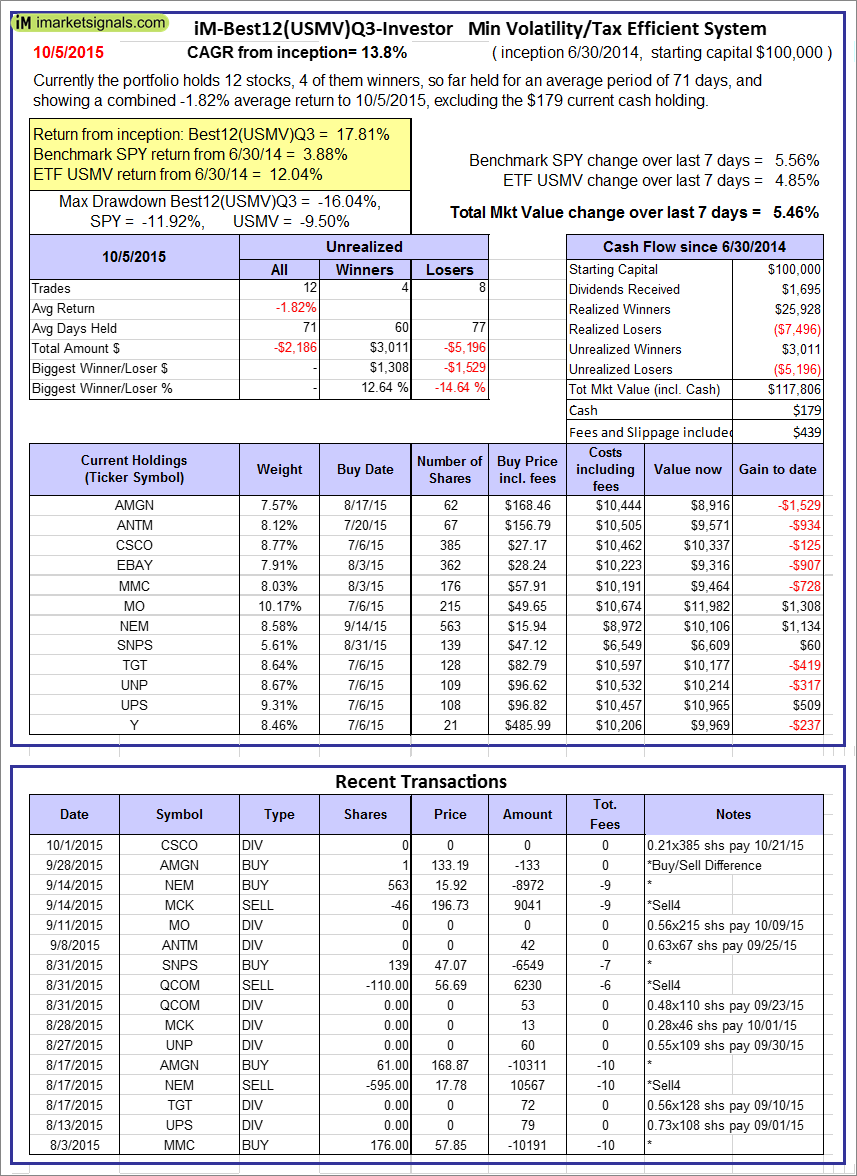  |
The iM-Best12(USMV)Q3-Investor model currently holds 12 stocks, 4 of them winners, so far held for an average period of 71 days, and showing a -1.82% return to 10/5/2015. Since inception, on 7/1/2014, the model gained 17.81% while the benchmark SPY gained 3.88% and the ETF USMV gained 12.04% over the same period. Over the previous week the market value of iM-Best12(USMV)Q3 gained 5.46% at a time when SPY gained 5.56%. A starting capital of $100,000 at inception on 7/1/2014 would have grown to $117,806 which includes $179 cash and excludes $439 spent on fees and slippage. |
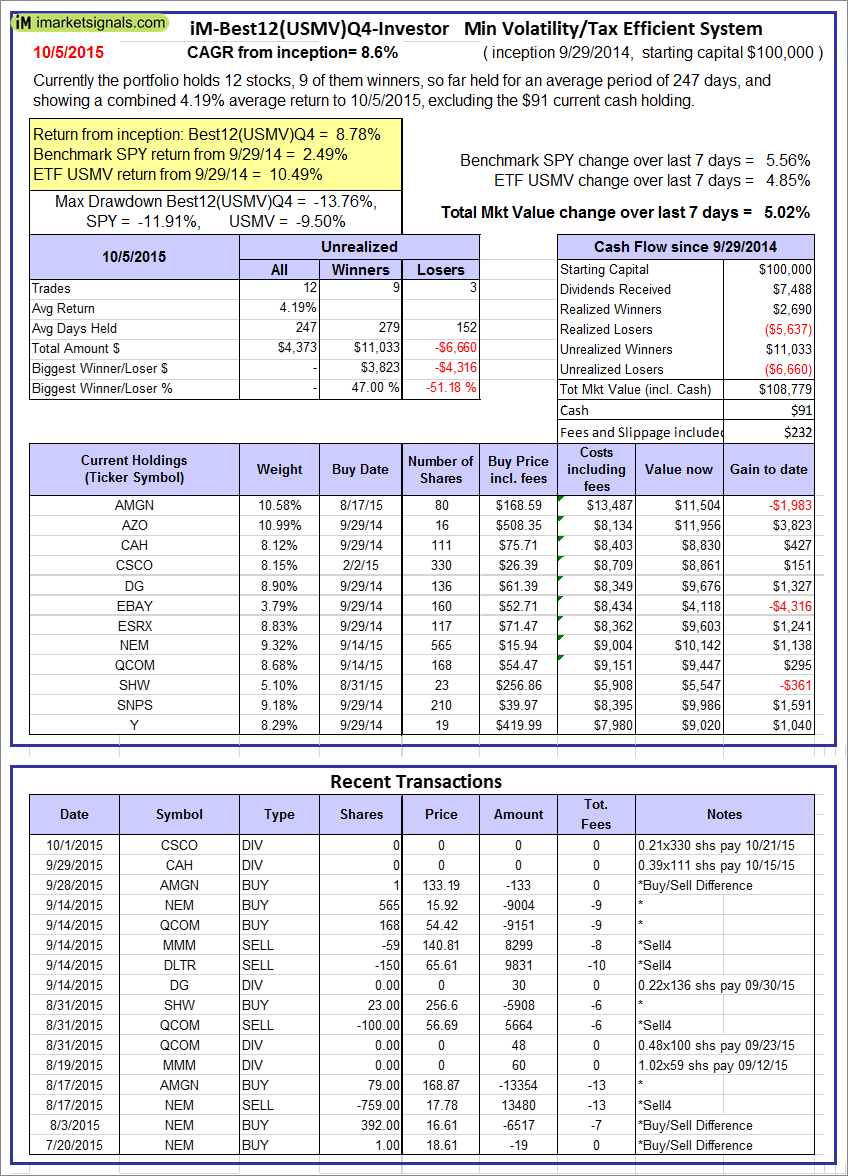 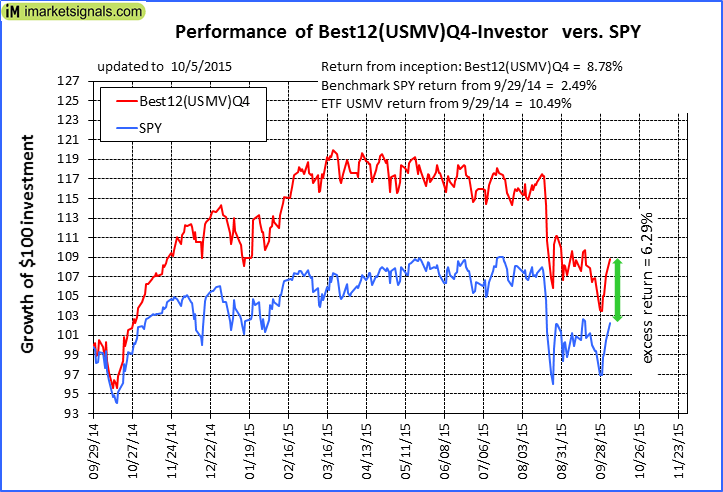 |
The iM-Best12(USMV)Q4-Investor model currently holds 12 stocks, 9 of them winners, so far held for an average period of 247 days, and showing a 4.19% return to 10/5/2015. Since inception, on 9/30/2014, the model gained 8.78% while the benchmark SPY gained 2.49% and the ETF USMV gained 10.49% over the same period. Over the previous week the market value of iM-Best12(USMV)Q4 gained 5.02% at a time when SPY gained 5.56%. A starting capital of $100,000 at inception on 9/30/2014 would have grown to $108,779 which includes $91 cash and excludes $232 spent on fees and slippage. |
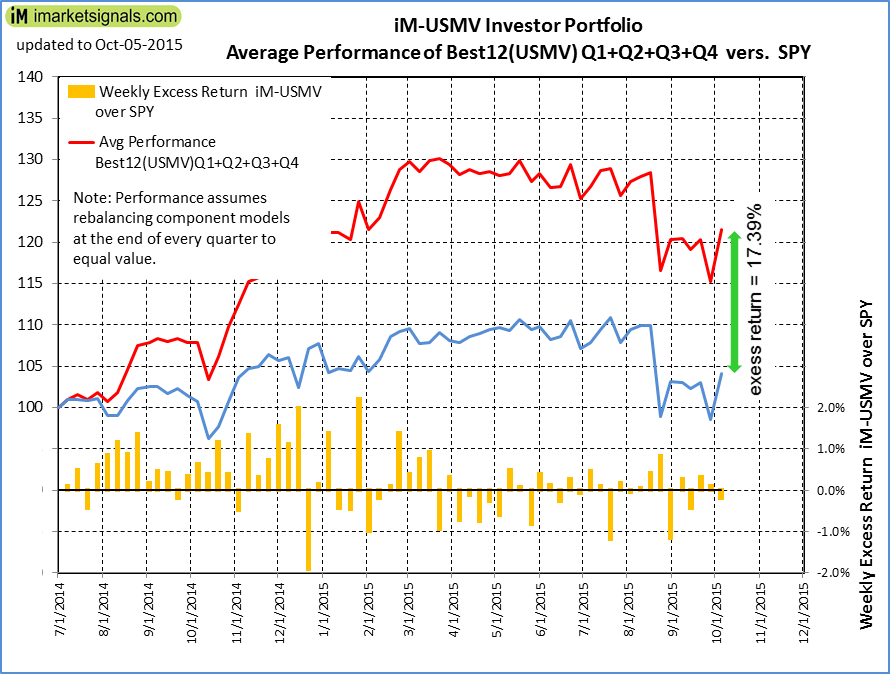 |
Average Performance of iM-Best12(USMV)Q1+Q2+Q3+Q4-Investor resulted in an excess return of 17.39% over SPY. (see iM-USMV Investor Portfolio) |
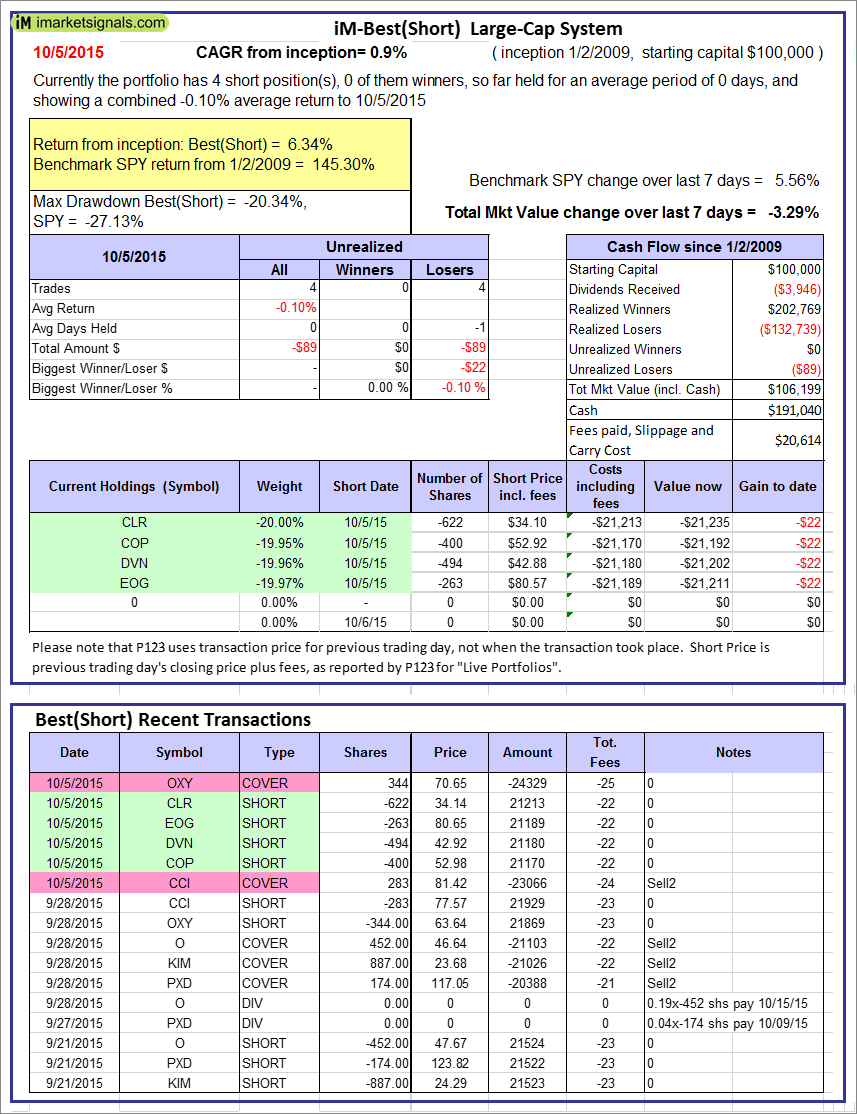 |
The iM-Best(Short) model currently holds 4 position(s). Over the previous week the market value of iM-Best(Short) gained -3.29% at a time when SPY gained 5.56%. Over the period 1/2/2009 to 10/5/2015 the starting capital of $100,000 would have grown to $106,199 which includes $191,040 cash and excludes $20,614 spent on fees and slippage. |
iM-Best Reports – 10/5/2015
Posted in pmp SPY-SH
Leave a Reply
You must be logged in to post a comment.