
- This model can hold 3 to 12 stocks, at variable weightings, selected by a ranking system from a minimum volatility stock universe of the S&P500.
- The model has 12 equally weighted slots; a very high ranked stock could occupy a maximum of 4 slots, that is a nominal 33% weighting of the model’s total assets.
- When adverse stock market conditions exist, the model reduces stock holdings by 35% and invests the proceeds in the -2x leveraged ProShares UltraShort S&P500 ETF (SDS).
- The backtest produced a simulated average annual return of about 36% from Jan-2000 to end of June-2015 with a maximum draw-down of minus 22%.
The Minimum Volatility Stock Universe of the S&P 500
Minimum volatility stocks should exhibit lower drawdowns than the broader market and show reasonable returns over an extended period of time. It was found that a universe of stocks mainly from the Health Care, Consumer Staples and Utilities sectors satisfied those conditions.
This minimum volatility universe of the S&P 500 currently holds 117 large-cap stocks (market cap ranging from $4- to $277-billion), and there were 111 stocks in the universe at the inception of the model, in Jan-2000.
Trading Rules
The ranking system employed is the same as for our Best8(S&P500 Min-Volatility) system, but the trading system differs in regard to the hedge used and some additional sell rules.
The model assumes that stocks are bought and sold at the next day’s average of the Low and High price after a signal is generated. Variable slippage of about 0.12% of a trade amount was taken into account to provide for brokerage fees and transaction slippage.
Buy Rules:
- Some of the largest market cap stocks are exclude from being selected.
Sell Rules:
- Rank
- Keep the weight of a position in a slot to +10% and -15% of the nominal weight.
Realized Trades Analysis
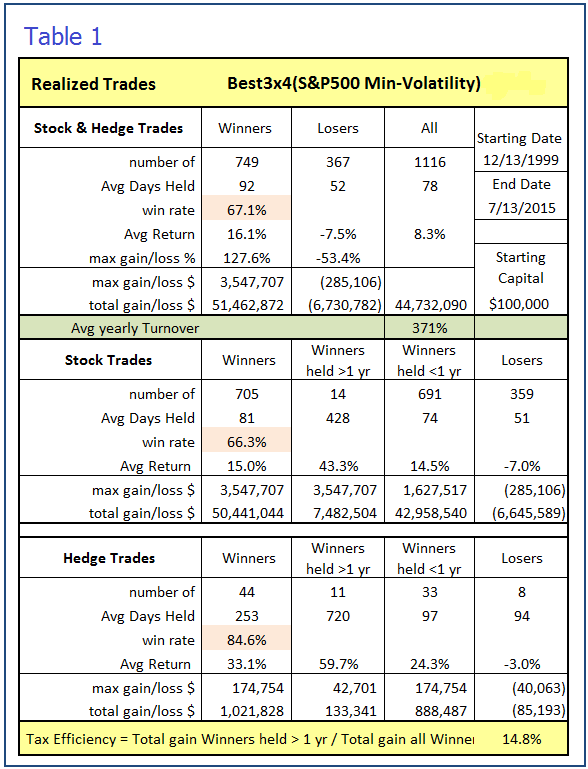
An analysis of all the realized trades is shown in Table 1. There were 749 winning trades out of 1116, resulting in a win rate of 67.1%. The average yearly turnover was about 370%. On average a position was held for 78 days.
Holdings
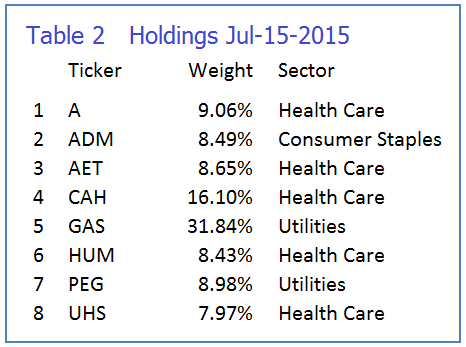
The models can potentially hold a maximum of 12 different stocks, and a minimum of 3 different stocks. As of July 15 it held 8 different stocks with various weights as shown in Table 2.
Performance
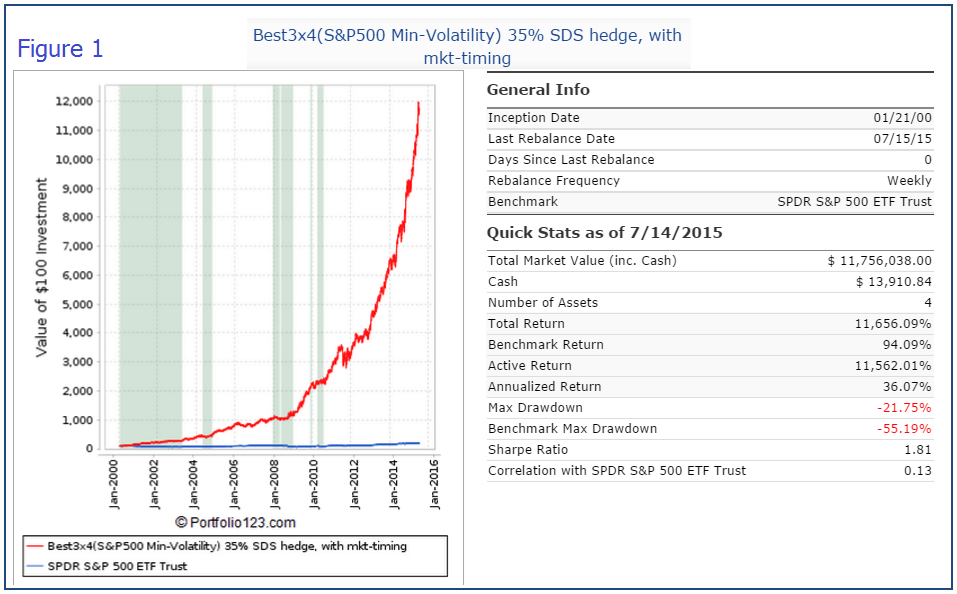
In the figures below, the red graph represents the model and the blue graph shows the performance of benchmark SPY. The backtest period was 15.5 years, from January 2000 to June 2015.
Figures 1 to 5 show performance comparisons:
- Figure 1: Performance 2000-2015 with market-timing and hedging with long SDS. The model uses a hedge ratio of 35% of current holdings during down-market conditions. (Note: The inception date of SDS was Jul-2006. Prior to this date values are “synthetic”, derived from the S&P 500.) Annualized Return= 36.1%, Max Drawdown= -21.8%.
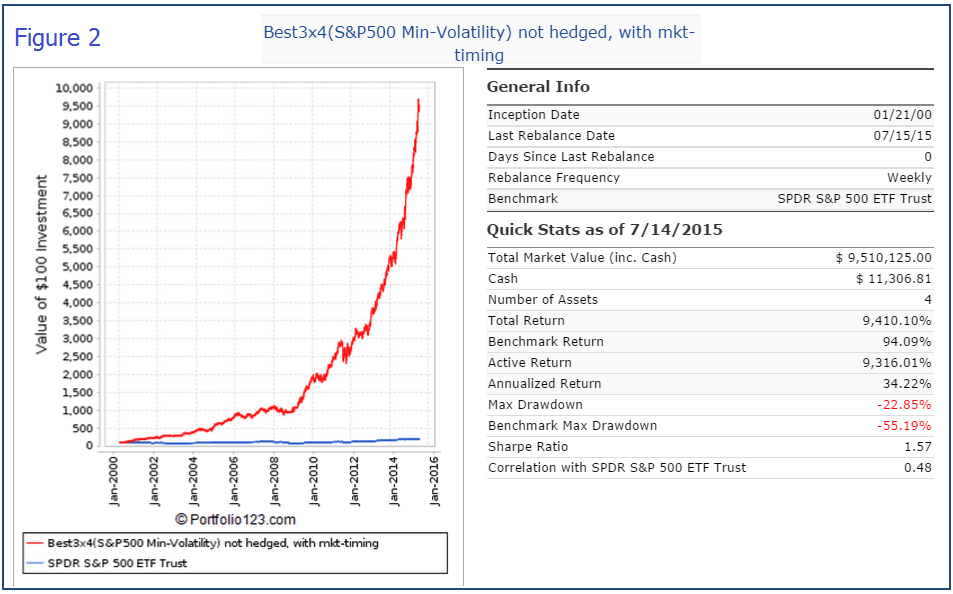
- Figure 2: Performance 2000-2015 without hedging. Annualized Return= 34.2%, Max Drawdown= -22.9%.
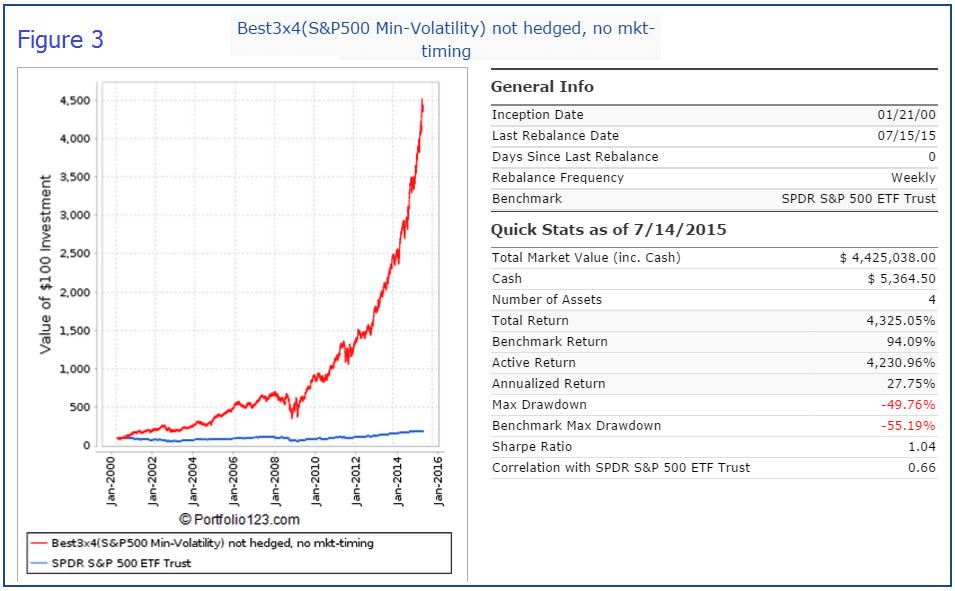
- Figure 3: Performance 2000-2015 without hedging and market timing. Annualized Return= 27.8%, Max Drawdown= -49.8%.
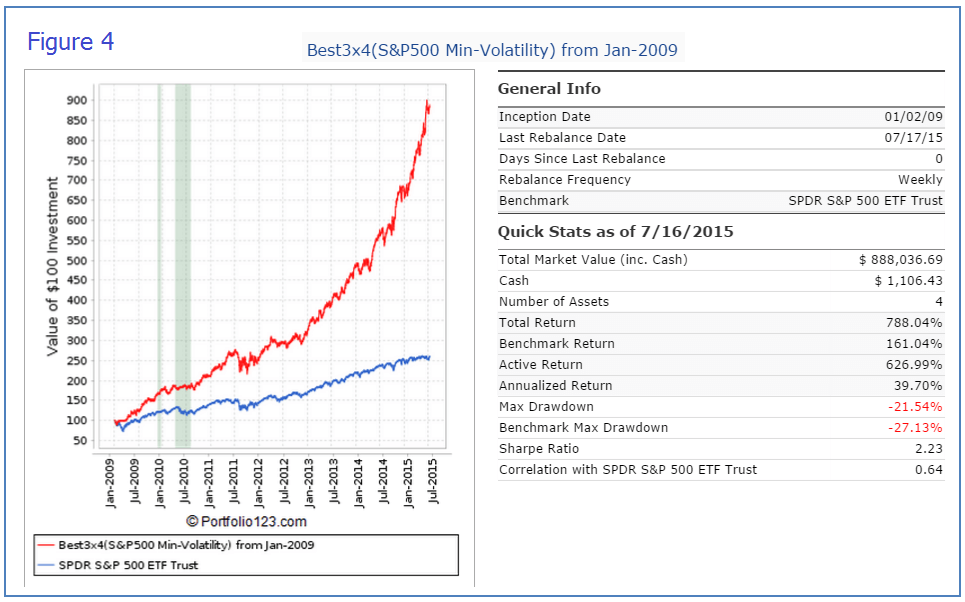
- Figure 4: Performance Jan-2000 to Jun-2015 . Annualized Return= 39.7%, Max Drawdown= -21.5%.
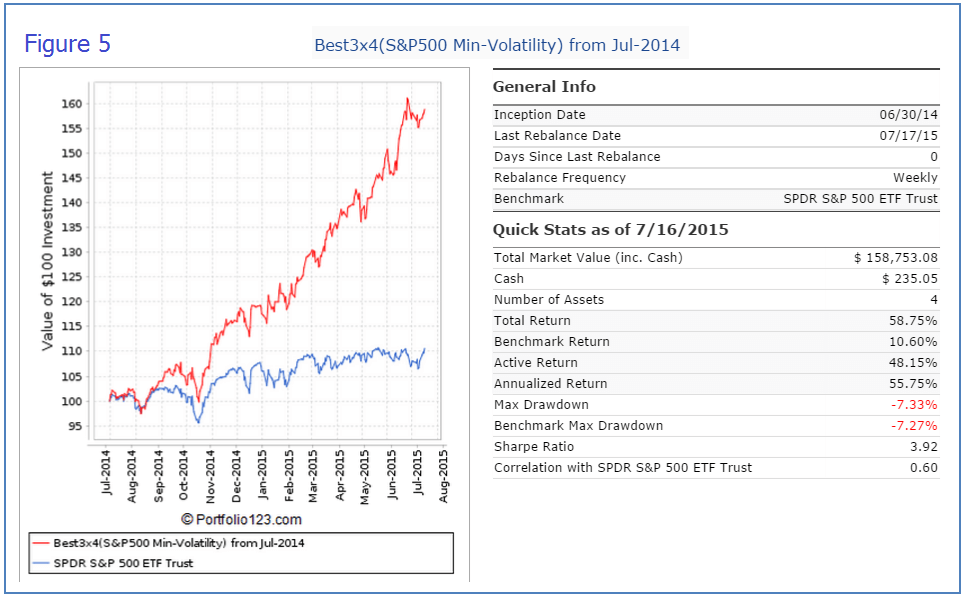
- Figure 5: Performance Jul-2014 to Jun-2015. Total Return= 58.8%, Max Drawdown= -7.3%. This can be directly compared with our Best12(USMV)-Trader model’s return of 28.6% for the same time period.
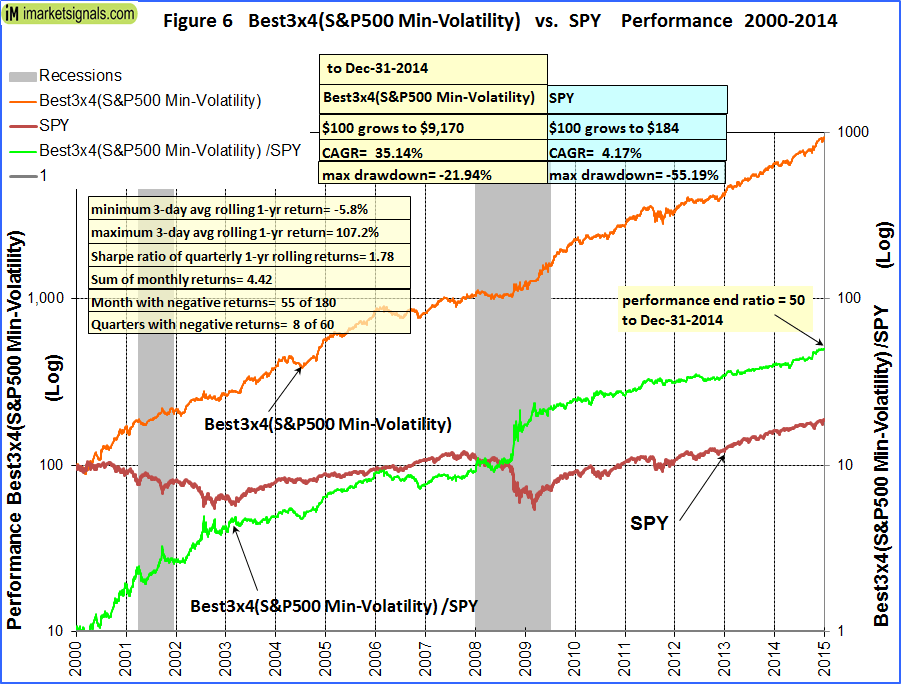
- Figure 6: Performance versus SPY. Over the 15-year period $100 invested at inception would have grown to $9,170, which is 50-times what the same investment in SPY would have produced.
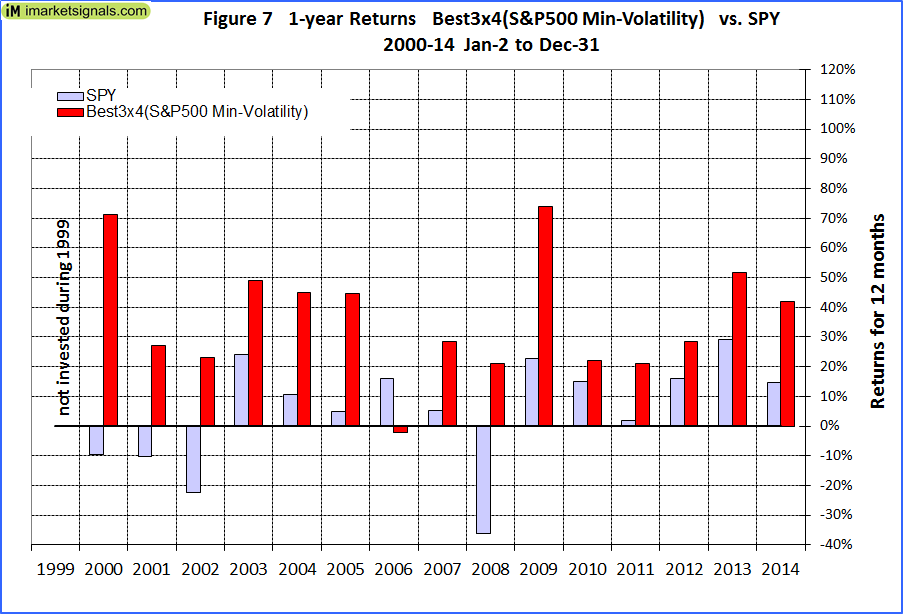
- Figure 7: 1-year returns. Except for 2006 the 1-year returns were always higher than for SPY.
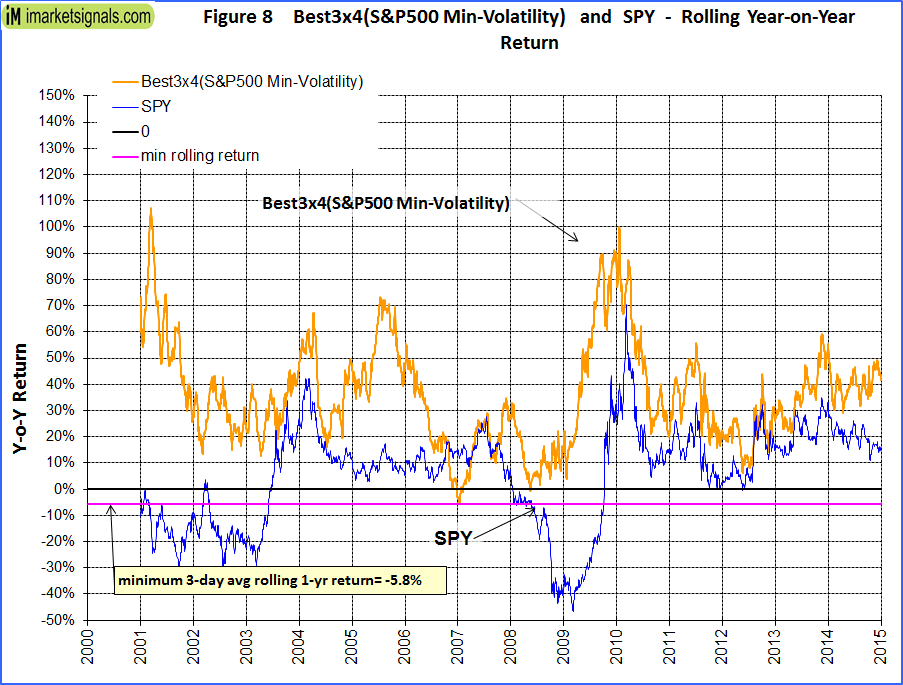
- Figure 8: 1-year rolling returns. The minimum 1-year rolling return of the 3-day moving average was -5.8% early in 2007.
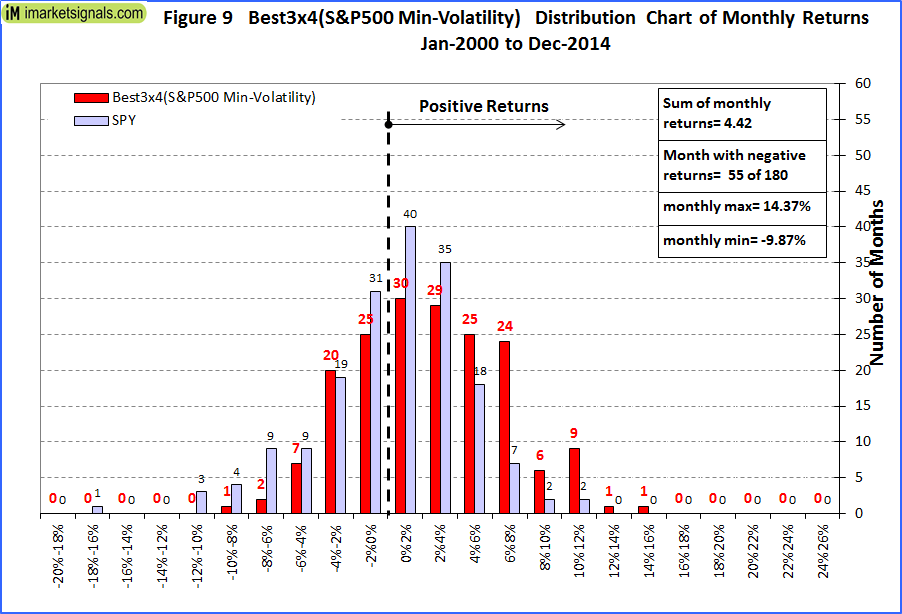
- Figure 9: Distribution of monthly returns relative to SPY.
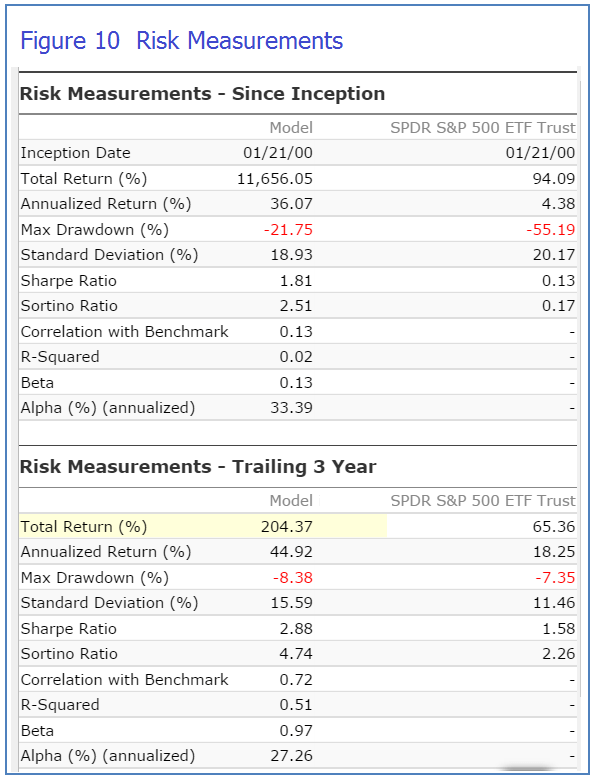
- Figure 10: Risk measurements for 15.5-years and trailing 3-year periods.
Following the Model
This model can be followed, exclusively, live at iMarketSignals where it will be updated weekly together with our other trading models. It will not be available as a subscription model at Portfolio 123.
Disclaimer
One should be aware that all results shown are from a simulation and not from actual trading. They are presented for informational and educational purposes only and shall not be construed as advice to invest in any assets. Out-of-sample performance may be much different. Backtesting results should be interpreted in light of differences between simulated performance and actual trading, and an understanding that past performance is no guarantee of future results. All investors should make investment choices based upon their own analysis of the asset, its expected returns and risks, or consult a financial adviser. The designer of this model is not a registered investment adviser.
Just so i understand your terminology, when you refer to “hedging” you are referring to the purchase of the SDS (always at 35% of portfolio?) and when you are refer to “market timing” you are just referring to the reduction from 100% long to only 65% long. In other words, Fig 2 is with reductions on the long allocation (marekt timing) but no purchase of SDS and Fig 4 is only long stocks at 100% long (no reduction to 65% long and no SDS). Is this a correct understanding?
Steve W
Hedging means selling at certain times 35% of the model’s holdings and buying SDS from the proceeds.
There is a market timing buy rule which specifies when the model can buy stocks. There is also a market timing sell rule when the model sells all stocks. There are periods when the model holds no stocks and therefore also no SDS hedge, because the 35% hedge ratio excludes cash.
Your interpretation of Figures 2 and 3 is correct.
Georg,
Given the similar performance stats, are there any reasons one would pick this strategy over its R2G cousin other than price savings?
There is no reason why one would pick the Best3x4 in preference to the R2G Best8(S&P500 Min-Volatility) model given the similar historic performance.
When did this model go live? I don’t put too much faith into backtested results. Do you have a spreadsheet to show how each of your models has performed since you have launched them (without backtested figures)?
This model went live July 20, 2015. One should observe out-of-sample performance for confirmation of backtest results. Please check our USMV models for an example of live performance versus backtest performance.
Are there performance and backtest figures available for the Best2x8 system as well?
George, Trying to understand this model. Currently holds 726 share SDS which is 15% of total value. Apparently 10/26 bought 422 shares and 11/2 bought 304 shares. I thought the model went to 35% SDS in adverse condition?
The 3×4 combo has four component models. Only two of the component models currently hold SDS. The 11/16/2015 holdings list 2xSDS, meaning that SDS has a weight of 2 x 8.33% = 16.67% in the combo, which is close to your 15%.
Hi Geog
Quick question. Is the Minimum Volatility Universe of the S&P500 permanently selecting from only the healthcare/consumer staples/utilities industries – or will it move onto other industries if they become more favorable? Might it take a long time for these new industries to come to light??
Thanks
Jim
For this model the Minimum Volatility Universe of the S&P500 consists of only the healthcare/consumer staples/utilities sectors. Additionally industry “Leisure” is included from the Consumer Discretionary sector. These are the only sectors/industry from which the model selects its stocks.