
Note: First published here on April 17, 2012 and updated October 3, 2014 and originally co-authored with Dwaine van Vuuren.
For what is considered to be a lagging indicator of the economy, the unemployment rate provides surprisingly good signals for the beginnings and ends of recessions. We have developed a model that uses unemployment figures to produce these signals and to determine the probability of when a recession may start.
The current recession call from the Economic Cycle Research Institute (ECRI) is now more than six months old. Our model based on the unemployment rate which is presented here does not support ECRI’s call; it also tells us that a recession will not happen anytime soon.
The unemployment rate indicator
Monthly unemployment data is listed at FRED from 1948 onwards, a dataset that spans 11 recessions and covers a much longer period than the historical data for most other indicators – the Conference Board LEI, for example, or the ECRI Weekly Leading Index – whose performance one can only evaluate for the last seven recessions.
The unemployment rate (UER) over time is shown in Figure 1. It is depicted by the blue and red graphs, which are the short exponential moving average (EMA) and long EMA of the unemployment rate, respectively. (Appendix 1, for those who are interested, is a description of EMA.) The gray vertical bar graphs represent the 11 recessions during the time span the data cover.
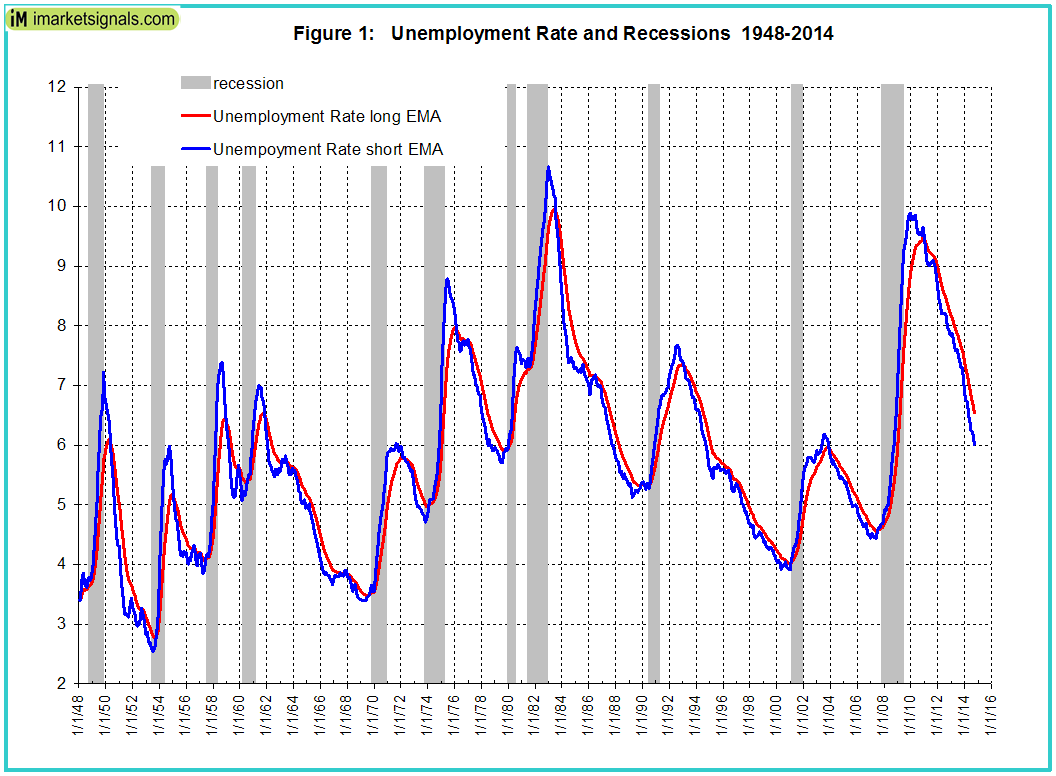
It is apparent from Figure 1 that the blue graph, the short EMA of the UER forms a trough prior to the beginning of each recession.
Figures 2.1 and 2.2 incorporate the information depicted in Figure 1 and also show:
- The smoothed eight-month annualized growth rate of the unemployment rate, calculated from its 15-week moving average, which we refer to as “UERg.” That’s the green graph. (Appendix 2 describes how to calculate UERg.)
- The time periods when the basic unemployment rate and/or UERg signaled recession, which are the gold-shaded parts of the graph.
- The dates of ECRI’s four recession calls of 1990, 2001, 2008 and 2011. These are the vertical purple lines in figure 2.2.
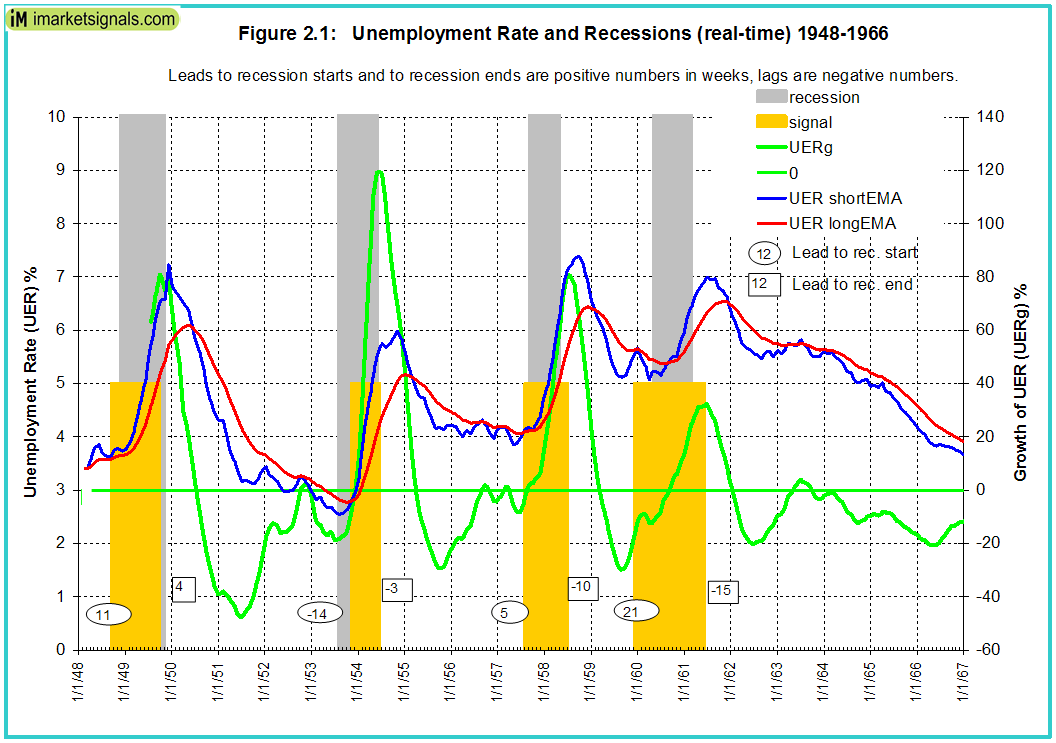
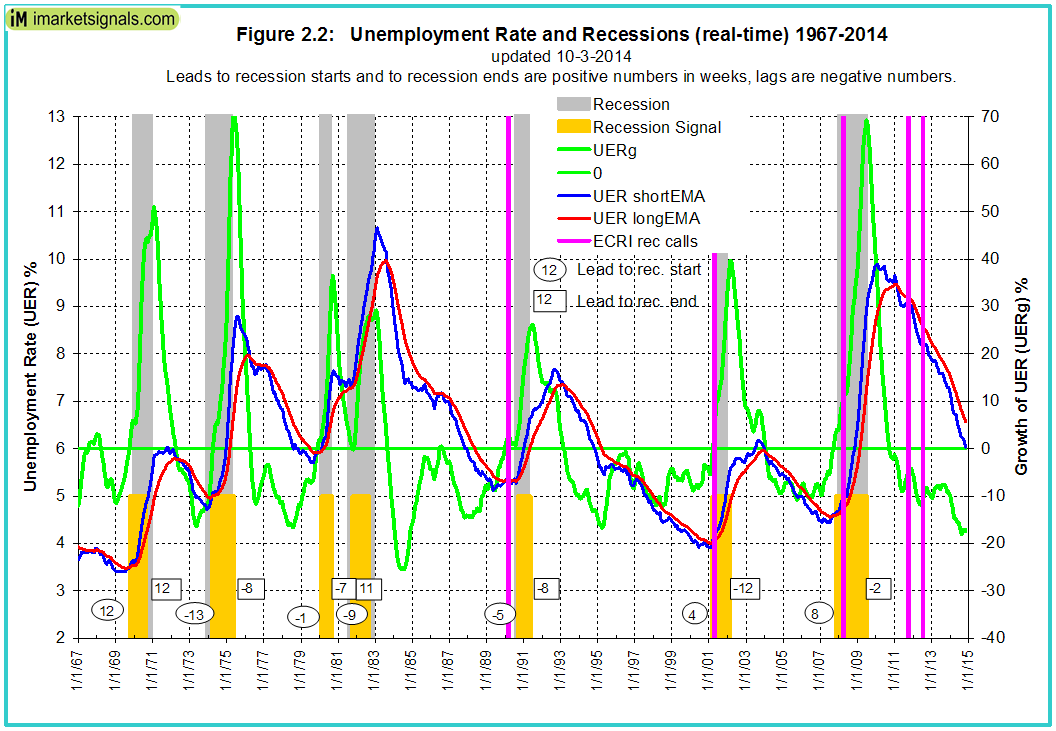
One can see from Figures 2.1 and 2.2 that the UERg, in green, has a well defined peak near the end of every recession, when the slope of the growth rate of the UER abruptly changes from positive (rising) to negative (declining).
It is similarly evident that the ECRI’s recession calls in 1990, 2001 and 2008 always coincided with a trough where the short EMA of the unemployment rate rose above its long EMA; UERg was always positive at those times as well.
This was not the case at the end of September 2011, however, when ECRI issued its most recent recession call. Then the unemployment rate had just formed a peak and the short EMA was below the long EMA of the unemployment rate, all completely atypical of when past recessions occurred. (Appendix 3 has the dates of ECRI’s recession calls and the corresponding recession signals from the unemployment rate.)
Conditions that indicate recession starts and ends
Recessions generally start when one the following three conditions occurs:
- The short EMA of the unemployment rate rises and crosses the long EMA to the upside, and the difference between the two EMAs is at least 0.07.
- UERg rises above zero, the long EMA of the unemployment rate has a positive slope, and the difference between the long EMA at that time and the long EMA 10 weeks before is greater than 0.025.
- The 19-week rate of change of the unemployment rate is greater than 8.0%, while simultaneously the long EMA of the unemployment rate has a positive slope and the difference between the long EMA at the time and the long EMA 10 weeks earlier is greater than 0.015.
Recession ends are generally signaled when:
- UERg as calculated from a 4-week moving average of the unemployment rate crosses from above to below UERg as calculated from a 15-week moving average, and UERg as calculated from a 15-week moving average is greater than 20%.
Probability of recession start
We calculated the probability a recession will start in any given week based on the features which generally indicate recession starts.
The following probability curve resulted over the lifespan of the data (Figure 3):
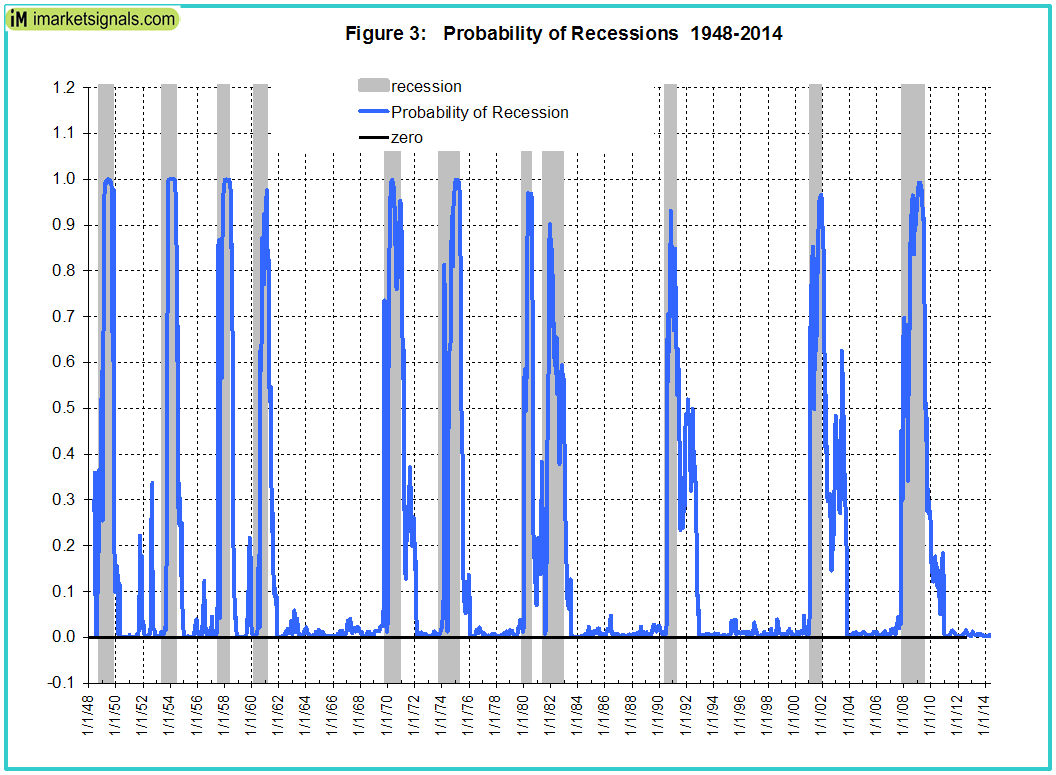
This is a very satisfactory result, given especially that it is derived, essentially, from a single factor — the unemployment rate.
Present conditions
The ends of the graphs in Figure 4 depict the current situation, with the September 5.9% unemployment number included. The graphs are plotted to the beginning November 2014, when the October unemployment statistics will be released.
We see none of the conditions for a recession to start. The unemployment rate is not forming a trough. Its short EMA is well below its long EMA. The UERg has had a negative slope since the last week of September 2011, when ECRI made its recession call. Additionally, the UERg is currently at its lowest level – approximately -17.1% – since it fell below zero in the middle of September 2010.
Also the 19-week rate of change of the unemployment rate is now -6.3%, far below the critical signal level, and the probability that a recession will start now is zero, as shown by the probability of recession graph in Figure 3.
For a recession to occur, the unemployment rate graphs would have to, as a minimum requirement, move sideways for a while and then turn upwards. Alternatively, the UERg graph could turn upwards and rise above zero, or the 19-week rate of change graph of unemployment rate itself would have to approach 8%. There is no indication that any of this will happen anytime soon. Currently the trajectories of both the unemployment rate and its growth rate are downwards, as was the case after all previous recessions.
One can therefore reasonably conclude, based on the historic evidence of these unemployment-based indicators, that there will be no recession in the near future and that ECRI’s last recession call was definitely premature.
Appendix 1
Exponential Moving Average
The exponential moving average (EMA) is a type of filter that applies weighting factors to the observed data values. The weighting for each older data point decreases exponentially, never reaching zero. For a detailed description see http://en.wikipedia.org/wiki/Moving_average
The formula used for calculating the EMA is
EMAthis week = EMAlast week +α× (valuethis week – EMAlast week)
The coefficient α represents the degree of weighting decrease, a constant smoothing factor between 0 and 1. A higher α discounts older observations faster. Alternatively, α may be expressed in terms of N time periods, where α = 2/(N+1). For example, N = 60 for the long EMA of UERresults in a smoothing factor of 0.033, and N = 9 for the short EMA of UERresults a smoothing factor of 0.20. The “long” and “short” refers to the N time periods used in the calculation of the smoothing factor for the EMAs.
Appendix 2
Calculating the annualized growth rate of UER
The eight-month smoothed compound annualized growth rate of UER is calculated as follows:
UERg is the compound annualized growth rate of the UER for a 35.5 week period. MA1 is the 15 week moving average of the UER and MA2 is the moving average of MA1 over the preceding 70 weeks. Because the 70-week average in the denominator is centered 35.5 weeks before the current middle of the week, the ratio MA1/MA2 yields the change over a 35.5-week period, i.e. over approximately eight months.
One can calculate the UERg using the Excel function XIRR.
=XIRR(cell 1:cell 2,(date)35-weeks-ago:(date)now)
where cell 1 contains: -1 and cell 2 contains: MA1/MA2now
We used MA1 for 15 weeks to calculate UERg and also MA1 for 4 weeks to determine the peaks of UERg at the end of recessions as discussed in the article.
Appendix 3
Dates of ECRI recession calls and corresponding signals from the UER
| Start of recession | ECRI recession | Lead | UER signal lead |
| NBER date | call date | weeks | weeks |
| 8/1/1990 | 3/9/1990 | 21 | -5 |
| 4/1/2001 | 4/18/2001 | -2 | 2 |
| 1/1/2008 | 3/31/2008 | -13 | 6 |
| n.a. | 9/30/2011 | n.a. | no signal |
A negative lead indicates that the signal was late. It is evident from this table that ECRI’s recession calls are not superior to the models’ signals.
___________________________________________________________________
Very great model! However, still not sure how monthly unemployement rate be transformed into weekly for calculation.