
Economic indices, each a combination of a different set of economic data, often signal contradictory states of the economy. Not surprisingly, many prominent analysts relying on these indices have made incorrect forecasts. To aid recession forecasting, we now introduce the BCIw, an index derived from our iMarketSignals’ Business Cycle Index (BCI), calibrated in weeks to recession. Yes, you read this correctly; for example, if the BCIw has a value of 19 it indicates that there is a high probability of a recession starting in 19 weeks.
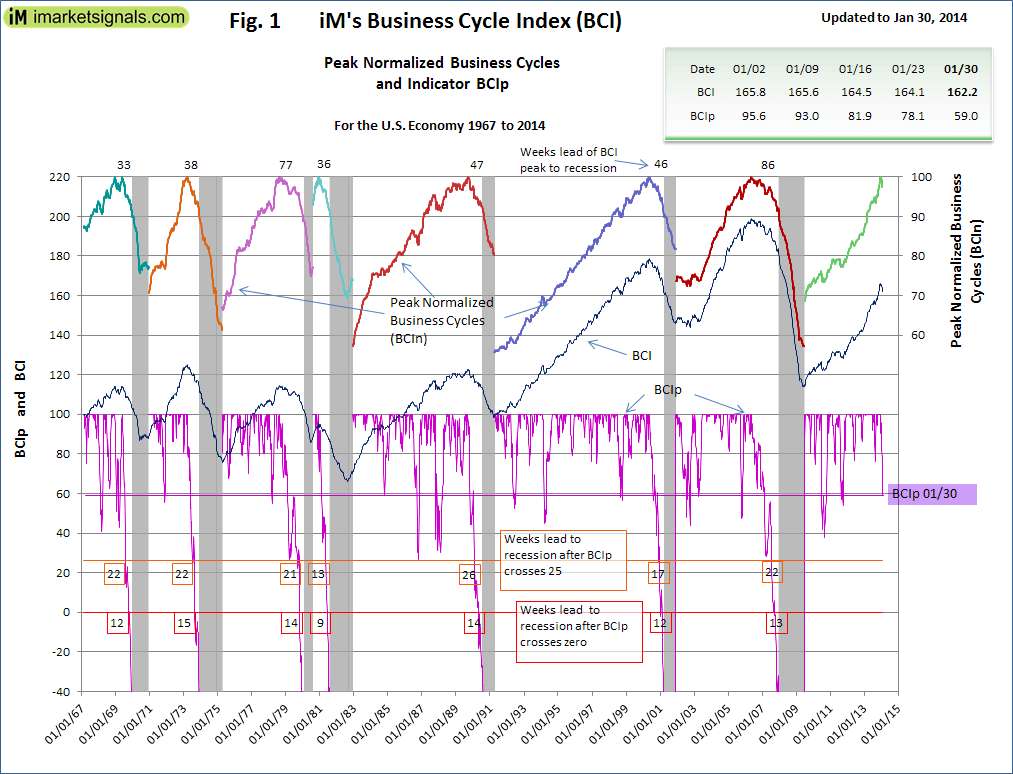
The BCIp is derived from the BCI, is shown in Figure-1 and described in this article, and has consistently captured the last seven recessions. Although, BCIp currently at 59.0 is still far away from heralding a recession, it has however a downward trend now. A prudent investor may ask: “How does it compare to the past and how far are we away from a possible recession?”
In Figure-2 below we zoom in to the prior year of each NBER recession and plot the tracks of BCIp for 50 weeks to the recession start, for each business cycle overlaid in time. We averaged the tracks of six recessions (the double dip 81 recessions was excluded from the average as its track proved to be statistically outside the normal population of the remaining six) and we calculated a best fit second order curve to fit the average, the dark pink convex curve. Finally, a statistical upper and lower envelope was also calculated as second order curves; these are shown dotted.
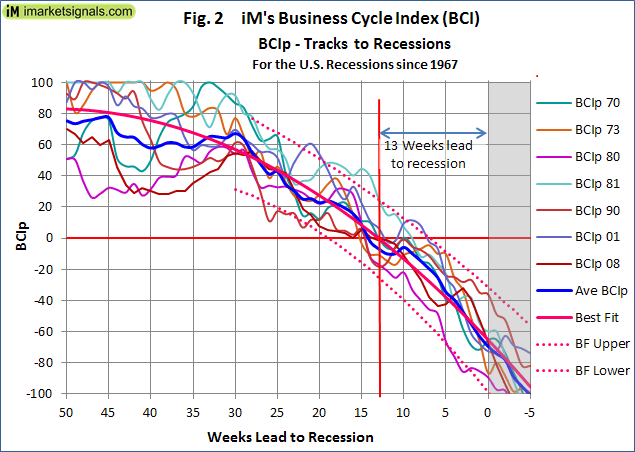
The closely matched and tightly bunched graphs form the basis for the development of the new and unique indicator BCIw. Knowing the formula for the best fit curve allows us to substitute the actual value of the BCIp into that formula to obtain a value in weeks which we define as the indicator BCIw; BCIw = F(BCIp) where F is the function that represents the best fit average curve. The relevancy of this method is that the BCIw value is not a number referenced to an arbitrary benchmark, but its value is expressed in weeks to recession, which is easy to understand. Our new indicator BCIw is shown in Figure 3 below (Note: This is for the situation of October 6 in 2011). The horizontal scale is calendar weeks prior to the NBER recession start and the vertical scale is the BCIw, or estimated weeks to the recession.)
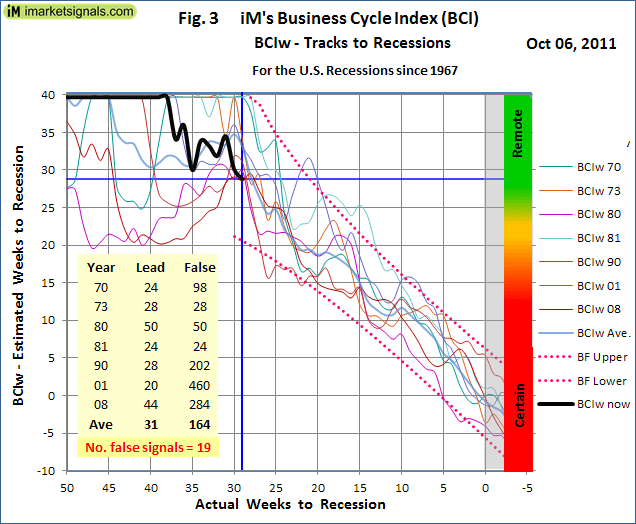
This figure needs some explaining; all the previous BCIw tracks to recession are shown, including the average track in a bolder light blue color. The calculated best fit average track is not shown as it would be a straight 45 degree line because BCIw equals actual weeks to recession, however the upper and lower envelope limits are shown. The bold black line is the BCIw, and its endpoint by definition is where the horizontal and vertical axis values are equal, as shown by the blue cross-hairs. From this chart we can read following data:
- There was a possibility that on Oct-06-2011 a recession was about 28 weeks away, with lower limit 21 weeks and upper limit 40+ weeks, as read from the intersection of the vertical blue cross-hair line and the dotted upper and lower limits.
- Indeed, this state of the BCIw has lead to a recession with an average lead time of 31 weeks (column labeled Lead), however in the business cycles for 1970, 1980, 1990, 2001, and 2008 this level was a false alarm first recorded 98, 50, 202, 460 and 284 weeks before the respective recession as listed under the column labeled “False”
- The last line in the table indicates that the level was recorded on 19 other occasions with the economy recovering thereafter.
- The horizontal cross-hair points to a recession probability indicator, green being remote and red being near certain. Once BCIw reached 19 weeks, a recession always followed in the past.
We chose the Oct 6, 2011 situation as that is one week after ECRI’s public recession call which may have caused many unsuspecting investors to reduce their stock market exposure. However, with supporting data from Figure-1 and Figure-3, it immediately would become apparent that ECRI’s call was premature, a cautious “maybe let’s see what the next month brings” would have been a more prudent approach. As it turned out, the black line of Figure-3 had bottomed that week and rose thereafter, the market gained as well from then onward, more than 60% to date.
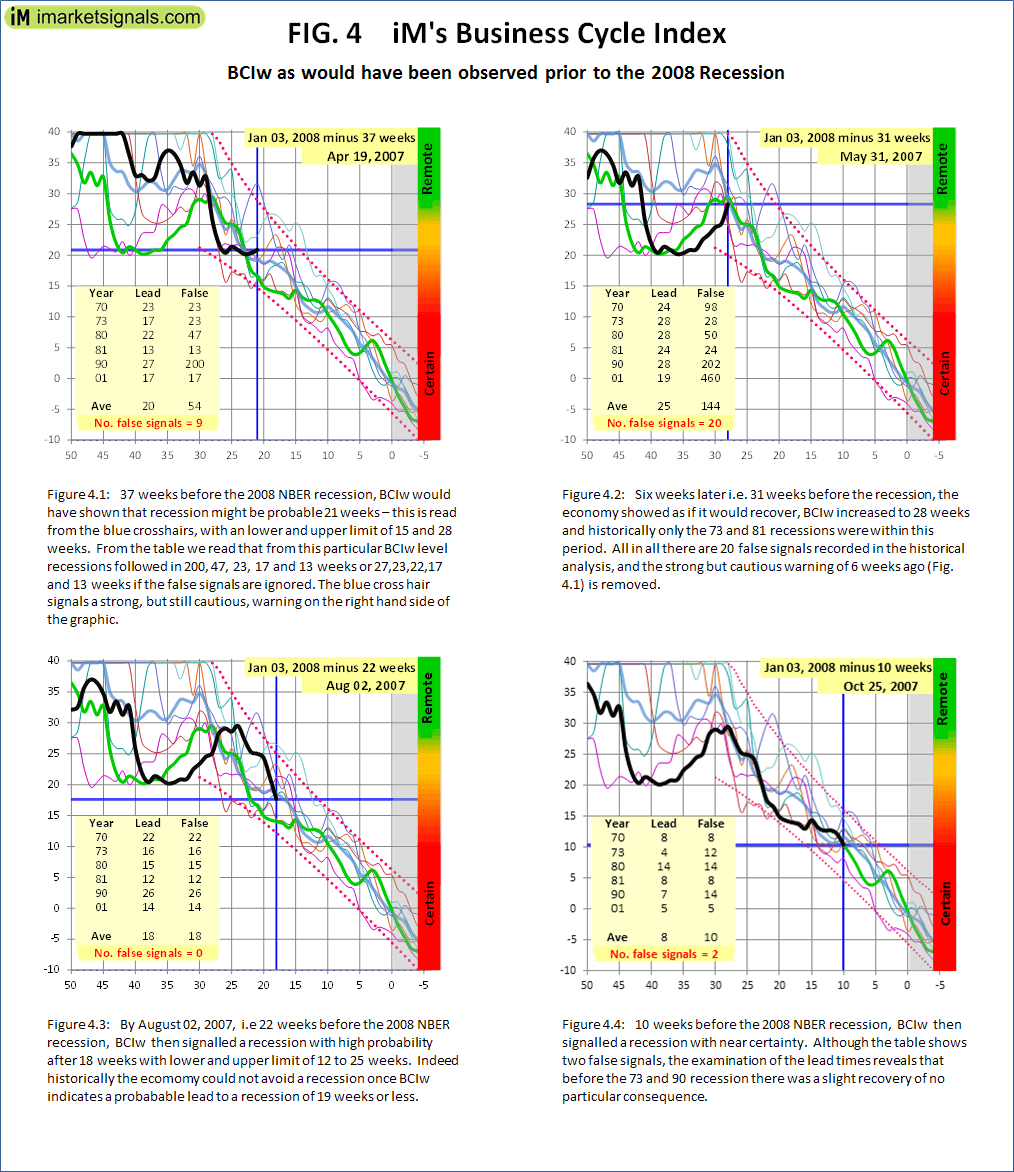
To see this indicator work, we have prepared a series of charts tracking the slide into the 2008 recession at various intervals before January 2008 and compiled into Figure 4. The bold black track indicates what would have been observed on the date shown at the top right corner of each chart. The bold green line is the actual track, determined later when the start date of the 2008 recession was known.
iM’s Business Cycle Index is updated every Thursday and the series, with weekly values starting January 1967, can be downloaded here.
This is all very interesting but complex.
Look forward to following you.
Do you still track and publish the BCIw?
BCIw kicks in when BCIp is below 70. See Figure 2.