Stock-market:
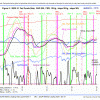 ECRI reported the WLI at a level of 126.4 and the six months smoothed annualized growth WLIg at +4.9%, as shown in Fig 2. Seven weeks ago the IBH model generated a sell-basic signal and 2 days later a sell A signal, indicating that the model had exited the S&P500. So far the S&P has gained since the sell signal.
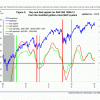 MAC Fig 3 shows the spreads of the moving averages. The sell spread (red graph) has clearly been forming a trough and a sell signal does not seem to be imminent. The model stays invested.
Bond-market:
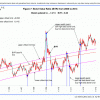 The Bond Value Ratio is shown in Fig 7. The BVR has declined over the week and long bonds with them. In the longer term BVR will reach the long-term trendline and long-bond investors will have suffered considerable losses by then. The model stays invested in low beta bonds
The Yield Curve:
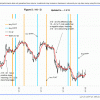 Figure 5 charts (i10 – i2). The trend seems to be up – the model expects the yield curve to steepen, bad news for long bond investors. FLAT and STPP are ETNs. STPP profits from a steepening yield curve and FLAT increases in value when the yield curve flattens.
Recession:
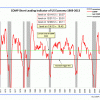 No recession occurred during 2012, despite ECRI claiming that we have had a recession since the middle of 2012. Attached is the updated COMP which declined a bit since last week and is currently forming a mini-peak. This indicator is far away from a recession signal.
Gold:
The Coppock indicator for gold may be in the process of forming a trough, which would be an indication of a prospective price rise for gold. See my article at dshort Is it Time to Buy Gold Again?
Also I found that gold is correlated to the Real Federal Funds Rate.Are Gold Prices Correlated to the Real Federal Funds Rate? If inflation picks up over the next few months (as many expect), and the FFR stays where it is now, one can expect the gold price to increase. In November 2011 the RFFR was about -3.5%. Inflation dropped during 2012 to about 2% – thus the RFFR is now about -2%, and the change of the RFFR is about +1.5%. For this value, in Table 4 of the article, one can see that one should expect a gold price decline. This has indeed been the case, with gold being about 10% lower now.
Lets watch the inflation rate and also the Coppock indicator and see what happens.

Leave a Reply
You must be logged in to post a comment.