
Using a third party small-cap model from the web-based trading simulation platform in combination with our iM-Best(SPY-SH), we demonstrate the benefits of combining this model with iM-Best(SPY-SH), these include a reduced volatility, constant positive rolling returns, and high annualized returns with low drawdowns. The model was chosen because its algorithm does not include market-timing, and also because it holds 50 stocks, has a low annual turnover, and should be able to support a relatively high total portfolio size of $3.5-million on its own.
It is interesting that this combination of a small/micro-cap and iM-Best(SPY-SH) model would have produced virtually the identical return as the large-cap Combo5, not only from inception, but also over different time periods as shown in the table below.
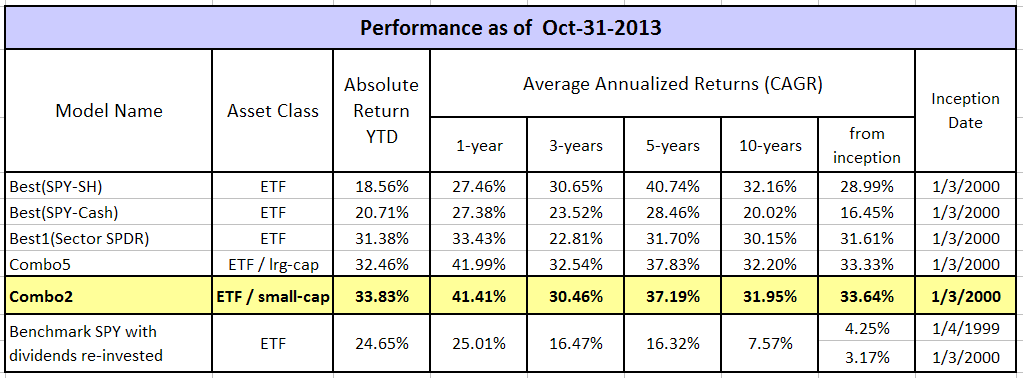
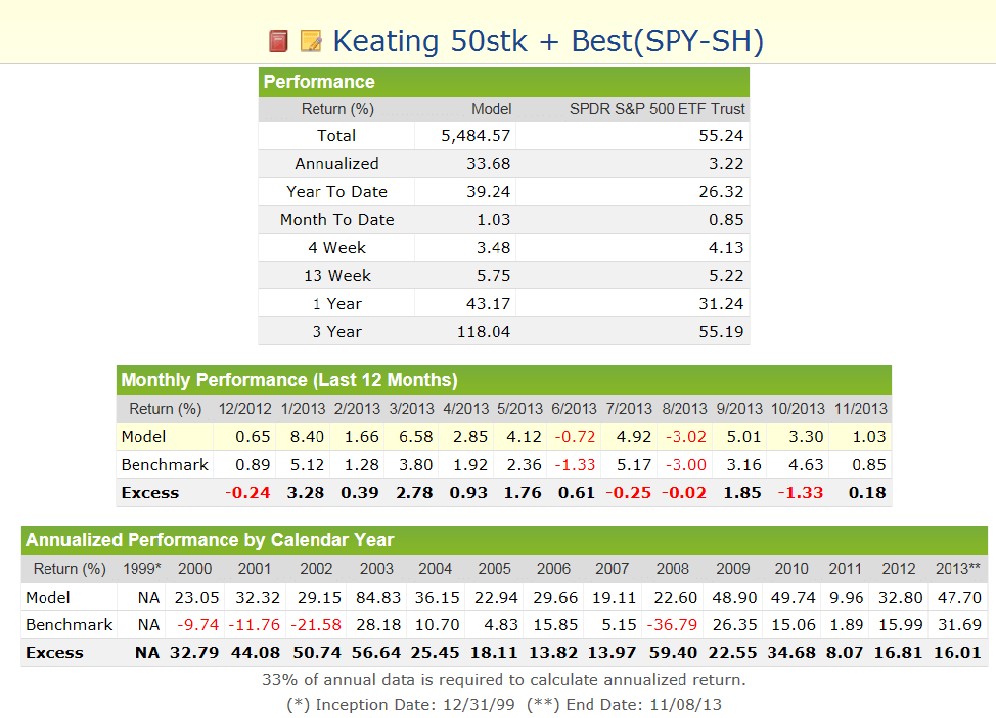
Combo Mode Performance
The component models and their percentage weights in the combination are listed below:
- 50% Best(SPY-SH): Switches between SPY and SH.
- 50% Keating’s 50 stk low turnover 50-350m: Holds small- and micro-cap stocks
This combination model is always trading long, and has a low average annual turnover of about 350%.
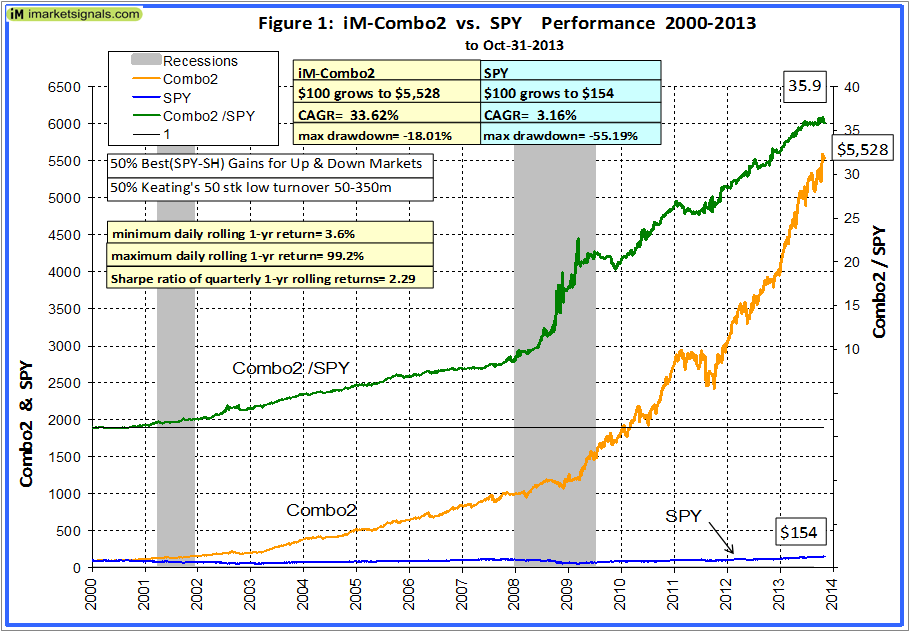
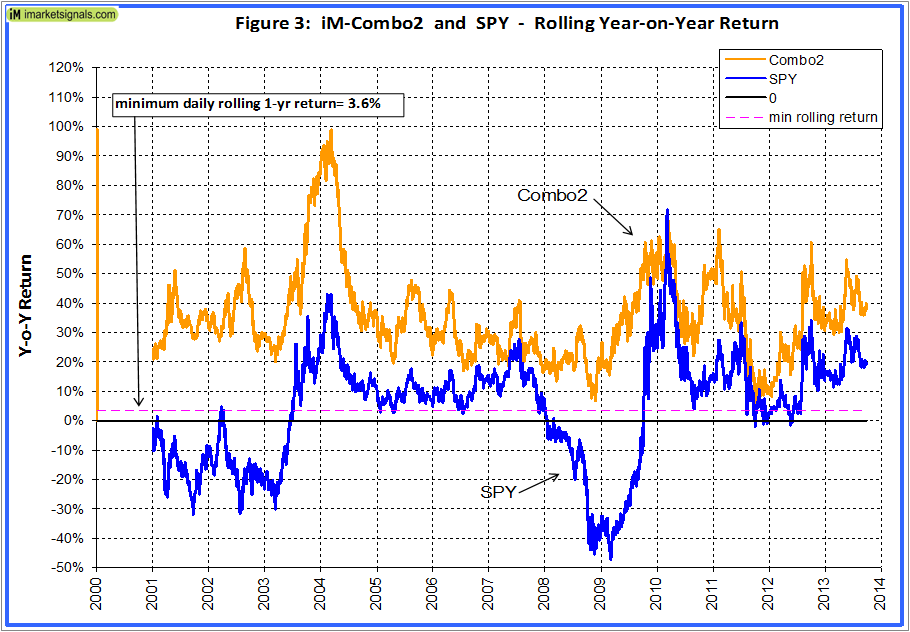
The combination, Combo2, would have produced, an annualized return of 33.6% with a maximum drawdown of only -18% as shown in Figure 1. The in-between-recession segments of the ratio graph Combo2 to SPY have a fairly constant upward slope, indicating that Combo2 out-performed SPY most of the time.
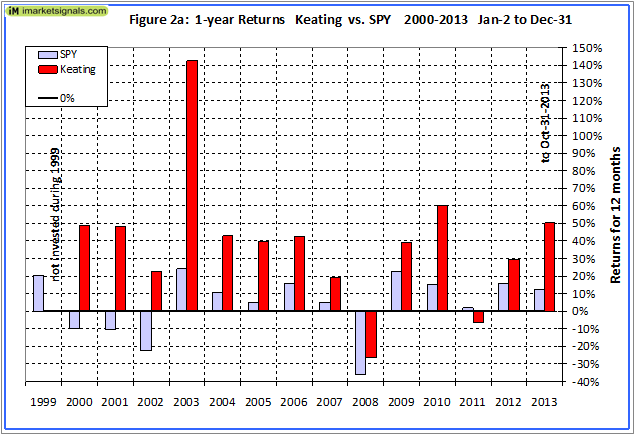
Had one left out the iM-Best(SPY-SH), then the annualized return for the Keating model alone would have been 35.3% with a maximum drawdown of -47.7%, as shown in Figure 1a. This is almost the same as Combo2’s return, but with a much worse drawdown. However, the ratio graph Keating to SPY shows the undesirable erratic performance of the Keating model relative to SPY without the stabilizing effect of iM-Best(SPY-SH).
 (click to enlarge)
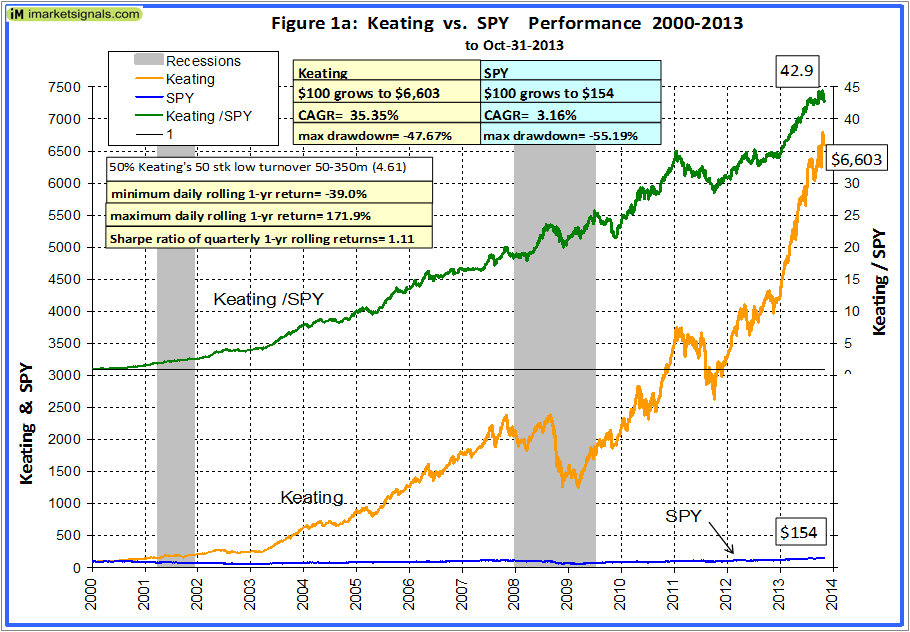
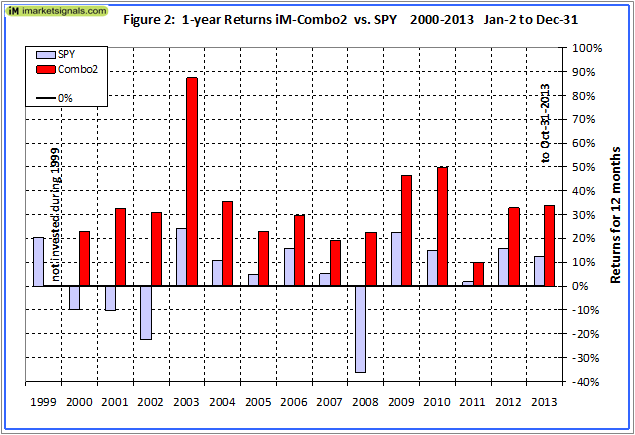
Annual Returns
Figure 2 shows the annual returns for Combo2. Note that all returns were positive, which is not the case when iM-Best(SPY-SH) is omitted, as can be seen in Figure 2.a.
Rolling Returns
Figure 3 shows the rolling 1-year returns for Combo2, starting each trading day from 2000 to 2012. The lowest return was +3.6%. The rolling returns were always greater than for SPY, except for one week in March 2010. For rolling 1-year returns starting every 3 months the Sharpe ratio was a reasonably high 2.3, indicating that the returns were of similar magnitude.
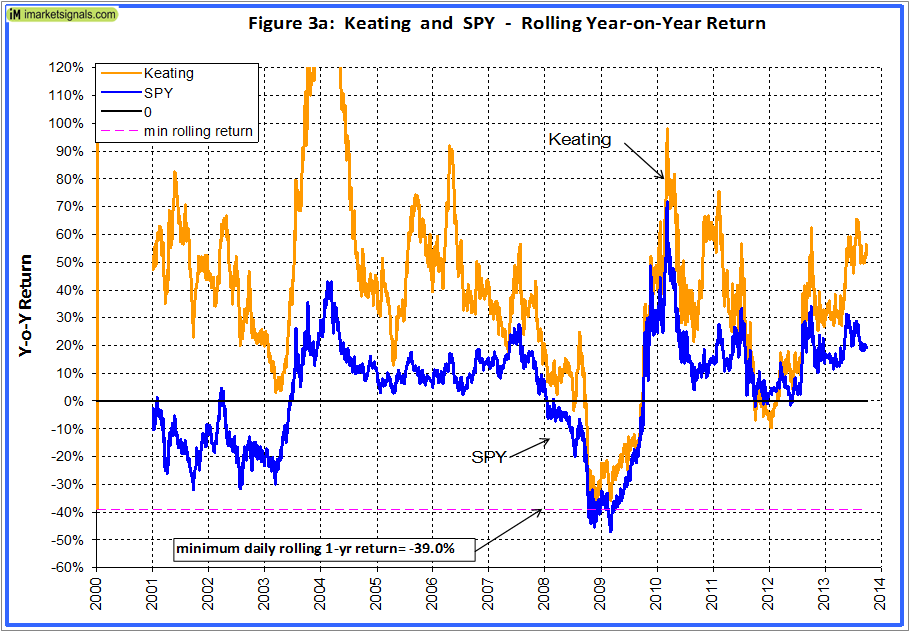
Without iM-Best(SPY-SH) and in the combination, then as shown in Figure 3a, the lowest rolling return would have been a very low -39.0%. One can see that the negative rolling returns lasted for more than a year from the middle of 2008 onward, and there was another period in 2011-12 when the minimum was about -10%, with the Keating model under-performing SPY.
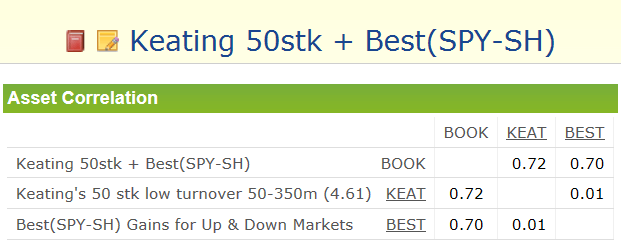
Correlation
The correlation between the two models was calculated to be zero. From a portfolio construction standpoint, the combination should be more robust than any single system on its own.
Risk Analysis
Note that the risk measurements for the combination are better than for any of the individual models, indicating that the combination should be more robust than any single system on its own. Particularly the reasonably low drawdown and higher Sharpe- and Sortino Ratios for the combination are noteworthy.
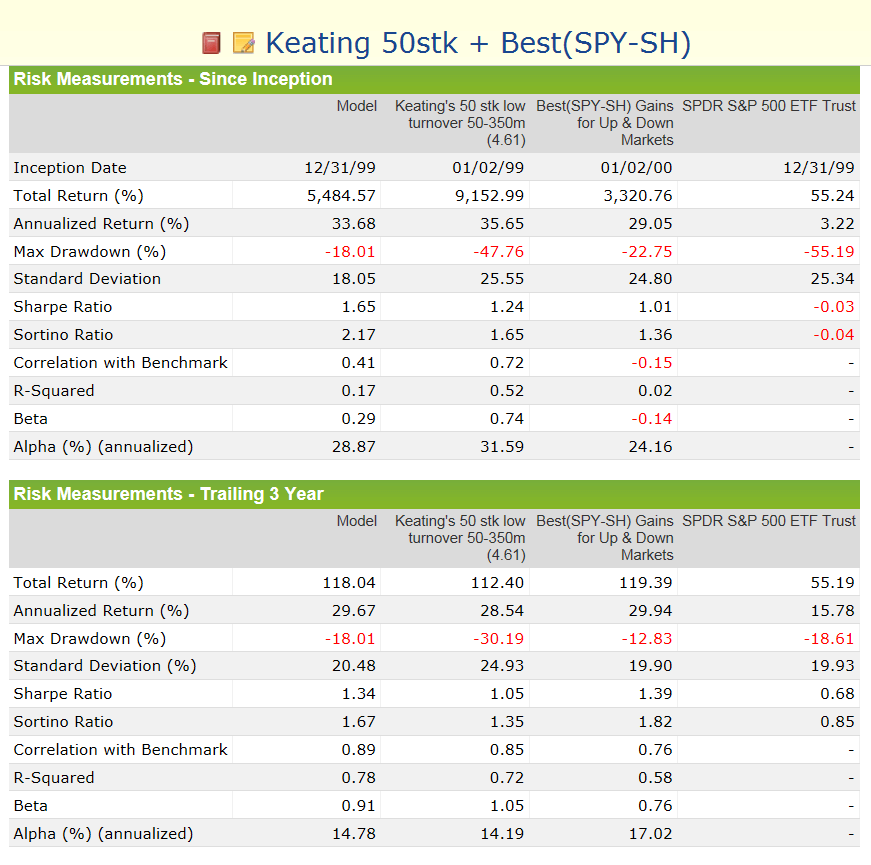
Performance Statistics from 1/2/2000 to 10/25/2013
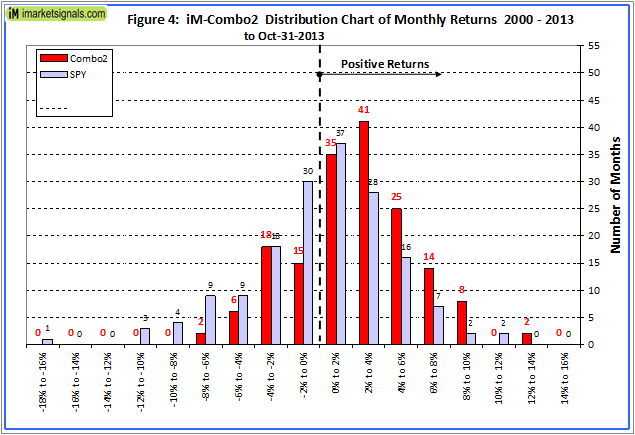
Distribution of Monthly Returns from 1/2/2000 to 10/31/2013
There were a total of 166 months in the period under consideration. Combo2 produced positive returns during 125 months and only 41 months of negative returns, as is evident from the chart above.
 (click to enlarge)
Portfolio Size
The maximum portfolio size is dependent on the liquidity of the stocks and ETFs in the model. The ETFs have huge liquidity and will not place a constraint on portfolio size. To calculate the maximum size a portfolio can handle without incurring too much slippage the following formula is recommended:
($LiquidityBottom20Pct * #Position * 5%) / WeeklyTurnover%
where 5% is the maximum amount traded without affecting the stock price.
The Keating model has the lowest liquidity of the bottom 20 Pct, and is thus the critical model in the combination. It represents 50% of the total portfolio.
$LiquidityBottom20Pct = $0.07MM
#Positions = 50
Annual Turnover% = 257%
WeeklyTurnover% = 4.9%
Max Port Size for Keating model= ($0.07MM * 50 * 5%) / 4.9% = $3.5MM
Maximum Portfolio Size Combo2= $3.5MM / 0.5= $7.0MM.
Thus, this combination model could accommodate 20 investors with a $350,000 portfolio each, and $175,000 allocated to each component model.
Thank you!
If I understand this correctly, Combo2 can be thought of as two portfolios, each with 50% of the assets. Portfolio1 is the Keating model, and Portfolio2 is Best(SPY-SH).
Q1: Is there rebalancing between the two components of the combo to keep a 50/50 ratio?
Q2: One option that I didn’t see mentioned would be to sell the Keating stocks and go to SH or cash when Best(SPY-SH) model goes to SH. Do you have any opinion or analysis on that idea?
Edited by site admin correcting model names
Your understanding is correct.
Q1: The combination is rebalanced when the value of the two components differ by more than 2%.
Q2: We have not analyzed this alternative. The idea was to show that one could take a model without market timing and combine it with Best(SPY-SH) to reduce drawdowns and provide reasonably stable rolling 1-yr returns without giving up much of the annualized return.
Geovrba, please explain how the Max Drawdown of the iM-Combo2 (-18.01%) can be less than the Max Drawdown of both of the two other models since they are both greater (-22.75 and -45.76)then the iM-Comb2 model.
Thank you
Bud, that is what happens when the models are not correlated to each other. It only makes sense to combine models which do not have the same performance characteristics. So when you combine them their low and high points do not coincide, and together they provide a higher risk adjusted return.