
The iM-Best1(Sector SPDR) model periodically selects only one of the nine Select Sector SPDR® ETFs that divide the S&P500 into 9 sectors. During adverse market conditions it switches to SH, the ProShares Short S&P500 ETF, or partly to cash. Using a web-based trading simulation platform, our ranking system, and specific buy and sell rules, this model would have produced an average annualized return of about 31.4% from January 2000 to end of September 2013, versus 2.9% for a buy-and-hold investment of SPY over the same period. Had one not invested in SH but switched only to cash, then the average annualized return would have been about 20.7%.
This model, when combined with our Best(SPY-SH) system, would have reduced investment risk with negligible reduction of return. The effect of the combination are described in Appendix C.
Ranking System
The ranking system presumes a rotational nature to equity markets to find the Select Sector SPDR ETF most likely to gain in the future. The ETFs are ranked weekly taking into account the performance over short and longer periods as well as the Sharpe ratio during up-markets, and during down-markets it uses the standard deviation of weekly returns.
The effectiveness of the ranking system was tested by manually screening each of the individual investment periods (Table 3) to determine the returns for the highest to lowest ranked ETF. The results, listed below, are the sum of the percentage returns for all trades. It shows that the highest ranked ETFs did in fact produce the highest cumulative return.
| Sum of percent. returns for all trades, including SH, from 1/3/2000 – 9/30/2013 | ||||||||
| return rank 1 | return rank 2 | return rank 3 | return rank 4 | return rank 5 | return rank 6 | return rank 7 | return rank 8 | return rank 9 |
| 460.58 | 349.66 | 293.5 | 329.29 | 291.21 | 331.01 | 341.3 | 301.13 | 262.98 |
Terminal values are shown below. This hi-lights the effectiveness of the ranking system even better. Selecting the highest ranked ETF each time produced more than twice the terminal value than for the second highest ranked ETF.
| Terminal value of $1.00 when invested from 1/3/2000 to 9/30/2013 | ||||||||
| return rank 1 | return rank 2 | return rank 3 | return rank 4 | return rank 5 | return rank 6 | return rank 7 | return rank 8 | return rank 9 |
| $44.07 | $20.72 | $14.00 | $18.53 | $13.79 | $18.04 | $17.50 | $15.19 | $9.32 |
Trading Rules
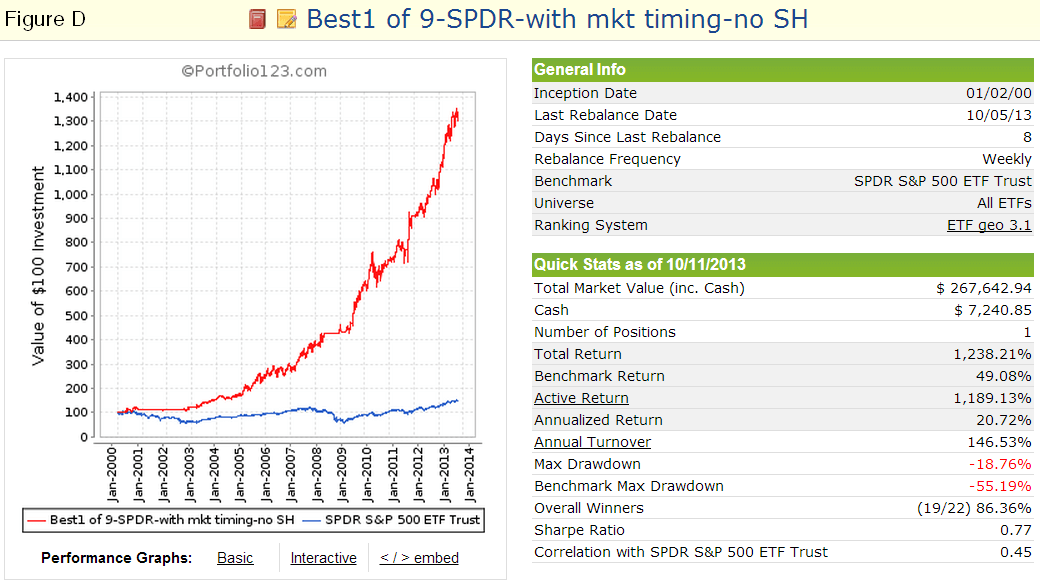
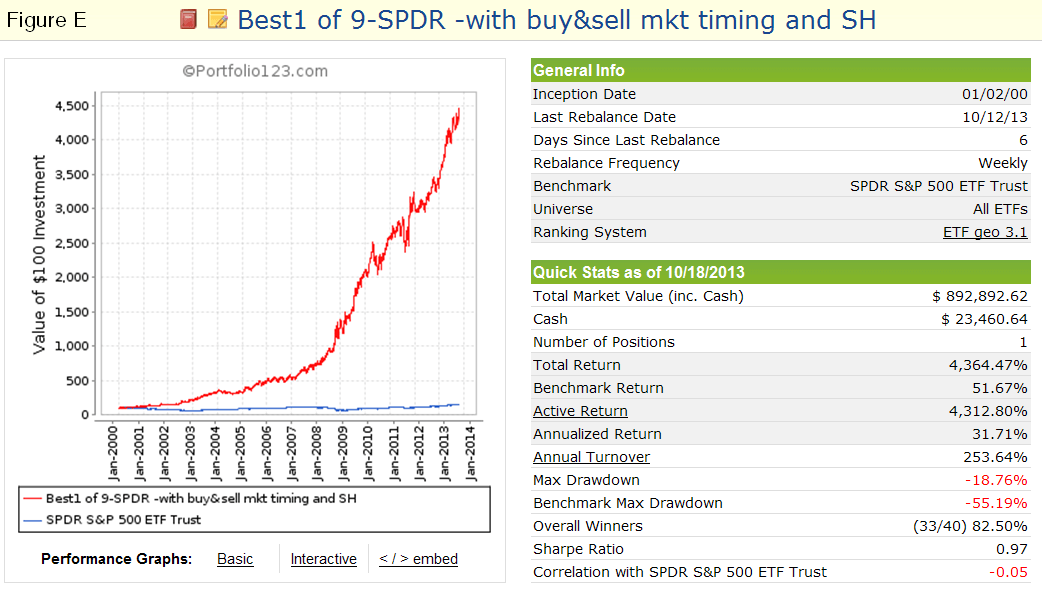
The trading rules are based on volatility, risk premium, earnings estimates together with moving average cross-overs to determine the optimum time periods to be long. From 2000-2013 there were 10 periods when the model would have gone to cash, but to increase performance the model switches to SH during most of those periods, or portions of them. A Sector SPDR-Cash strategy would have resulted in a CAGR of 20.7% (Fig. D in Appendix B), whereas the Sector SPDR-SH strategy would have increased this return to 31.4%.
Appendix B details a step by step comparison and development of ranking system and trading rules.
The model assumes the ETFs to be bought and sold at the next day’s (Monday) closing price after a signal is generated. Slippage of 0.1% of the transaction amount accounting for brokerage fees and transaction slippage were taken into account. This may be on the high side since all of these ETFs are highly liquid and have huge trading volumes.
The model was backtested from Jan-2-2000 onwards, as this was the first full year when the algorithm had access to all the required indicators.
The ETFs
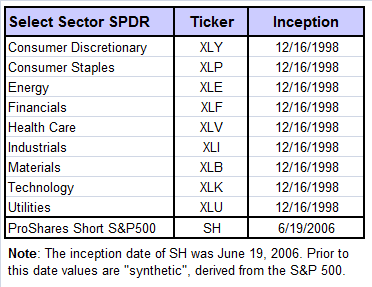
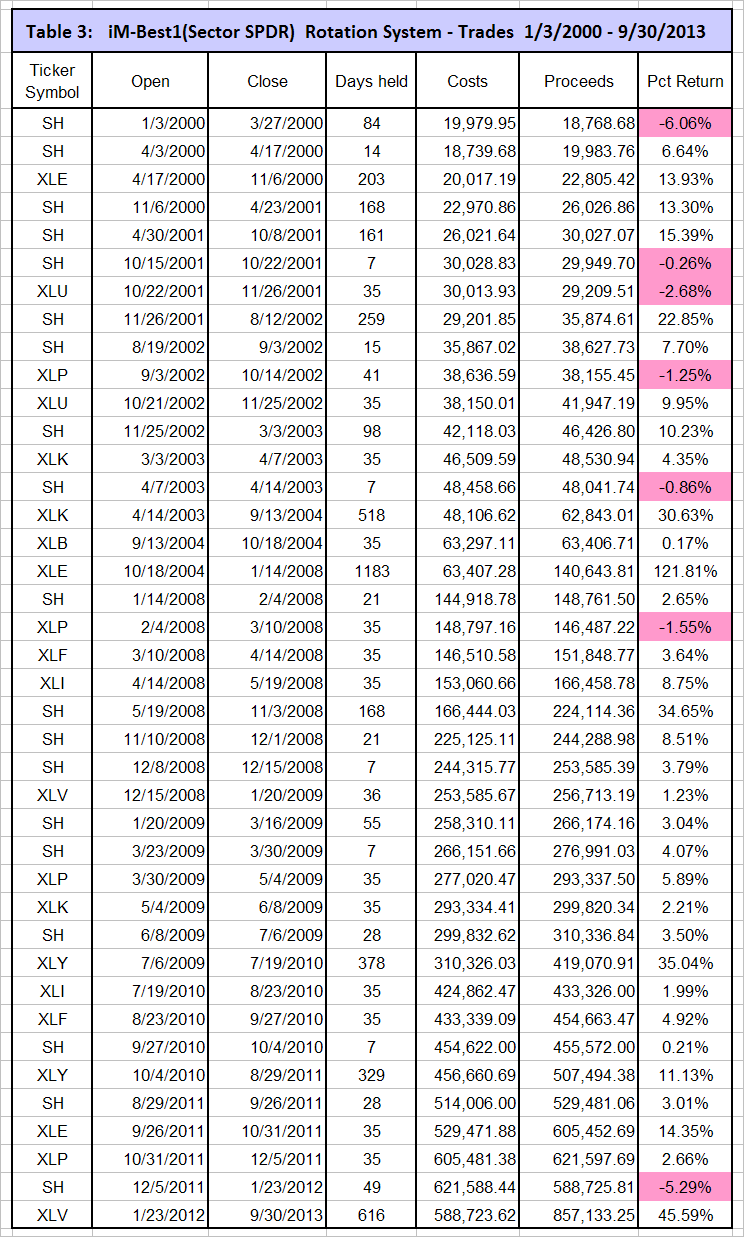
The model selected every one of the 9 sector ETFs at least once, as can be seen from Table 3 in Appendix A where the trades are listed. The proceeds that are shown in the table are only from those trades and do not include dividends, but do provide for transaction costs.
Performance
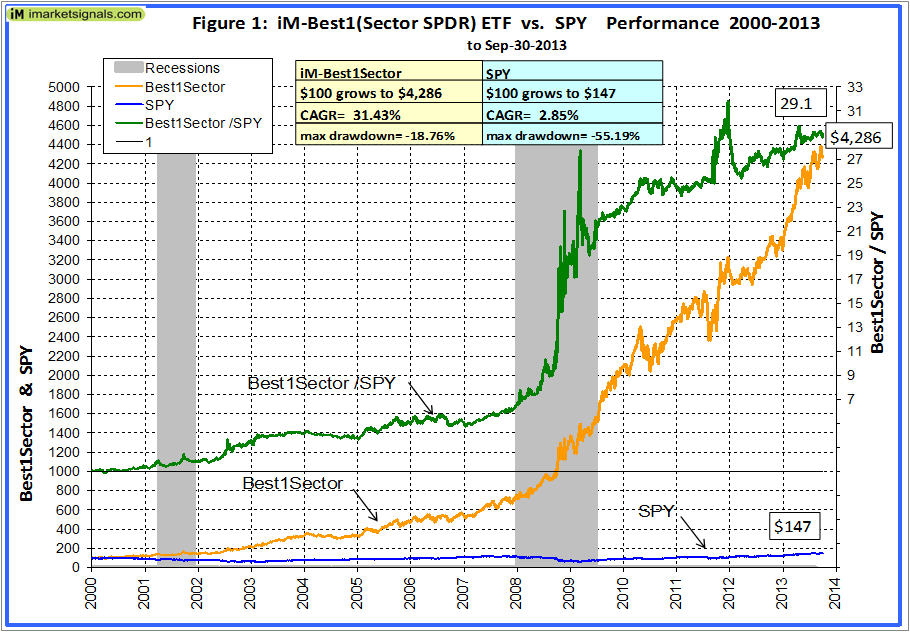
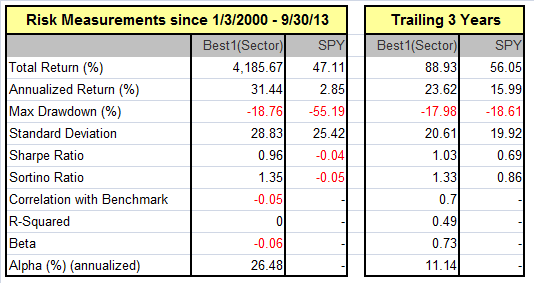
The simulated trading performance of the complete system from January 2000 to end of September 2013 is shown in Figure 1. The annualized return over this period would have been 31.4%, and $100 would have grown to about $4,300. The maximum drawdown was -18.8% in July 2010. All values are with dividends reinvested.
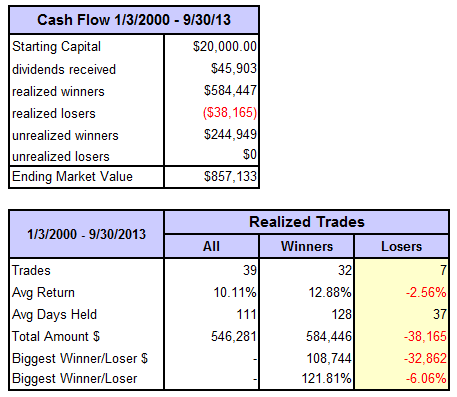
The model assumes an initial investment of $20,000 on Jan-2-2000. To Sep-30-2013 there were only 39 completed trades, 32 of these were winners and 7 losers, as summarized in the tables below, and listed in Table 3 in Appendix A. The winners provided $584,446, whereas the losers reduced market value by only $38,165, a reduction being only 6.5% of the realized winners’ amount. There is an unrealized gain of $244,949 from the last position bought in January 2012. The market value shown is after transaction fees of $16,834.
 (click to enlarge)
Figure 1 shows the performance of the system. In the chart, the upper green graph is the ratio of the iM-Best1(Sector SPDR) to SPY, the general rising trend of that graph indicates that this model continuously outperformed SPY; it produced 29-times the value which one would have had from a buy-and-hold investment in SPY over the same period. Even during the bull market periods from 2003-08 and 2009-13 did this model out-perform SPY.
Annual Returns
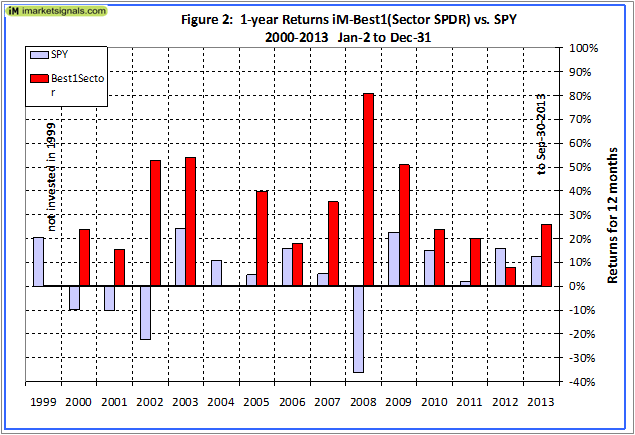
Figure 2 shows the annual performance from January to December ranged from a maximum of 81% for 2008 to a minimum of 0% for 2004.
 (click to enlarge)
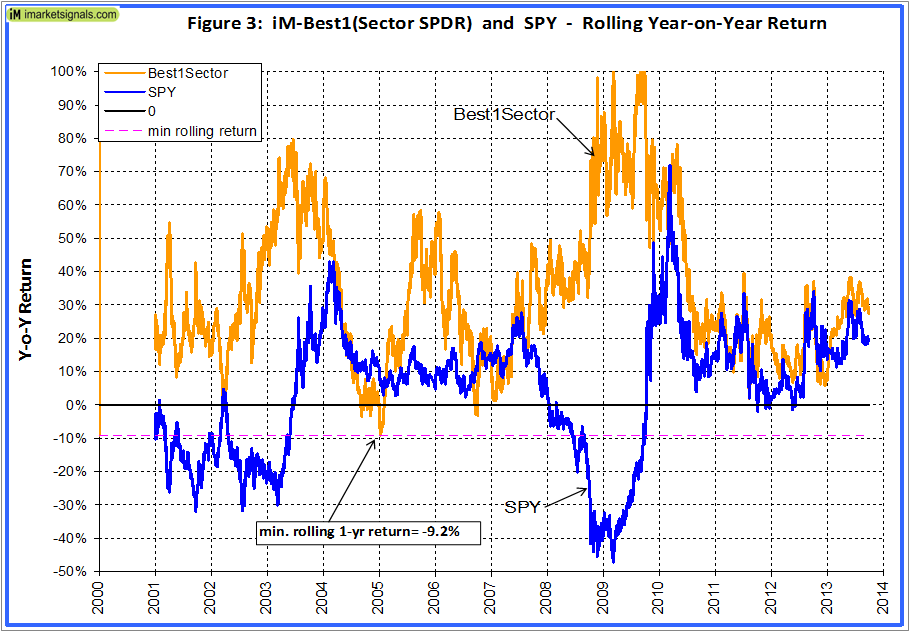
Figure 3 shows the rolling 1-year returns starting each trading day from 2000 to 2012. There was never a significant loss over any 1-year period. The minimum return over 12 months would have been -9% and the maximum 105%.
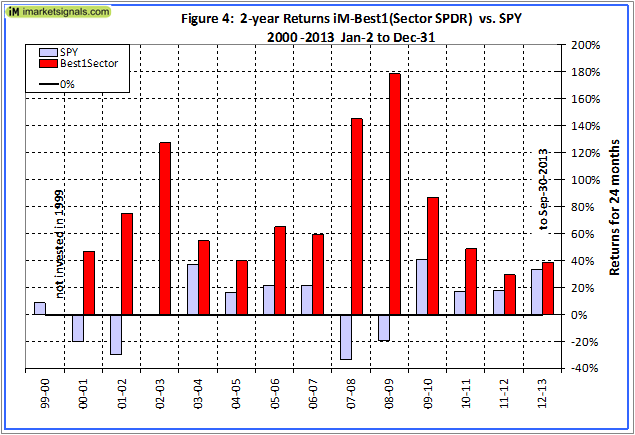
Figure 4 shows the 2-year returns. The minimum return over 24 months would have been 40% and the maximum 179% for 2008-09.
Terminal Values
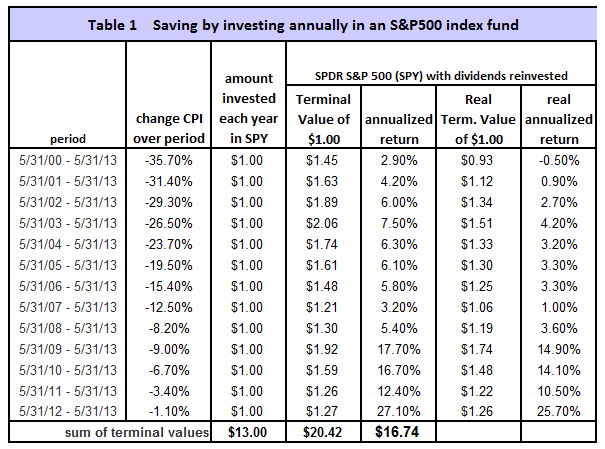
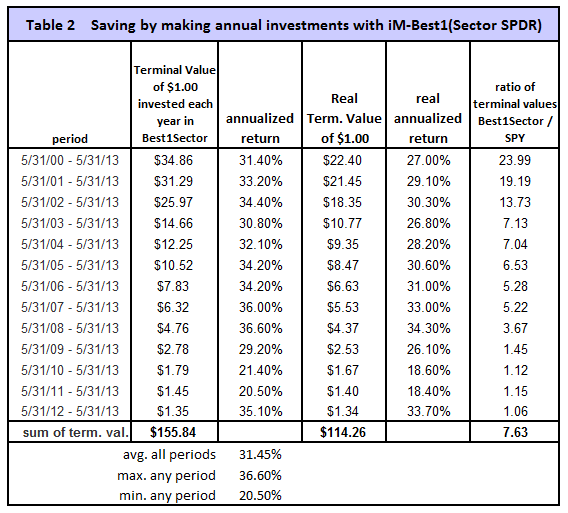
To simulate savings over time, terminal values were calculated to the end of May 2013 for annual hypothetical investments of $1. Starting with a dollar during each of the 13 years from 2000 to 2012, one would have invested a total of $13 cumulatively by the end. Summing the 13 terminal values, this strategy would have netted this dollar-per-year investor $156 at the end of 13 years.
Following a buy-and-hold strategy in SPY, one would have only $20.42, about 13% of what iM-Best1(Sector SPDR) would have provided. Furthermore, the lowest annualized return for any of the 13 time periods was 20.5% and the average for all the periods was 31.5%. This is shown in Tables 1 and 2 in Appendix A.
Appendix A – Statistics
Appendix B – Performance under varying conditions and rules
Figures A to E demonstrate the system’s performance under various scenarios, showing the effect of market timing and the inclusion/exclusion of SH. The simulation period is from 1/2/2000 to 10/5/2013.
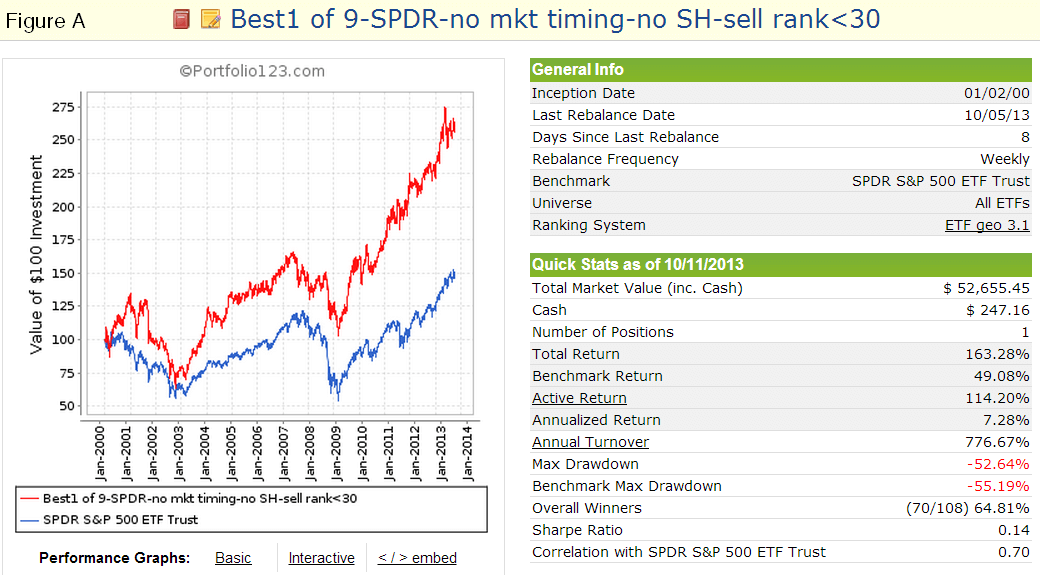
The effectiveness of the ranking system is evident from Figure A. This shows that the return becomes almost 3-times that of a buy-and-hold investment of SPY when utilizing only the ranking system to periodically select the highest ranked sector ETFs.
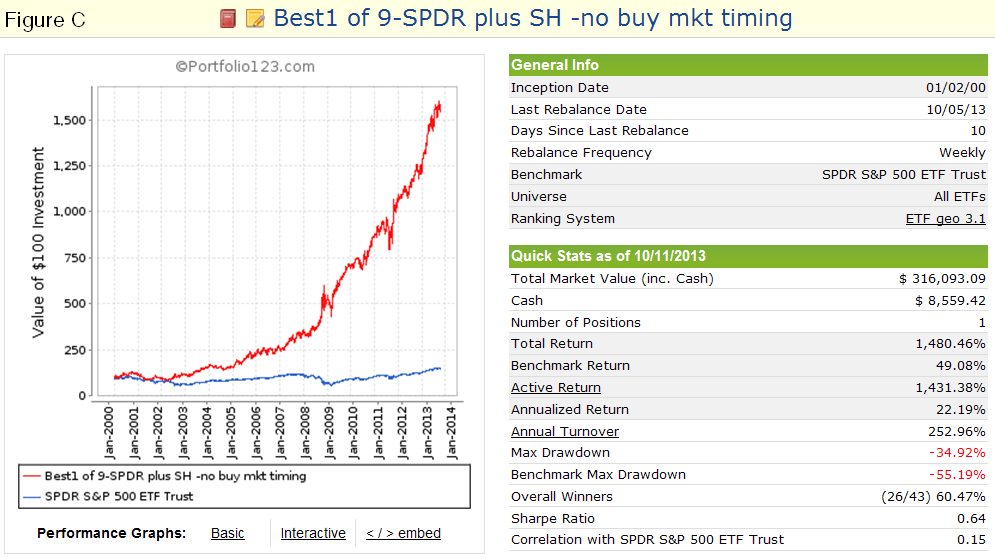
Also Figure C shows the effect when SH is included and the ranking system is able to select it according to the ranking rules, which should favor SH during down-market periods. There are no buy timing rules for this scenario, and thus the selection is rank based only. This would have produced a high annualized return of 22.2
 (click to enlarge) (click to enlarge)
Figure A Performance with ranking system only – SH excluded.<
|
 (click to enlarge) (click to enlarge)
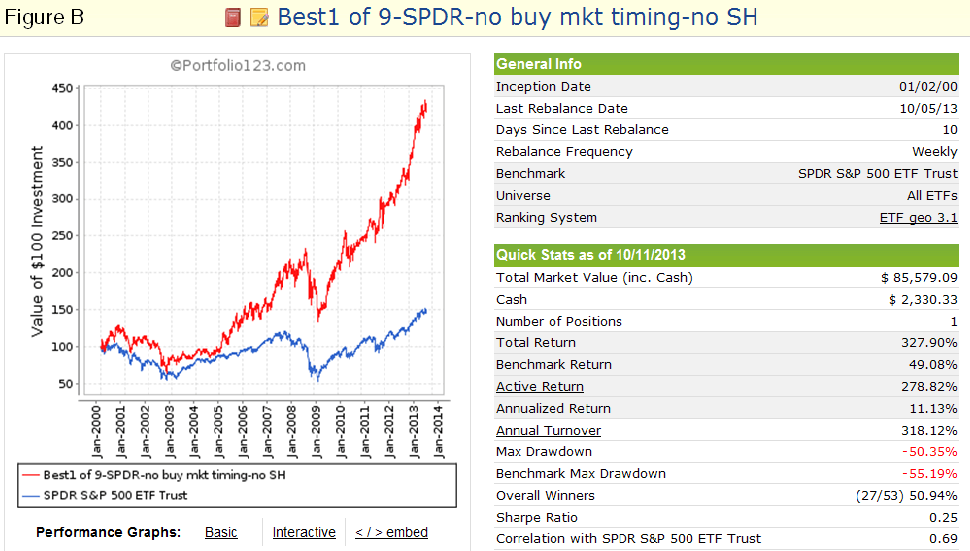
Figure B Performance when only sell rules use market timing – SH excluded.
|
 (click to enlarge) (click to enlarge)
Figure C Performance when only sell rules use market timing – SH included.
|
 (click to enlarge) (click to enlarge)
Figure D Performance when buy and sell rules use market timing – SH excluded.
|
 (click to enlarge) (click to enlarge)
Figure E Performance when buy and sell rules use market timing – SH included. The pool are the 9 sector ETFs and SH.
|
Appendix C – Combining with Best(SP-SH)
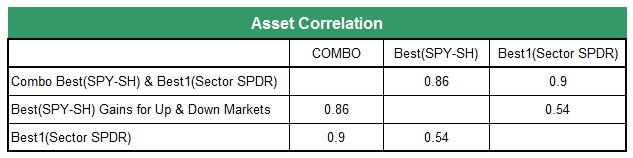
The correlation between Best1(Sector SPDR) and Best(SPY-SH) is a relatively low 0.53 as shown in the table below, signifying that the combination should have improved risk measures, which is indeed the case.
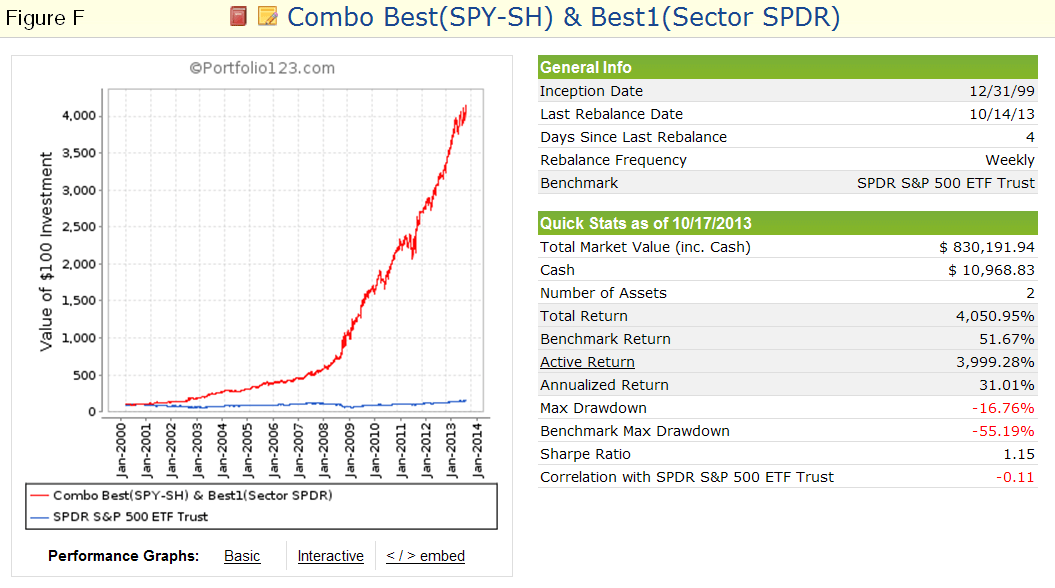 (click to enlarge) (click to enlarge)
Figure F Best1(Sector SPDR) in combination with Best(SPY-SH) equal weight.
|
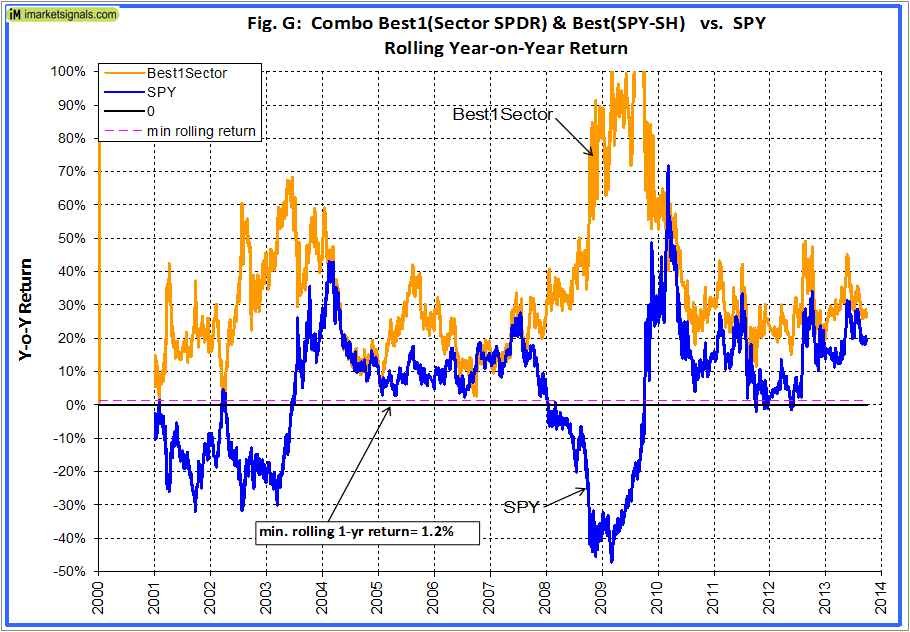 (click to enlarge) (click to enlarge)
Figure G Best1(Sector SPDR) in combination with Best(SPY-SH) equal weight.
|
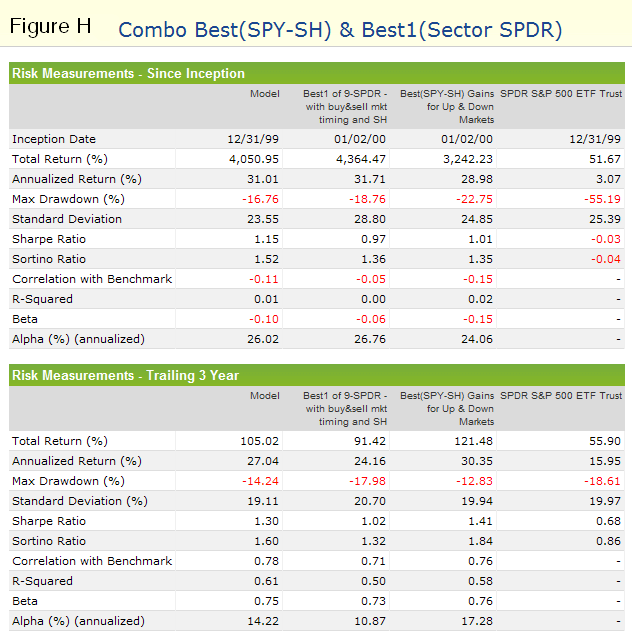
Figure H Best1(Sector SPDR) in combination with Best(SPY-SH) equal weight.
|
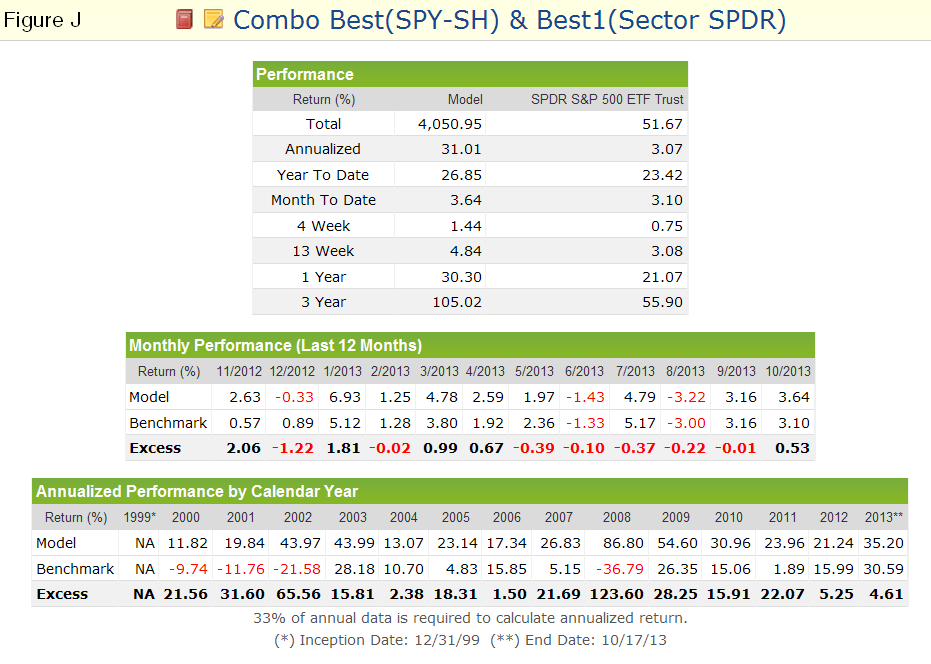 (click to enlarge) (click to enlarge)
Figure J Best1(Sector SPDR) in combination with Best(SPY-SH) equal weight. |
iM-Best Systems
Quick Comparison
Quick Links to Model Descriptions
R2G & iM(Silver) iM-Best10(S&P 1500): A Portfolio Management System for High Returns from the S&P 1500
R2G iM-Best9(Russell 1000) – Large-Cap Portfolio Management System
R2G iM-Best8+ Portfolio Management System
iM(Gold) iM’s Best12(USMV)-Trader Minimum Volatility Stocks
iM(Gold) iM’s Best12(USMV)Q1..4-Investor Minimum Volatility Stocks (The Q3 model available to Silver)
iM(Silver) iM-Best10(VDIGX) Trading the Dividend Growth Stocks VDIGX
R2G & iM(Silver) iM-Best(SPY-SH) Market Timing System: Gains for Up and Down Markets
R2G & iM(Gold) iM-Best1(Sector SPDR) Rotation System
R2G & iM(Gold) iM-Best(SSO-TLT) Switching System
iM(Gold) iM-Best Combo3: Best(SPY-SH) + Best1(Sector SPDR) + Best(SSO-TLT)
iM-Best(SPY-Cash) Market Timing System
iM-Best(SSO-SDS): Beating the Market with Leveraged ETFs
Survivorship Bias: neither Myth nor Fact
Quick Links to Ready-2-Go Models
Best(SPY-SH) Gains for Up & Down Markets
When subscribing to P123 please use this link or enter token IMARKETSIGNALS when registering to obtain 30 days free membership.
Disclaimer: The opinions in this document are for informational and educational purposes only and are obtained from a mathematical algorithm and should not be construed as a recommendation to buy or sell the stocks mentioned. Past performance of the companies may not continue and the companies’ stock values may decline. The information in this document is believed to be accurate and represents the output of a mathematical algorithm, and under no circumstances should a person act upon the information contained within. We do not recommend that anyone act upon any investment information without first consulting an investment advisor as to the suitability of such investments for his specific situation. Also see our Terms of Use/Disclaimer.
Georg – will this be a P123 subscription only system or will you update it here each Friday like the SPY/SH system? Thanks
gab
Gab, we have not decided yet whether we will also provide the signal at iM. We will first want to see how much interest there is for the R2G model.
Georg,
Does R2G allow for automatic trading of your signals for this model with an affiliated trading house? I live is Perth Australia – exactly 12 hours ahead (or behind…) which makes trading the signals very difficult.
Great work, thanks.
Mark
Mark, this model selects one of the SPDR Sector ETFs or SH. The signals are infrequent and trading a few hours late will not make a difference. P123 is not set up for automatic trading, but they are talking about it.
Another great system! I have a suggested tweak. It appears that when the model picks an ETF it holds that ETF until the signal changes, whether that is 7 days or 365days. I would suggest re-ranking your sectors periodically, say every 4-weeks. Then you could transfer your ETF to a higher ranking ETF. Another option would be to create a ranking system similar to your ranking system on the SP500 equities such that when you fall below some set score you would then re-rank. I’d be interested to see whether this would improve your returns.
Thanks for sharing your signals.
Nick
Nick, thanks for the suggestions. I will investigate the effect of trading more frequently.
Where can I see the current holdings and trades? I only see as of XLV as of Jan 2012. Were there no trades since then?
What are your thoughts of replacing the SPDR ETFs with Vanguard ETFs? The reason I ask is that Vanguard tends to have lower cost ETFs that I assume perform equivalently to SPRD, but could be wrong.
thanks, Jim.
Thank you for answering my question regarding current holdings on P123. I see in the text above there have been no transactions since Jan 2012.
Any thoughts on using Vanguard ETFs or another brand in lieu of SPDR ETFs?
Jim, you can use the Vanguard sector ETFs. I used the SPDR ETFs because they have an earlier inception date.
hello Georg:
can you advise on subscription rates please, or is this service still free while site is under construction? Or, direct me to where I can find it; probably here somewhere, I don’t know where to look.
thanks
Currently we are not updating this model at iM, although we may do so later. One can subscribe to this model at P123 by following the link at the top of this comment section. Use the indicated link for a 4 week free trial period at P123. The model should be open for subscription on Nov-3 at $45 p.m.
Georg,
Thank you for the models. In table 3 above, I am confused about how the cost for a new trade can be greater than the subsequent proceeds. Could you please help me understand that better?
eg. 12/01/08 (244,288) exit to 12/08/08 (244,315) entry.
The model also holds some cash, not only the ETFs. See Figs. A-E.
With a spectacular run of almost clairvoyant insight on IM single sector returns, it would lead credence that this model is CURVED fitted somehow.
The criteria, volatility, risk premium, earnings update and MA crossover are very respectable in a ranking platform. But out of sample data test would put the proof in the pudding to give the model legitimacy. 31% annual return is suspect without just historical data and real time support.
PS Still not sure how IM worked the proxy for SH prior to 2006 as it did not exist.
Thanks for your efforts,
Look forward to the out of sample data..
The Best1(Sector SPDR) was launched on 10/19/2013, so the out of sample period is only about 14 months. Since launch the model gained about 35% while SPY gained about 21%. Only time will tell whether the model will match the backtest returns. Out-of-sample returns are usually less than those shown by the backtest. We make no claim as to future performance.
SH has synthetic values prior to June 2006 calculated from the S&P500 by P123. We checked some of their calculated values and can confirm that they are correct.
“The Best1(Sector SPDR) was launched on 10/19/2013, so the out of sample period is only about 14 months.”
Yes very limited out of sample period especially when XLV (health sector has been on a multi year rout since 2012!
Would it be possible to perform several ‘out of sample’ scenarios to lead credence to the model during this entire period from Jan. 2000 to 2014? I believe iM has done this with its other models?
“Out-of-sample returns are usually less than those shown by the back test. We make no claim as to future performance.”
I agree many models published for hire usually fail significantly when they meet real time data.
As a hedge alternative it would be interesting to see how a BEST SHORT (Inverse) SPDR rotation system would perform (Best short or Cash). Have you explored a similar system? I would expect the performance to be lower than SPY over the long term but there are times when it’s nice to know the weakest sector.
We have not done a simulation to periodically determine the worst sectors, but it is an interesting idea and worth pursuing.
I know this model wasn’t historically backtested using equivalent leveraged sector ETFs, but I’m getting really great returns doing so.
Georg,
Have you looked at splitting the investment between the 2 top rated ETF’s and if so what were the results? I’m curious if the reduction in return is offset by a reduction in volatility and draw down.
Thanks
Yes, we have a model for this, but return is significantly lower. Annualized return from Jan-2000 to mid Nov-2015 is 20.8% with max D/D= -21,7%. Annual Turnover= 190%. Current holdings XLB and XLP. Because we now have a 2 position model, the model can only go to 50% SH.
Does the Best1 Sector strategy use the MAC-US model in determining a long signal/position? If so, when the MAC-US model generates a buy signal but the sell spread is still negative what are your thoughts on the long signal?
What is the minimum holding time for the long positions?
The Sector model does not use MAC-US signals. The minimum holding time for the long sector ETFs is 35 days. For SH (which is also a long position) the minimum holding time is 7 days.
Thank you for your prompt reply.
In the earlier years of the Best1 Sector strategy there were times the model held cash for a week before re-entry into another ticker. Can you elaborate as to why and why it did that in the earlier yrs as opposed to the later yrs? http://screencast.com/t/208xO6QrO It seems like SH can be a tricky ticker to make money with unless you catch it just right. What would the returns look like for shorting SPY (with a 4% margin carry cost) instead of going long SH?
Since the initial posting of the Best1 Sector results have there been any changes to those numbers with the changes P123 has made in the background?
Model goes to cash instead of SH when the rank of SH is not high enough.
P123 does not allow hedging ETF models so one can’t go short SPY instead of long SH.
There have been recent minor changes to the algorithm. Please see revision description in:
https://www.portfolio123.com/app/r2g/summary?id=1115335
Do you have any stop loss on these sectors? Currently XLB is looking to be your largest drawdown based on back test??
There is no stop-loss rule for the sector ETFs. For SH there is a sell rule when percentage from highest close since position started is equal or less than -10%.
Hi George, your backtest seems to have best delta-based returns with Rank 1 & Rank 9 etf’s, have you considered substituting SH with selling Rank 9 etf instead? Or, a backtest of substituting SH with selling each of the Rank etf’s – it’s possible the rsi on Rank 9 might be too low to produce alpha during downturns?
Thank you for the suggestion. Unfortunately, P123 syntax does not allow one to program this.
George, If minimum hold is 35 days( 1/4) why was XLB held until 1/19 when clearly there were stronger choices?
Hi Georg,
It has been surprising to see that the Sector SPDR Rotation System has been short the market through SH for several months now. Is the way to interpret this is that SH is currently being ranked higher than all the 9 Sector SPDR ETFs of the S&P 500? Has there not been even one week in the last several month, in which one of the 9 Sector ETFs was ranked higher than SH? If a higher ranked ETF did not make the cut, was it due to some timing issue in the model that one has to hold SH (once bought) for say 6 months or something like that?
Or has it been simply sell in May and go away? :-) Even under those circumstances, one would think the model could go to Cash and not short the market through SH, right?
Any clarification would be appreciated.
Regards,
RV
SH is not selected by the ranking system. The model goes to SH when there is a sell signal for all the sector ETFs.
Once the model is in SH it will only sell SH when a short Moving Average of SP500 Current Year EPS Estimate becomes greater than a long Moving Average of SP500 Current Year EPS Estimate, or when the percentage change from highest close since SH position was started becomes less than -10%.
None of those conditions have been met, so the model stays in SH. So far SH has lost value since it was bought, but only time will tell whether it was a poor signal or not.
I was not saying it’s a poor signal. I wanted to understand the system. Thanks for explaining the EPS moving average crossover. I now get it.
By the way, did you mean (in your comment above) that if SH loses 10%, then a stop loss would be triggered to exit and go to cash in case the moving average crossover on EPS has not yet occurred?
Thanks Georg.
Yes, if SH loses 10%, then a stop loss would be triggered to exit and go to cash in case the moving average crossover on EPS has not yet occurred.
Would you be able to post a performance comparison of this model (the current R1 revision) if one were to hold either Sector-SH, Sector-cash or Sector-IEF?
I believe the cash or bond variation would have improved performance over the last 1-year period, but I’m wondering how much it lowers historical performance over the long term?
Thank you.
Can you post performance numbers per year since 2000?
Thanks for all your work
Best1(Sector SPDR).R1
2000 … 0.11%
2001 … 14.74%
2002 … 44.05%
2003 … 5.06%
2004 … 15.53%
2005 … 39.89%
2006 … 17.98%
2007 … 35.39%
2008 … 26.45%
2009 … 47.92%
2010 … 11.20%
2011 … 27.30%
2012 … 7.91%
2013 … 41.08%
2014 … 24.28%
2015 … 7.40%
2016 … 5.03%
2017 … 34.09%
Looks like the Sector-SH model switched out of XLU this week. What is the reason that the model switched to cash instead of SH? Is this because SH pulled back recently? If so, what would be the condition that would cause a switch from cash to SH?
Thanks,
Tom C