
This Combo was presented as an example to demonstrate the risk reduction when combining simulation models with Best(SPY-SH). It was not an invitation to subscribe to the stock models at P123. The Combo is not available for subscription at iM, but could be simulated in a “book” at P123. This would require a membership at P123 and subscriptions to the relevant R2G models as well.
BTW, a cursory look at the TWY5 model reveals a somewhat disappointing out-of-sample performance (August 2014)
Best(SPY-SH) switches between SPY and SH depending on market direction, and is beneficial in combination models. Using a high performance model TWY5 from the web-based trading simulation platform and our Best8+ model, we demonstrate the benefit of combining these models with Best(SPY-SH) for reduced volatility, constant positive rolling returns, and high annualized returns with low drawdowns.
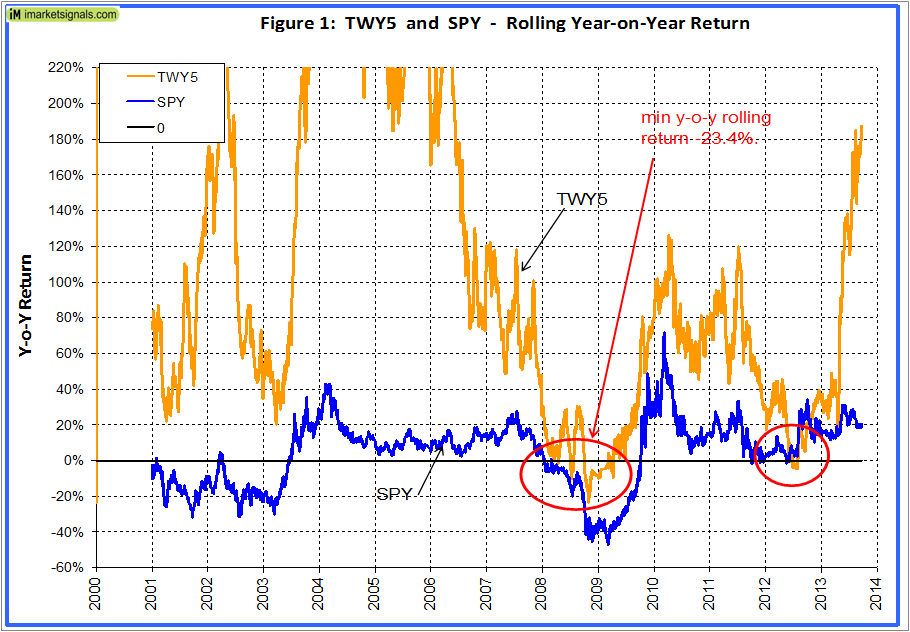
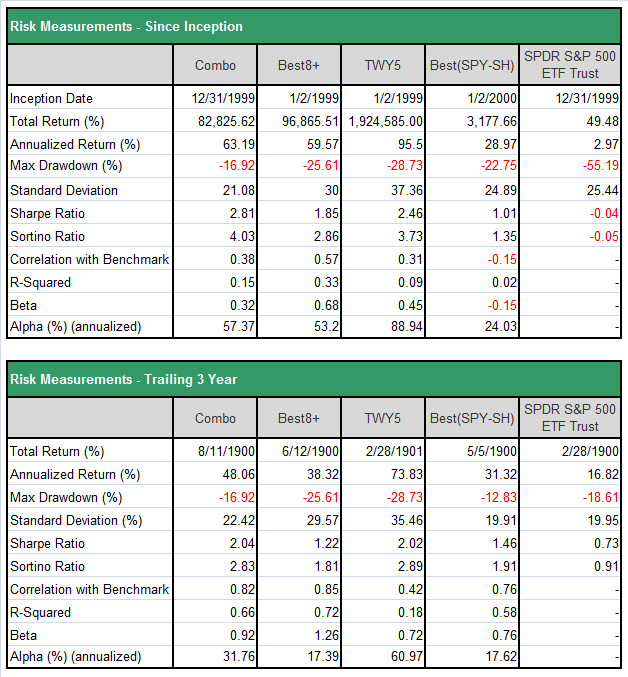
Figure 1 shows the rolling 1-year returns for TWY5. This is a 100% micro-cap model which from Jan-2000 to Aug-2013 would have had an annualized return of 95.5% with a maximum drawdown of -28.7%. This is a spectacular return, but as one can see an investor would probably have been disappointed by the negative 1-year returns during 2008-2009 and also in 2012.
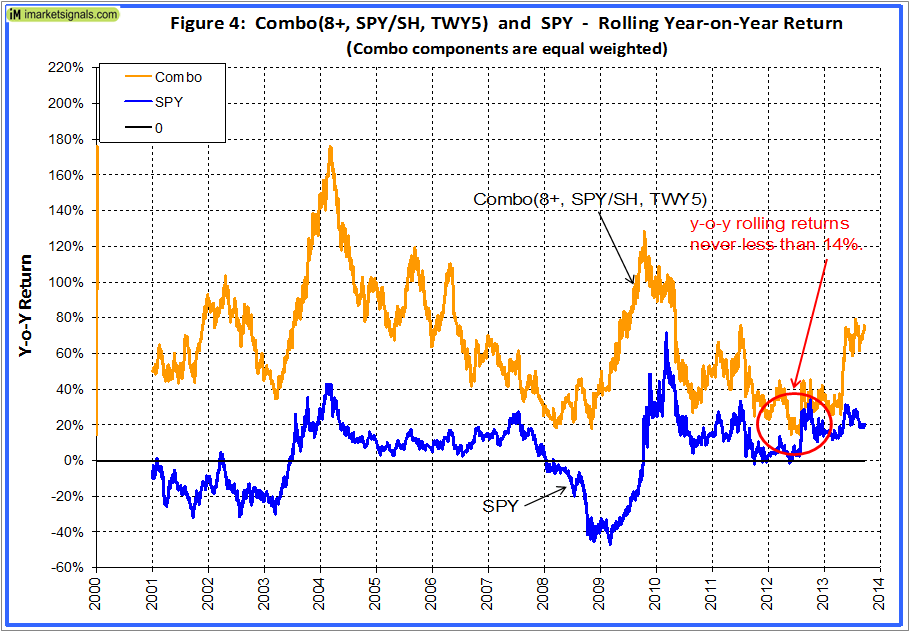
The benefit of adding Best(SPY-SH) is shown in Figures 4 and 4a, which depict the rolling 1-year returns for combinations of [TWY5, Best8+, Best(SPY-SH)] and [TWY5, Best(SPY-SH)], respectively – in both cases there were only positive returns.
 (click to enlarge)
Combo Mode
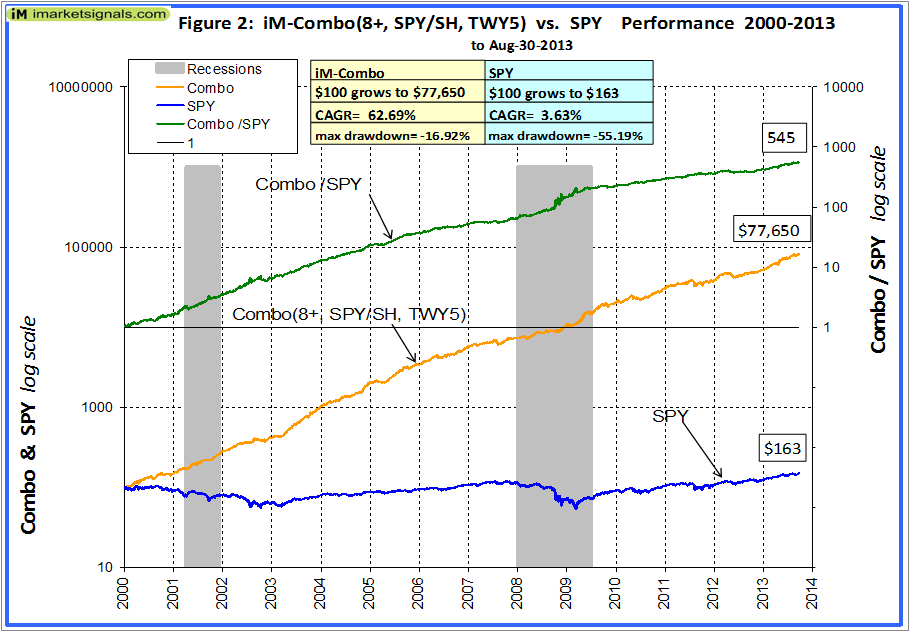
The equal weighted combination of TWY5, Best8+ and Best(SPY-SH) produces a model with steady returns, with an asset mix of large-caps= 48%, mid-caps= 9%, small-caps= 3% and micro-caps=40%. The annualized return reduces to 62.7% and the maximum drawdown becomes a low -16.9%, as shown in Figure 2.
The equal weighted combination of TWY5 and Best(SPY-SH) produced very similar returns to the 3-model combination, with an asset mix of large-cap ETFs= 50% and micro-caps= 50%. The annualized return would have been to 61.5% and the maximum drawdown also a low -16.6%, as shown in Figure 2a.
 (click to enlarge)
 (click to enlarge)
The annual returns are shown in Figure 3 and 3a for the 3-model and for the 2-model combination, respectively.
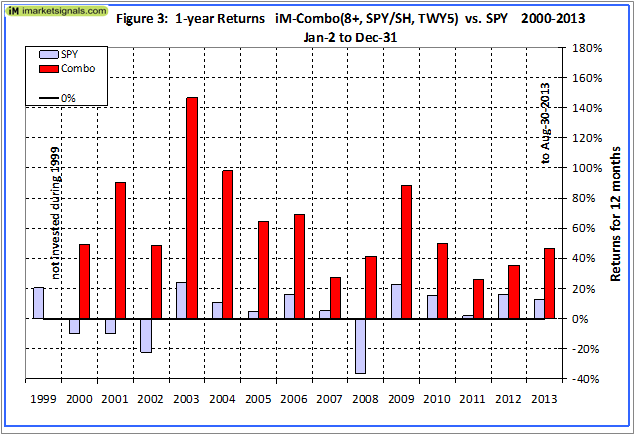
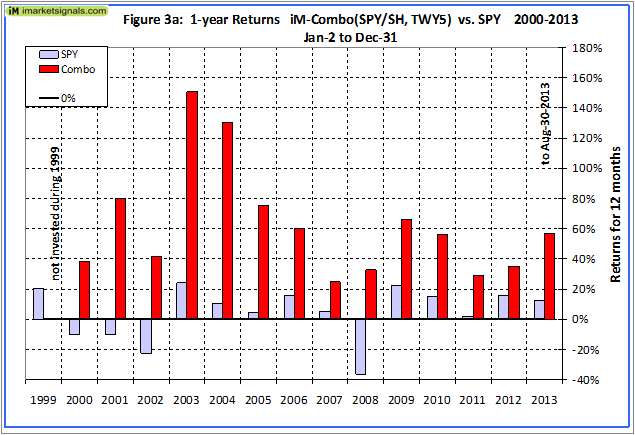
Figure 4 shows the rolling 1-year returns starting each trading day from 2000 to 2012 for the 3-model combination and in Figure 4a for the 2-model combination.
 (click to enlarge)
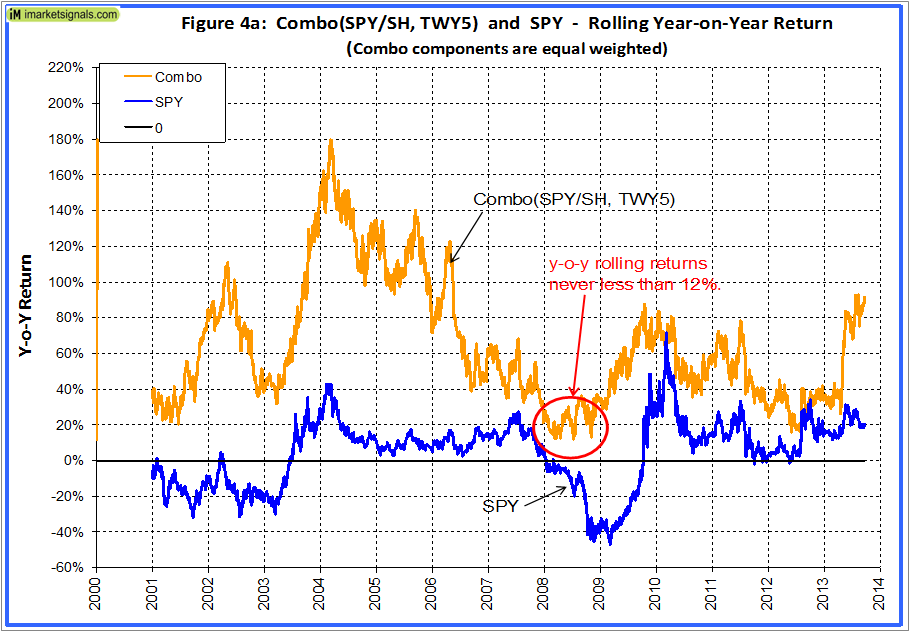 (click to enlarge)
Correlation
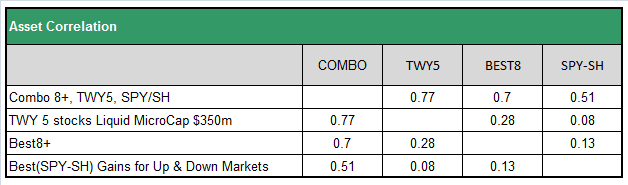
From the table below it is evident that the 3 assets in the combination have a very low correlation to each other. The two stock systems, Best8+ and TWY5, have correlation of just a 0.28 to each other, and only a correlation of about 0.08 with Best(SPY-SH). From a portfolio construction standpoint, the combination should be more robust than any single system on its own.
Risk Analysis
Note that the risk measurements for the combination are better than for any of the individual models, thus the combination should be more robust than any single system on its own. Particularly the high Sharpe- and Sortino Ratios for the combination are noteworthy.
Portfolio Size
The maximum portfolio size is dependent on the liquidity of the stocks in the model. To calculate the maximum size a portfolio can handle without incurring too much slippage the following formula is recommended:
($LiquidityBottom20Pct * #Position * 5%) / WeeklyTurnover%
– 5% is the maximum amount traded without affecting the stock price.
– Portfolios with low turnover allow far greater # of subscribers.
The micro-cap model TWY5 has the lowest liquidity of the bottom 20 Pct, and is thus the critical model in the combination.
$LiquidityBottom20Pct = $0.43MM
#Position = 5
AnnTurnover% = 895%
WeeklyTurnover% = 17.2%
Max Port Size = ($0.43MM * 5 * 5%) / 17.2% = $0.63MM
Assuming each subscriber invested $30K, then the models should easily support 21 subscribers. Currently it has 6, and together with a sister model 23.
For the 3-model combination the portfolio size could therefore be 3-times higher, about $100K could be easily traded by 25 individual investors.
All looks very interesting but I have two problems with this. First you are using other models in P123 which you know nothing about – I may be wrong about this – P123
models (or those by subscribers) have a history of failing in a major market correction – I have seen it happen in 2008-10. Second and more important, the number of seats allocated for these models are so small that they will likely be closed until the model fails to perform.
The purpose of the blog was to demonstrate the risk reduction when combinig simulation models with Best(SPY-SH). It is not an invitation to subscribe to the stock models, which in any case are full.
I found that the components of combo models shoud have low correlations to each other for best risk adjusted returns. I have no idea how these models will fare if we have another financial crisis. One should watch the recession indicators BCI and COMP and get into cash when they signal recession – never mind what the P123 models indicate then.
Thanks. It is useful to be able to see two or three models blended together and this certainly of interest. Thanks
We will be posting another combo soon, consisting of 4 large-caps models from other designers plus Best(SPY-SH). The combo has virtually no liquidity constraints, moderate turnover, CAGR=32.4%, max drawdown= -9.6%, and rolling 1-yr returns never less than +8% and always higher than for the S&P500, from 2000 to 2013.
I am interested in seeing this data and its timing to also backtest using SDS + SSO.
Thanks
Best(SDS-SSO) is not an independent model. It uses the signals from the Best(SPY-SH) model, and replaces SPY with SDS and SH with SSO.
So it cannot be run together in a combo on the simulation platform with other models. Probably one can get close by doubling the weight of Best(SPY-SH) in the combo.