
The Best8+ Best8+ algorithm has been improved to achieve a CAGR of 60.27% to outperforming the the S&P 500 with dividends (SPY) 522 times, that is for an investment over a period from January 2, 1999 to May 31, 2013. In comparison to this deprecated version that achieved a CAGR of 55.23% which outperformed the SPY by a factor of 333.
The Best8+ system periodically selects the 8 highest ranked stocks (or less when draw-down protection rules are in effect) from a segment of the market that avoids stocks of companies with very high market capitalization, and also those which operate in certain industries which have historically produced low returns for investors. When certain adverse stock market conditions exist the model goes to cash and switches to TLT, the iShares 20 Plus Year Treasury Bond ETF.
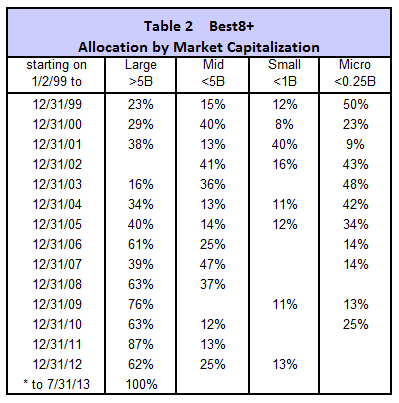
Typically over the last 14 years the proportion of stocks in the portfolio was about 49% Large-, 22% Mid-, 8% Small-, and 21% Micro-Caps. During the last 3 years it mainly held Large- and Mid-Cap stocks, correctly identifying them as being undervalued.
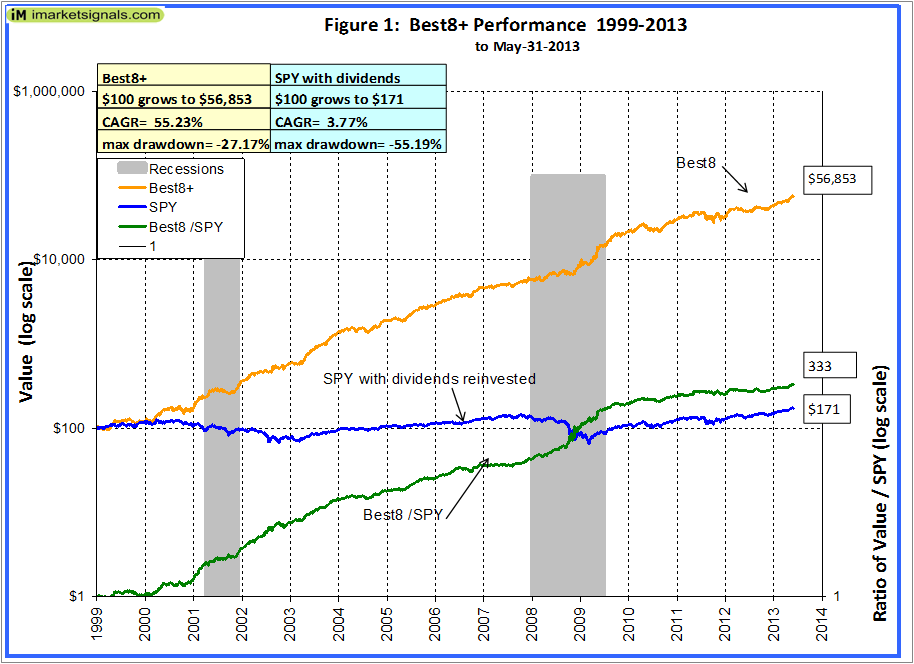
The graph of the system’s performance against the benchmark SPY with dividends has a rising slope from 2000 onwards indicating that performance was always better than the benchmark’s, producing about 333 times more value from January 1999 than what a continuous investment in SPY would have provided.
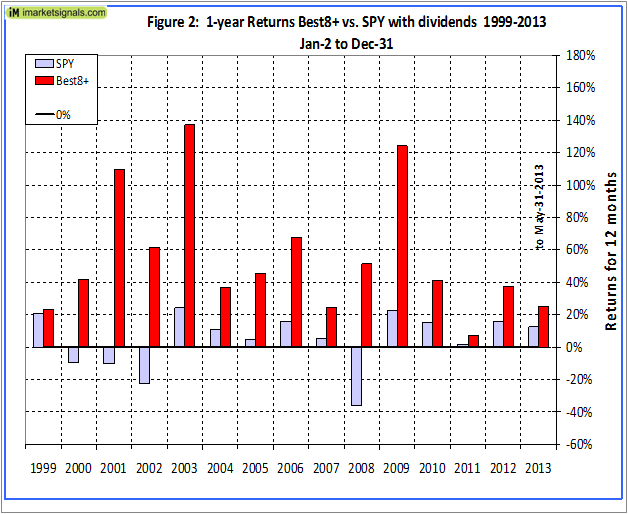
Rolling 1-year returns were calculated starting each day from 1999 to 2012. There was never a loss over any 1-year period. The minimum return over 1 year was 0.5% and the maximum was 210%.
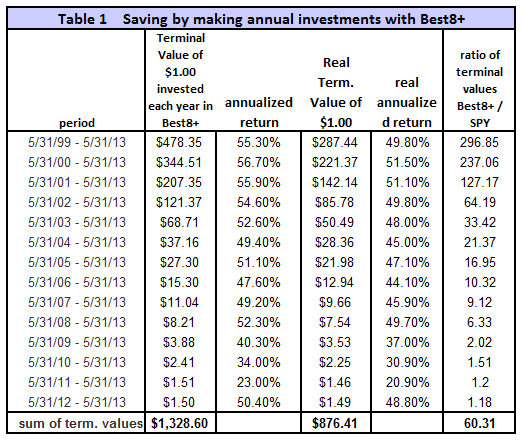
To simulate savings over time, terminal values were calculated to the end of May 2013 for annual hypothetical investments of $1. Starting with a dollar during each of the 14 years from 1999 to 2012, one would have invested a total of $14 cumulatively by the end. Summing the 14 terminal values, this strategy would have netted this dollar-per-year investor $1,328 at the end of 14 years. Following a buy-and-hold strategy in SPY, one would have only $22, about 1.7% of what Best8+ provided. Furthermore, the lowest annualized return, for any of the 14 time periods was 23% and the average for all the periods was 48%.
The last 36 trades for a portfolio having a value of about $12-million were reviewed together with the actual total trading volume for these stocks on the days when the model’s trades occurred. The individual trades require a fairly large number of shares to be bought and sold, but are still a reasonably small fraction of the total daily volume traded, on average about 2.6% of the total. Defining the less liquid stocks as those whose percentage of the day’s volume to be traded exceeds 3% of the actual daily volume, and assuming one can trade about 5% of these without affecting stock prices detrimentally, then the total value of this portfolio should not be higher than about $8- to $10-million.
This system would be suitable for good number of individual investors with smaller portfolios trading 2 to 6 stocks each week (resulting in a moderate average annual portfolio turnover of 765%); it is not intended for professional fund managers. On average a stock was held for 43 days and thus one can easily build a major position over a few days after the Monday recommendation without affecting the stock price.
This portfolio management system requires a few trades each week. A simple ranking system is consistently applied to the stock selection process, which a sensitivity study showed to be very robust. This is this not a complex, high risk system with many parameters which could easily break down. The backtesting returns are not distorted by survivorship bias, and this model should continue to outperform in the future as well.
Note: The benchmark for this model is SPY with dividends, unlike most other R2G models which have an index without dividends as a benchmark, and therefore show performance comparisons distorted to the high side. This model has been backtested over the entire available period for which data exists at P123. It does not avoid the difficult years 1999 and 2000 like many other models which conveniently have a later inception date.
Looking forward to its launch!
George, Your work is outstanding and a joy to follow. I have 2 questions: 1) Do you know why the ratio of the “Best 8” to SPY has narrowed so much in the last 4 years, and 2) you mention a portfolio of 12M and then say that investors with smaller portfolios could also use the system. Do have any data on the minimum size portfolio that would benefit from using the system. Thanks, Mike
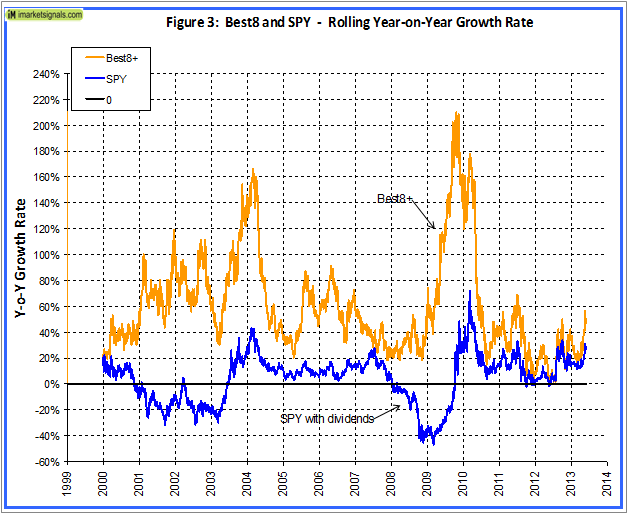
Mike, the reason for the ratio Best8/SPY narrowing is the bull market which we had since March 2009. SPY gained at an annualized rate of 25.5% and Best8 at 53.6% since then. The ratio widens during flat or down markets.
I did not mean that one has to have $12MM to trade this model. The combined total investment of all the investors should not exceed this amount by a lot, otherwise one may run into liquidity constraints for some of the smaller stocks the model selects.
I think the minimum portfolio shoud be in relation to what a subscription to P123 and Best8 costs. You have to do a cost-benefit study assuming various scenarios.
George, thank you for this site…What is the feasibility of using the “Best Stock Market Indicator Ever” or similar indicator to minimize volatility and reduce draw downs with this system?…thanks much, Bud
I have to give this some thought. You are really looking for a market timing system.
Bud, as requested, you will soon find on this site the iM-Best Market Timing model for the S&P500 using the SPY. I have removed the word ever, so that I can improve the model further.