
The latest interim buy signal from the modified Coppock indicator was generated at the end of October 2013, and this model will stay invested until September 2014, possibly longer if another buy signal appears before then.
The figure below shows the S&P 500 from 2005 to 2013, the modified Coppock indicator, the buy signals, and the model’s investment periods (gray shaded periods). Buy signal dates are indicated by the black vertical lines on the chart.
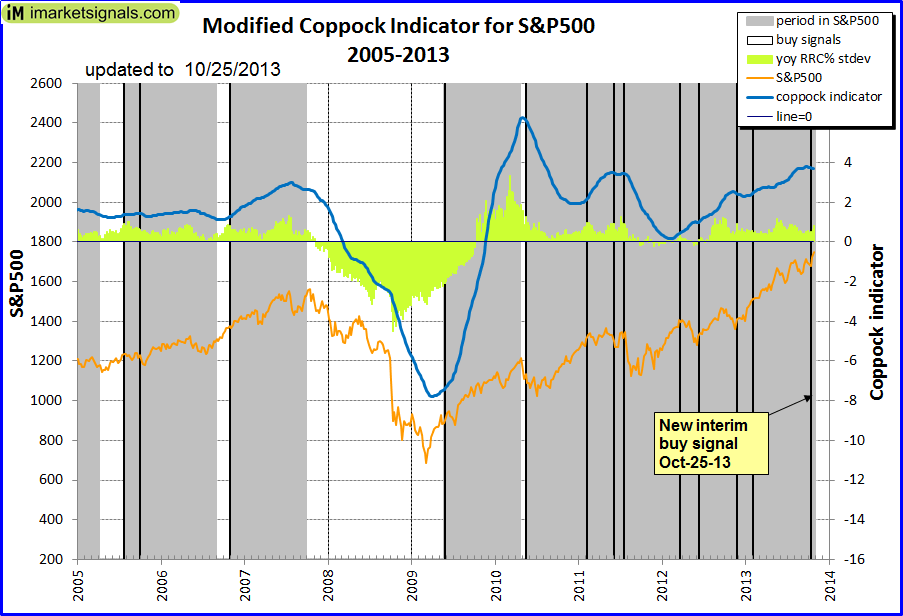 (click to enlarge)
The percentage change of the year-over-year rolling returns for the S&P 500 expressed in standard deviation terms for a 5-year rolling sample period is also shown (the yellow area graph, referred to as “yoy RRC% stdev”). This gives an indication of whether the S&P is overbought or oversold, depending on the magnitude of this indicator.
Sell signals cannot be determined with this indicator, but a good strategy was to sell when the S&P had appreciated by 38%, but not later than 48 weeks after a buy signal date. However, if a new buy signal appeared before the sell date applicable to the previous buy signal, then the sell criteria was applied from the new buy signal’s date onwards, and so on
Leave a Reply
You must be logged in to post a comment.